
70 Years for Every Child
The STaTe of The World'S Children 2016 A fair chance for every child
aCKnoWledGeMenTS This report is the result of collaboration among many individuals and institutions. The editorial and research team thank all who gave so willingly of their time, expertise and energy, in particular: Advisory Board: Yoka Brandt, Deputy Executive Director; Geeta rao Gupta, Deputy Executive Director; Gerard Bocquenet, Ted Chaiban, Sarah Cook, Paloma escudero, andres franco, Claudia Gonzalez romo, Goran holmqvist, Karin hulshof, afshan Khan, olav Kjørven, Jeffrey o’Malley. Programme and Policy Guidance: abdul alim, david anthony, ivelina Borisova, Josephine Bourne, nicola Brandt, Jingqing Chai, Kim dickson, Martin evans, antonio franco Garcia, Vidhya Ganesh, Katherine holland, Tamara Kummer, George laryea-adjei, dheepa Pandian, david Stewart, Morgan Strecker, Guy Taylor, Justin Van fleet, rudina Vojvoda, frank Borge Wietzke, alexandra Yuster, Maniza Zaman. Thank you to rachel Sabates-Wheeler and Jennifer Yablonski for the background paper, ‘Social protection and child poverty: evidence, practice, and gaps’, and to Gonzalo fanjul for the background paper ‘Child poverty and inequality in rich countries’. Thank you to ravneet ahluwalia and Vivek Kumar for their help with the Perspective essays. Communication team: Justin forsyth, Deputy Executive Director; Paloma escudero, Director, Division of Communication; edward Carwardine, Deputy Director, Division of Communication; Maurico aguayo, nigina Baykabulova, Gerrit Beger, Penni Berns, Marissa Buckanoff, Patricia Codyre, eliana drakopoulos, Jedd flanscha, Claudia Gonzalez romo, Bayann hamid, Chulho hyun, angus ingham, Malene Jensen, Ueli Johner, ariel Kastner, nicholas ledner, Marixie Mercado, najwa Mekki, Christine nesbitt, david ohana, rebecca obstler, laetitia Pactat, Katarzyna Pawelczyk, hugh reilly, abhijit Shanker, Melanie Sharpe, arissa Sidoti, Tanya Turkovich, Sonia Yeo. UniCef country and regional offices and headquarters divisions contributed to this report by taking part in formal reviews or commenting on drafts. Many field offices and UniCef national committees arranged to translate or adapt the report for local use. rePorT TeaM EDITORIAL AND RESEARCH Kevin Watkins, principal author; Maria Quattri, research and technical advice on data; Tara dooley, hirut Gebre-egziabher, anna Grojec, Yasmine hage, Catherine © United nations Children’s fund (UniCef) langevin-falcon, Timothy ledwith, Céline little, Baishalee nayak, Carlos Perellon, ami Pradhan, Charlotte rutsch, Zahra Sethna, Jordan Tamagni. June 2016 DATA AND ANALYTICS Permission is required to reproduce any part of agbessi amouzou, robert Bain, nassim Benali, david Brown, Claudia Cappa, liliana this publication. Permissions will be freely granted Carvajal, Karoline hassfurter, hiroyuki hattori, lucia hug, Priscilla idele, Claes to educational or non-profit organizations. others Johansson, Julia Krasevec, Vrinda Mehra, Padraic Murphy, Colleen Murray, Khin will be requested to pay a small fee. Please Wityee oo, nicole Petrowski, Tyler Porth, Shahrouh Sharif, Tom Slaymaker, Chiho contact: Suzuki, haogen Yao, danzhen You. division of Communication, UniCef PRODUCTION AND DISSEMINATION attn: Permissions Samantha Wauchope, Production Specialist; Germain ake, ernest Califra. 3 United nations Plaza, new York, nY 10017, USa Tel: +1 (212) 326-7434 DESIGN email: nyhqdoc.permit@unicef.org Publication and graphic design for the latest data, please visit . Soapbox, www.soapbox.co.uk infographics on pages 3, 11, 42, 70 and 90. iSBn: 978-92-806-4838-6
The STaTe of The World'S Children 2016 A fair chance for every child
Contents foreword The state of the world's children by Anthony Lake , Executive Director, UNICEF vi Introduction reaching every Why focus on equity now? 3 child: The promise Meeting the equity imperative 5 of equity pages viii–7 01 Child health: Patterns and risks of child mortality 10 a fair start in life Prospects for child survival 12 pages 8–39 inequities in child survival 13 disparities in access and quality of care 20 low-cost interventions can make a difference 21 reaching the most vulnerable 21 What if the gaps are not closed? 24 equity objectives 26 high return on health investments 26 Benefits of universal health coverage 29 adequate and equitable financing 34 Power in partnerships 37 The STaTe of The World’S Children 2016 ii
Contents, continued 02 education: access to education – from the start 42 levelling the equity and learning outcomes 46 playing field education in emergencies and protracted crises 52 pages 40–67 Benefits of quality education 55 reaching children throughout the learning process 56 equity targets 59 Teaching matters 60 education financing 61 The role of aid 62 equitable progress is possible 64 03 Children and The effects of poverty in childhood 70 poverty: Breaking Measuring how many children live in poverty 71 the vicious cycle Children living in extreme poverty 72 pages 68–87 Children living in ‘moderate’ poverty 75 Poor children living in rich countries 75 Child poverty in all its dimensions 78 disadvantages overlap and reinforce one another 78 Universal measurement of child poverty 80 The role of cash transfers in reducing poverty and inequality 81 Cash transfers and access to essential services 83 expanding social protection – and looking ahead 84 04 Pathways information 90 to equity integration 92 pages 88–101 innovation 94 investment 97 involvement 99 The STaTe of The World’S Children 2016 iii
Contents, continued Perspectives a fair chance for girls – end child marriage by Angélique Kidjo 38 Give children a chance by Gordon Brown 66 What are we waiting for? Sustainable societies begin with children by Kailash Satyarthi 86 endnotes 102 list of Boxes BoX 1. equity defined 7 BoX 1.1. female volunteers help health workers reach the marginalized in nepal 23 BoX 1.2. every child counts: The importance of quality data on child survival 27 BoX 1.3. Bangladesh shows the challenge of sustained progress in child survival 35 BoX 1.4. health equity funds provide free health care to the poor 36 BoX 1.5. eliminating malnutrition can help break the cycle of unequal opportunity 36 BoX 2.1. The developing brain: an early window of opportunity for learning 50 BoX 2.2. The destructive impact of armed conflict on education 53 BoX 2.3. Brazil and Viet nam: Making the grade 63 BoX 3.1: Monetary child poverty measures 72 BoX 3.2. Measuring multidimensional child poverty 74 list of figures figure 1.1. Countries with limited economic growth can still reduce child mortality 13 figure 1.2. Progress in under-five mortality does not necessarily come with greater equity 14 figure 1.3. The poor will need to make faster progress to reach the 2030 goal 15 figure 1.4. Progress must accelerate for the least advantaged children 18 figure 1.5. accelerated progress in neonatal mortality is key to meeting the SdG target 22 figure 1.6. Many countries will miss the under-five mortality target, some by a wide margin 25 figure 1.7. antenatal care and skilled birth attendance save newborn lives 29 figure 1.8. in 63 countries, equity in intervention coverage could reduce under-five mortality rates by almost 30 per cent 30 figure 1.9. Many countries do not have enough health providers 32 figure 2.1. More than half of the 59 million out-of-school children live in sub-Saharan africa 44 The STaTe of The World’S Children 2016 iv
Contents, continued figure 2.2. if current trends persist, the world is off-track to reach primary and secondary education for all by 2030 45 figure 2.3. Many girls and boys drop out as they transition through education levels 45 figure 2.4. in Pakistan, the level of education achieved depends on gender, residence and wealth 47 figure 2.5. Wealth, gender and residence affect education in nigeria 48 figure 2.6. Wealth-based gaps in basic math skills start early and persist over time 49 figure 2.7. early childhood education gaps vary by wealth and residence 57 figure 2.8. Progress must accelerate for the least advantaged children 58 figure 3.1. a disproportionate share of children live in extreme poverty 73 figure 3.2. in 2030, 9 out of 10 children in extreme poverty will live in sub-Saharan africa 74 figure 3.3. More than half of the population in low- and middle-income countries live on less than US$5 a day 76 figure 3.4. in most european Union countries, children are at higher risk of monetary poverty than adults 77 Statistical Tables overview 108 pages 107–172 General note on the data 108 Child mortality estimates 109 Under-five mortality rankings 110 regional classification 112 notes on specific tables 113 Table 1. Basic indicators 118 Table 2. nutrition 122 Table 3. health 126 Table 4. hiV/aidS 130 Table 5. education 134 Table 6. demographic indicators 138 Table 7. economic indicators 142 Table 8. Women 146 Table 9. Child protection 150 Table 10. The rate of progress 154 Table 11. adolescents 158 Table 12. disparities by residence 162 Table 13. disparities by household wealth 166 Table 14. early childhood development 170 The STaTe of The World’S Children 2016 v
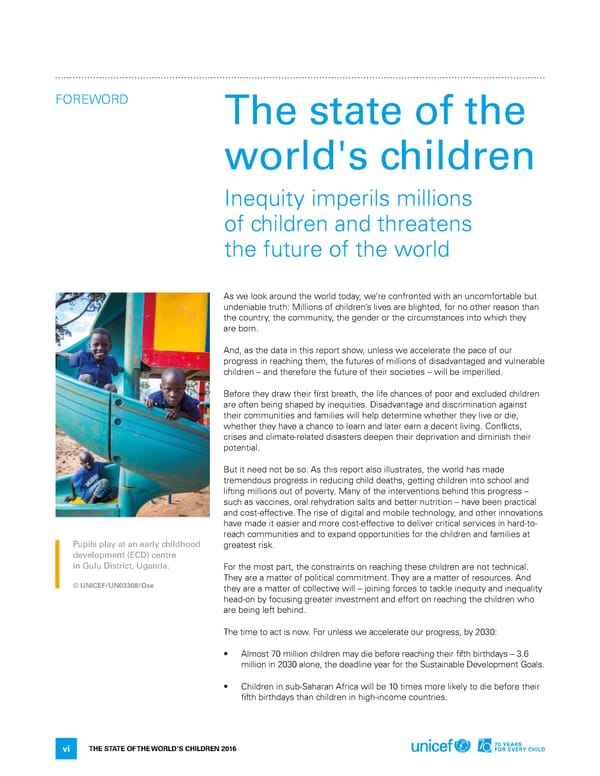
foreWord The state of the world's children inequity imperils millions of children and threatens the future of the world as we look around the world today, we’re confronted with an uncomfortable but undeniable truth: Millions of children’s lives are blighted, for no other reason than the country, the community, the gender or the circumstances into which they are born. and, as the data in this report show, unless we accelerate the pace of our progress in reaching them, the futures of millions of disadvantaged and vulnerable children – and therefore the future of their societies – will be imperilled. Before they draw their first breath, the life chances of poor and excluded children are often being shaped by inequities. disadvantage and discrimination against their communities and families will help determine whether they live or die, whether they have a chance to learn and later earn a decent living. Conflicts, crises and climate-related disasters deepen their deprivation and diminish their potential. But it need not be so. as this report also illustrates, the world has made tremendous progress in reducing child deaths, getting children into school and lifting millions out of poverty. Many of the interventions behind this progress – such as vaccines, oral rehydration salts and better nutrition – have been practical and cost-effective. The rise of digital and mobile technology, and other innovations have made it easier and more cost-effective to deliver critical services in hard-to- reach communities and to expand opportunities for the children and families at Pupils play at an early childhood greatest risk. development (ECD) centre in Gulu District, Uganda. for the most part, the constraints on reaching these children are not technical. They are a matter of political commitment. They are a matter of resources. and © UNICEF/UN03308/Ose they are a matter of collective will – joining forces to tackle inequity and inequality head-on by focusing greater investment and effort on reaching the children who are being left behind. The time to act is now. for unless we accelerate our progress, by 2030: • almost 70 million children may die before reaching their fifth birthdays – 3.6 million in 2030 alone, the deadline year for the Sustainable development Goals. • Children in sub-Saharan africa will be 10 times more likely to die before their fifth birthdays than children in high-income countries. The STaTe of The World’S Children 2016 vi
• nine out of 10 children living in extreme poverty will live in sub-Saharan africa. • More than 60 million primary school-aged children will be out of school – roughly the same number as are out of school today. More than half will be from sub-Saharan africa. • Some 750 million women will have been married as children – three quarters of a billion child brides. These vast inequities and dangers do more than violate the rights and imperil the futures of individual children. They perpetuate intergenerational cycles of disadvantage and inequality that undermine the stability of societies and even the security of nations everywhere. More than ever, we should recognize that development is sustainable only if it can be carried on – sustained – by future generations. We have an opportunity to replace vicious cycles with virtuous cycles in which today’s poor children – if given a fair chance at health, education and protection from harm – can, as adults, compete on a more level playing field with children from wealthier backgrounds. Thus making not only their own lives better, but their societies richer in every sense of the word. for when we help a boy access the medicine and nutrition he needs to grow up healthy and strong, we not only increase his chances in life, we also decrease the economic and social costs associated with poor health and low productivity. When we educate a girl, we not only give her the tools and knowledge to make her own decisions and shape her own future, we also help raise the standard of living of her family and her community. When we provide education, shelter and protection for children caught in conflicts, we help mend their hearts and their minds – so that someday, they will have the ability and the desire to help rebuild their countries. This report concludes with five ways to strengthen our work, building on what we have learned over the last 25 years – and what we are still learning: increasing information about those being left behind. integrating our efforts across sectors to tackle the multiple deprivations that hold so many children back. innovating to accelerate progress and drive change for the most excluded children and families. investing in equity and finding new ways of financing efforts to reach the most disadvantaged children. and involving everyone, beginning with communities themselves, and with businesses, organizations and citizens around the world who believe we can change the outcome for millions of children. We can. inequity is not inevitable. inequality is a choice. Promoting equity – a fair chance for every child, for all children – is also a choice. a choice we can make, and must make. for their future, and the future of our world. Anthony Lake executive director, UniCef The STaTe of The World’S Children 2016 vii
REACHING EvERY CHILD THE PROMISE OF EqUITY The STaTe of The World’S Children 2016 viii
inTrodUCTion Reaching every child The promise of equity If the soul of a society can be judged by the way it treats its most vulnerable members, then by a similar measure, a society’s future – its long-term prospects for sustainable growth, stability and shared prosperity – can be predicted by the degree to which it provides every child with a fair chance in life. Providing every child with that fair chance is the essence of equitable development. And as this edition of The State of the World’s Children argues, promoting equity is more than a moral obligation. It is both a practical and a strategic imperative, helping to break intergenerational cycles of disadvantage and thus reducing the inequalities that undermine all societies. Musamat (sitting and facing every child is born with the same inalienable right to a healthy start in life, an camera), 6, plays a game at the education and a safe, secure childhood – all the basic opportunities that translate Bakchora pre-primary school into a productive and prosperous adulthood. But around the world, millions of in Satkhira Sadar, Bangladesh. children are denied their rights and deprived of everything they need to grow up healthy and strong – because of their place of birth or their family of origin; because © UNICEF/UN016332/Gilbertson vII of their race, ethnicity or gender; or because they live in poverty or with a disability. Photo how do these deprivations manifest themselves in the life of a child, on the journey to adulthood? an infant deprived of post-natal care may not survive her first days. a child deprived of immunization or safe water may not live to see his fifth birthday, or may live a life of diminished health. a child deprived of adequate nutrition may never reach his full physical or cognitive potential, limiting his ability to learn and earn. a child deprived of quality education may never gain the skills she needs to succeed someday in the workplace or send her own children to school. and a child deprived of protection – from conflict, violence or abuse, from exploitation and discrimination, from child labour, or early marriage and motherhood – may be physically and emotionally scarred for life, with profound consequences. The STaTe of The World’S Children 2016 1
Reaching every child: The promise of equity how do such inequities manifest themselves in the countries and communities where these children grow up? The evidence is all around us, in the form of cycles of deprivation that are transmitted from one generation to the next, deepening inequality that threatens societies everywhere. Children who do not have the opportunity to develop the skills they will need to compete as adults can neither break these vicious cycles in their own lives nor give their children a chance to fulfil their potential. Their societies, too, are deprived of the full contribution they might have made. left unaddressed, gaps will grow wider and cycles more vicious, affecting more children. This is especially true in a world increasingly beset by violent conflict, chronic crises and other humanitarian emergencies caused by natural disasters and the growing effects of climate change – all of which affect children disproportionately, and the most disadvantaged and vulnerable children most of all. This report’s call to action is, therefore, motivated by a sense of urgency and the conviction that a different outcome, and a better world, are possible. Children born into poverty and deprivation are not doomed to live lives of despair. inequity is not inevitable, if governments invest in expanding opportunity for every child – shifting policies, programming and public spending priorities so the most disadvantaged have a chance to catch up with the most advantaged. as the report shows, the good news is that there are more effective – and cost- effective – ways to reach the hardest-to-reach children, families and communities. new technology, the digital revolution, innovative ways to finance critical interventions and citizen-led movements are all helping to drive change for the most disadvantaged. investing in these interventions and initiatives, and fuelling these emergent movements, will yield both short- and long-term benefits for millions of children and their societies. The arithmetic of equity is relatively simple, and it is not a zero-sum game. everyone should move forward, in rich and poor countries alike. But with greater investment and effort focused on reaching the children and families who have made the least progress, advances in child survival, health and education can be more equally shared to the benefit of all. To realize our global development goals, we must invest first in the children who are furthest behind. investing in the most disadvantaged is not only right in principle. evidence shows that it is also right in practice. in a 2010 study,1 UniCef demonstrated that an equity-focused approach would accelerate progress towards global health goals faster than could be achieved by the current path and would be especially cost- effective in low-income, high-mortality countries. The study was based on a simulation that tested two scenarios for achieving maternal and child health goals. one approach emphasized a greater effort to reach children who were worse off. The other was a stay-the-course method that did not place special emphasis on the disadvantaged. Two key findings emerged: first, by addressing the concentration of various forms of inequity in the most disadvantaged populations, an equity approach accelerated progress towards realizing the health goals faster than the stay-the-course path. Second, by averting more deaths with the same financial investments, the equity approach was considerably more cost-effective and sustainable than the alternative. So investing in equity is not only a moral necessity. it is a practical and strategic imperative as well. The STaTe of The World’S Children 2016 2
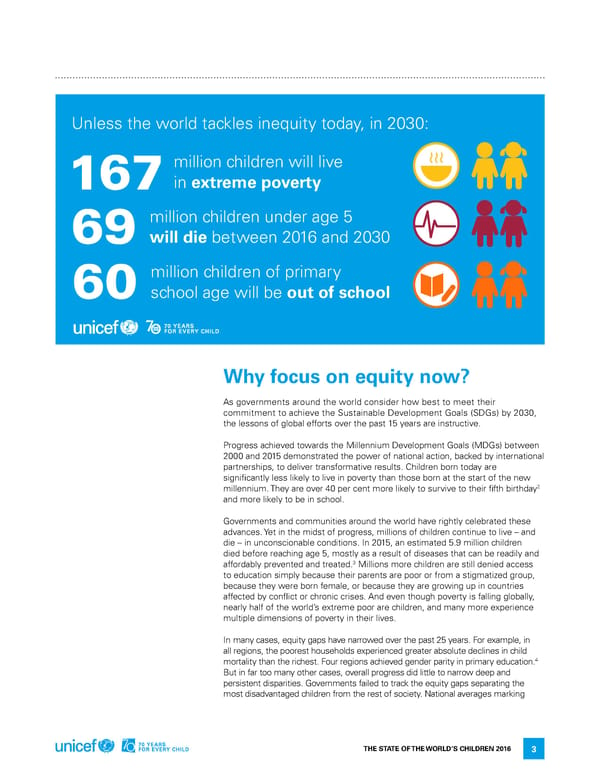
Unless the world tackles inequity today, in 2030: million children will live 167in extreme poverty million children under age 5 69will die between 2016 and 2030 million children of primary 60school age will be out of school Why focus on equity now? as governments around the world consider how best to meet their commitment to achieve the Sustainable development Goals (SdGs) by 2030, the lessons of global efforts over the past 15 years are instructive. Progress achieved towards the Millennium development Goals (MdGs) between 2000 and 2015 demonstrated the power of national action, backed by international partnerships, to deliver transformative results. Children born today are significantly less likely to live in poverty than those born at the start of the new 2 millennium. They are over 40 per cent more likely to survive to their fifth birthday and more likely to be in school. Governments and communities around the world have rightly celebrated these advances. Yet in the midst of progress, millions of children continue to live – and die – in unconscionable conditions. in 2015, an estimated 5.9 million children died before reaching age 5, mostly as a result of diseases that can be readily and 3 affordably prevented and treated. Millions more children are still denied access to education simply because their parents are poor or from a stigmatized group, because they were born female, or because they are growing up in countries affected by conflict or chronic crises. and even though poverty is falling globally, nearly half of the world’s extreme poor are children, and many more experience multiple dimensions of poverty in their lives. in many cases, equity gaps have narrowed over the past 25 years. for example, in all regions, the poorest households experienced greater absolute declines in child mortality than the richest. four regions achieved gender parity in primary education.4 But in far too many other cases, overall progress did little to narrow deep and persistent disparities. Governments failed to track the equity gaps separating the most disadvantaged children from the rest of society. national averages marking The STaTe of The World’S Children 2016 3
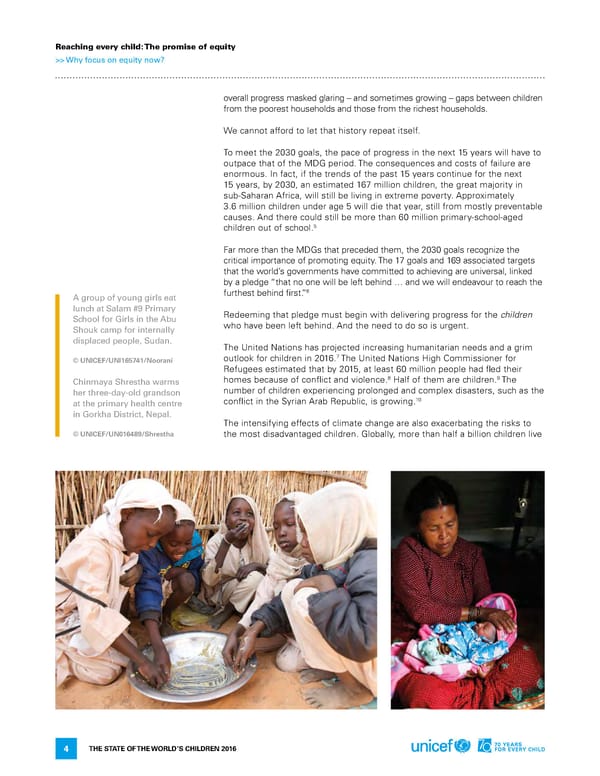
Reaching every child: The promise of equity >> Why focus on equity now? overall progress masked glaring – and sometimes growing – gaps between children from the poorest households and those from the richest households. We cannot afford to let that history repeat itself. To meet the 2030 goals, the pace of progress in the next 15 years will have to outpace that of the MdG period. The consequences and costs of failure are enormous. in fact, if the trends of the past 15 years continue for the next 15 years, by 2030, an estimated 167 million children, the great majority in sub-Saharan africa, will still be living in extreme poverty. approximately 3.6 million children under age 5 will die that year, still from mostly preventable causes. and there could still be more than 60 million primary-school-aged 5 children out of school. far more than the MdGs that preceded them, the 2030 goals recognize the critical importance of promoting equity. The 17 goals and 169 associated targets that the world’s governments have committed to achieving are universal, linked by a pledge “that no one will be left behind … and we will endeavour to reach the 6 A group of young girls eat furthest behind first.” lunch at Salam #9 Primary redeeming that pledge must begin with delivering progress for the children School for Girls in the Abu who have been left behind. and the need to do so is urgent. Shouk camp for internally displaced people, Sudan. The United nations has projected increasing humanitarian needs and a grim 7 © UNICEF/UNI165741/Noorani outlook for children in 2016. The United nations high Commissioner for refugees estimated that by 2015, at least 60 million people had fled their homes because of conflict and violence.8 9 Chinmaya Shrestha warms half of them are children. The her three-day-old grandson number of children experiencing prolonged and complex disasters, such as the 10 at the primary health centre conflict in the Syrian arab republic, is growing. in Gorkha District, Nepal. The intensifying effects of climate change are also exacerbating the risks to © UNICEF/UN016489/Shrestha the most disadvantaged children. Globally, more than half a billion children live The STaTe of The World’S Children 2016 4
in zones where the occurrence of flooding is extremely high, and nearly oUr neW TarGeTS for 160 million live in zones where the severity of drought is high or extremely 11 Children CannoT Be aChieVed high. The World health organization has projected that approximately UnleSS We MaKe The MoST 250,000 additional deaths will occur annually through 2030 from malnutrition, 12 malaria, diarrhoea and heat stress attributable to climate change. diSadVanTaGed Children a PrioriTY. The challenges of reaching these children with essential services and protection are considerable, but so are the benefits to be gained. and we must reach them. for if we do not, we are likely to see hard-won development gains slip away and watch the consequences of this failure play out across the world. There is no question that progress for the most disadvantaged children and families is the defining condition for delivering on the 2030 goals and determining the future opportunities of generations to come. The time to act is now. Meeting the equity imperative Thirty-five years ago, the first State of the World’s Children report commented on an earlier set of development goals. The question arises, the authors wrote, “as to whether these goals are ... launched with no more than a wing and a 13 prayer or are they validated by hard evidence that they can be achieved?” This report contends that our new targets for children cannot be achieved unless we make the most disadvantaged children a priority, shifting policies, programmes and public spending to promote greater equity. The areas in which children experience inequity are many, but in this report we Aida, 16, and her baby, born focus specifically on three areas that exemplify both the magnitude of the challenge prematurely in Bwaila Hospital in and the immensity of the opportunity to improve the lives of millions of children. Lilongwe, Malawi. The report begins with the most glaring inequity of all – disparities in child © UNICEF/UN018540/Chikondi survival – and goes on to explore the underlying determinants of preventable The STaTe of The World’S Children 2016 5
Reaching every child: The promise of equity >> Meeting the equity imperative child mortality. it argues that to meet the 2030 child survival target, we must urgently address persistent disparities in maternal health, the availability of skilled birth attendants, adequate nutrition and access to basic services, as well as other factors such as discrimination, exclusion and a lack of knowledge about child feeding and the role of safe water, adequate sanitation and hygiene in preventing childhood disease. The discussion continues with a look at one of the most effective drivers of Child PoVerTY iS aBoUT More development and the greatest equalizer of opportunity: education. Without Than inCoMe. quality education, disadvantaged children are far more likely to be trapped as adults in low-skilled, poorly paid and insecure employment, preventing them from breaking intergenerational cycles of disadvantage. But a greater focus on early childhood development, on increasing education access and quality, and on providing education in emergencies will yield cascading benefits for both this generation and the next. having discussed two of the most glaring deprivations children face, this report then examines child poverty in all its dimensions – and the role social protection programmes play in reducing it. arguing that child poverty is about more than income, it presents a case for combining measures to reduce income poverty with integrated solutions to the many deprivations experienced by children living in poverty. finally, as a call to action, the report concludes with a set of principles to guide more equity-focused policy, planning and public spending. These broad principles include expanding information about who is being left behind and why; improving integration to tackle the multiple dimensions of deprivation; fostering and fuelling innovation to reach the hardest-to-reach children; increasing investment in equity-focused programmes; and driving involvement by communities and citizens around the world. Lunchtime at Kotingli Basic School, Northern Region, These principles are a guide more than a blueprint, but they can help shape Ghana. policy, frame priorities and inform the debate about the best way to deliver on the promise of the 2030 goals and secure a better future not only for the most © UNICEF/UN04350/Logan disadvantaged children, but for us all. The STaTe of The World’S Children 2016 6
BOx 1. EqUITY DEFINED The term ‘equity’ may mean different things in different Society’s institutions play a critical role in determining contexts, but when UNICEF uses it, in this report and these outcomes for children, most notably in health elsewhere, it refers to all children having the same and education. Where policies, programmes and opportunities to survive, develop and attain their public spending priorities are equitable, targeting full potential. Fundamentally, it is about fairness and those in greatest need, they can lead to good results opportunity – a fair chance for every child. for the most disadvantaged children. Where they are inequitable, they effectively preselect children The conviction that all children possess the same right for heightened risks of disease, hunger, illiteracy to grow up healthy, strong, well-educated and capable and poverty based on their country, community or of contributing to their societies is a cornerstone family of origin, their gender, race or ethnicity and of every international agreement to recognize and other factors. This can perpetuate intergenerational protect children’s rights. It culminated, in 1989, with the cycles of disadvantage, harming individual children adoption of the Convention on the Rights of the Child, and undermining the strength of their societies as the most rapidly and widely ratified human rights inequality deepens. treaty in history. An ‘equity approach’ to development begins with Inequity occurs when certain children are unfairly learning more about who is being left behind and why, deprived of the basic rights and opportunities available identifying the children at greatest risk and analysing to others. It is frequently rooted in complex cultural, the structural determinants of inequity – poverty, political and systemic factors that shape societies and geography and discrimination, for example – and the the socio-economic status of individuals. Ultimately, complex interplay among them. It requires asking these factors determine a range of outcomes, including hard questions about how deficient public policies, children’s well-being. discriminatory practices, inefficient delivery systems and other obstacles that prevent children from realizing their rights, and finding innovative solutions to these problems. It requires an integrated approach to closing the gaps, working across development and humanitarian sectors, at national, local and community levels, to reach every child. And, as much as anything else, it demands that the global community recognize the critical connection between the well-being of the most disadvantaged children and the future of our shared world. Children attend a remedial class, held inside a building sheltering displaced families in Homs, in the Syrian Arab Republic. © UNICEF/UNI137681/Morooka The STaTe of The World’S Children 2016 7
CHILD HEALTH: A FAIR START IN LIFE The STaTe of The World’S Children 2016 8
ChaPTer 1 Child health: a fair start in life When it comes to children realizing their right to survive and develop, the odds are stacked against those from the poorest and most disadvantaged households. That any child should face diminished prospects of survival or decent health because of the circumstances of his or her birth is grossly unfair and a violation of that child’s rights. It is also costly in human, economic, social and political terms. Sustainable progress for today’s children and future generations requires a focus on equity – giving every child a fair chance. Reaching the most marginalized children is more than an ethical imperative; it is a precondition for meeting the 2030 goals on child health and well-being. Prisca, 18, and her baby, in disparities in the survival and health prospects of children from different Bwaila Hospital in Lilongwe, backgrounds are not random. They systematically follow the contours of social Malawi. disadvantage linked not only to wealth but also to ethnicity, education and rural-urban divides, among other factors. © UNICEF/UN018535/Chikondi one of the most important lessons learned from efforts to improve child – and maternal – health in the past 15 years is that approaches focusing on overall progress will not eliminate the disparities that leave the poorest women and children at the highest risk. While even the poorest countries have achieved considerable progress, inequities persist. in terms of child survival, while the absolute gap has substantially narrowed since 1990, great inequities remain between rich and poor countries. The relative child mortality gap between sub-Saharan africa and South asia on one side and high-income countries on the other has barely changed in a quarter of a century. Children born in sub-Saharan africa are 12 times more likely than their counterparts in high-income countries to die before their fifth birthday, just 14 as they were in 1990. a child born in Sierra leone today is about 30 times more likely to die before age 5 than a child born in the United Kingdom. Women in sub-Saharan africa face a 1-in-36 lifetime risk of maternal mortality, compared to 1 in 3,300 in 15 high-income countries. The lifetime risk in Chad is 1 in 18. The STaTe of The World’S Children 2016 9
Child Health: A fair start in life >> Patterns and risks of child mortality narrowing the gaps between rich and poor countries is one of the defining challenges of our time. The starting point for achieving that outcome in child survival is to work towards bringing mortality rates among the poorest to the levels of the wealthiest within countries. Prospects for the survival and good health of all children in every society, rich and poor, should advance as quickly as possible. But the prospects of the children left furthest behind need the most rapid improvement. in other words, accelerated gains must be achieved among those facing the highest risks of death and disease. an effective approach to this challenge will have to address the wider social determinants of inequity, including poverty, discrimination and unequal access to basic services. Patterns and risks of child mortality for approximately 1 million children in 2015, their first day of life was also their last. Globally, the neonatal mortality rate (probability of dying during the first 28 days of life) is declining less rapidly than the mortality rate for children between 1 month and 5 years of age. This means that the share of under-five deaths occurring during the neonatal period is increasing. in 2015, neonatal deaths accounted for 45 per 16 cent of total deaths, 5 per cent more than in 2000. The rising share of deaths in the neonatal period reflects the faster decline in The Share of Under-fiVe mortality of children aged 1 to 59 months than of newborns. Still, of the 5.9 deaThS oCCUrrinG dUrinG million under-five deaths in 2015, almost half were caused by infectious diseases The neonaTal Period iS and conditions such as pneumonia, diarrhoea, malaria, meningitis, tetanus, inCreaSinG. measles, sepsis and aidS. Pneumonia and diarrhoea remain leading causes of death in the three regions with the highest under-five mortality: eastern and Southern africa, South asia and West and Central africa. The burdens of both disease and mortality are often highest among the most disadvantaged.17 There are marked regional variations around the broad neonatal trend. in sub-Saharan africa, newborn deaths account for about one third of the deaths of children under age 5. in regions with lower levels of child mortality, neonatal deaths comprise approximately half of the total. South asia, on the other hand, 18 has both high overall child mortality and a high share of neonatal deaths. The geographical distribution of the burden of child mortality is also changing. Globally, child deaths are highly concentrated. in 2015, about 80 per cent of these deaths occurred in South asia and sub-Saharan africa, and almost half occurred in just five countries: the democratic republic of the Congo, ethiopia, india, nigeria and Pakistan.19 Children living in fragile states and conflict-affected countries face elevated risks. according to the World development report 2011, they are more than twice as likely to be undernourished as children in low- and middle-income 20 countries, and twice as likely to die before age 5. among the 20 countries with the highest child mortality rates, 10 fall into the World Bank’s list of fragile contexts.21 in countries affected by conflict, damage to health systems threatens children’s lives. The Syrian arab republic, for instance, had made impressive progress in reducing under-five mortality prior to the current conflict there. Since 1990, the rate fell from 37 to 13 deaths per 1,000 live births. Since 2012, however, the country’s excess crisis mortality – that is, the under-five mortality attributable to crisis 22 conditions – has been an estimated one to two deaths per 1,000 live births. The STaTe of The World’S Children 2016 10
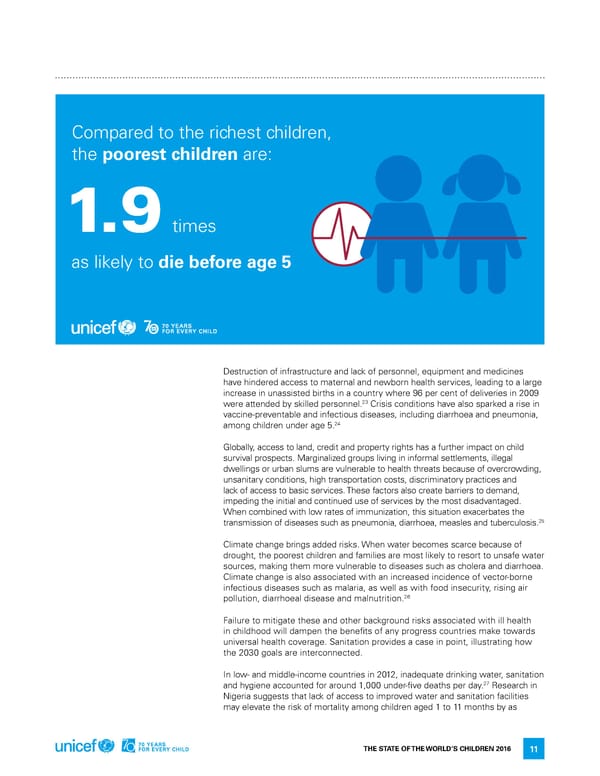
Compared to the richest children, the poorest children are: 1.9 times as likely to die before age 5 destruction of infrastructure and lack of personnel, equipment and medicines have hindered access to maternal and newborn health services, leading to a large increase in unassisted births in a country where 96 per cent of deliveries in 2009 23 were attended by skilled personnel. Crisis conditions have also sparked a rise in vaccine-preventable and infectious diseases, including diarrhoea and pneumonia, 24 among children under age 5. Globally, access to land, credit and property rights has a further impact on child survival prospects. Marginalized groups living in informal settlements, illegal dwellings or urban slums are vulnerable to health threats because of overcrowding, unsanitary conditions, high transportation costs, discriminatory practices and lack of access to basic services. These factors also create barriers to demand, impeding the initial and continued use of services by the most disadvantaged. When combined with low rates of immunization, this situation exacerbates the transmission of diseases such as pneumonia, diarrhoea, measles and tuberculosis.25 Climate change brings added risks. When water becomes scarce because of drought, the poorest children and families are most likely to resort to unsafe water sources, making them more vulnerable to diseases such as cholera and diarrhoea. Climate change is also associated with an increased incidence of vector-borne infectious diseases such as malaria, as well as with food insecurity, rising air pollution, diarrhoeal disease and malnutrition.26 failure to mitigate these and other background risks associated with ill health in childhood will dampen the benefits of any progress countries make towards universal health coverage. Sanitation provides a case in point, illustrating how the 2030 goals are interconnected. in low- and middle-income countries in 2012, inadequate drinking water, sanitation and hygiene accounted for around 1,000 under-five deaths per day.27 research in nigeria suggests that lack of access to improved water and sanitation facilities may elevate the risk of mortality among children aged 1 to 11 months by as The STaTe of The World’S Children 2016 11
Child Health: A fair start in life >> Prospects for child survival 28 much as 38 per cent. Use of unimproved sanitation facilities and, specifically, the prevalence of open defecation are also implicated in stunting because they expose children to health problems that can interfere with normal growth. While progress on sanitation has been slow in many countries, there are encouraging indications that more rapid progress is possible. in nepal, a Social Movement for Sanitation has mobilized local communities and civic authorities in some of the poorest 29 parts of the country, creating 27 open defecation-free districts. Such initiatives have the potential to generate large returns for child survival. one evaluation in Mali found a 57 per cent reduction in diarrhoea-related deaths of children under age 5, and a 13 per 30 cent reduction in child stunting, in open defecation-free communities. Prospects for child survival The 2030 goals have set a high bar for progress on maternal, newborn and child survival and health. among the targets for Goal 3 is the aim to reduce neonatal mortality to at least as low as 12 deaths per 1,000 live births and under-five mortality to at least as low as 25 deaths per 1,000 live births in every country. Universal health coverage, another 2030 target, is one of the conditions for reaching the above outcomes. These targets are achievable, but only if governments keep a relentless focus on the most disadvantaged children. The deepest and earliest cuts in child and maternal mortality must benefit those facing the highest risks. 31 Since 1990, the global under-five mortality rate has been cut by 53 per cent. TheSe TarGeTS are aChieVaBle, The global annual rate of reduction in under-five mortality from 2000 to 2015 BUT onlY if GoVernMenTS was more than double the rate achieved in the 1990s. Between 2000 and 2015, KeeP a relenTleSS foCUS on every region registered major progress in child survival. Sub-Saharan africa has increased the average annual rate of decline in under-five mortality from 1.6 per The MoST diSadVanTaGed 32 cent during the 1990s to 4.1 per cent since 2000. Children. Maternal mortality rates are also falling. Since 1990, the annual number of maternal deaths has decreased by 43 per cent. Between 2005 and 2015, the 33 global annual rate of reduction was more than twice the 1990–2000 rate. of the 75 countries accounting for more than 95 per cent of maternal, newborn and child 34 deaths, about three quarters made accelerated gains. Some of the world’s poorest countries have made extraordinary progress. While the world missed the MdG target of a two-thirds reduction in under-five mortality between 1990 and 2015, 24 low-income and lower-middle-income countries 35 achieved it. Some of these countries – such as ethiopia, liberia, Malawi, 36 Mozambique and niger – started out with very high mortality rates, in excess of 200 deaths per 1,000 live births. egypt and Yemen achieved respective declines of 72 per cent and 67 per cent in under-five mortality despite chronic conflict and 37 economic hardships. Meanwhile, China has experienced a rapid and considerable 38 decline in under-five mortality – 80 per cent since 1990. The diversity of national experiences demonstrates that dramatic reductions in child mortality are possible in countries whose social, political and economic contexts vary widely. The same is true for maternal health, given that a range of countries with different contexts and starting points achieved the MdG target of a 75 per cent reduction in maternal mortality. While child mortality generally declines as average income increases, many poorer countries are outpacing richer neighbours in reducing their under-five mortality rates (see Figure 1.1). Yet some countries in the fast lane for global economic growth The STaTe of The World’S Children 2016 12
– including india and nigeria – have been in the slower lane for child mortality reduction. The policy lesson: economic growth can help but does not guarantee improved child survival, and a country’s income need not hinder progress. Inequities in child survival disparities in maternal, newborn and child health in high-mortality countries represent a major barrier to sustained progress towards every child’s right to survive and thrive. on average, children born into the poorest 20 per cent of households are almost twice 39 as likely to die before age 5 as those born into the richest 20 per cent. Behind this global average is an array of diverse national patterns. for example, children born into the poorest 20 per cent are almost twice as likely to die during their first five years as those from the richest 20 per cent in Bangladesh and three times as likely in india, indonesia and the Philippines.40 Some countries have registered rapid progress since 2000 while also enhancing equity (see Figure 1.2, blue dots). other countries have achieved dramatic progress without improvements in equity (see Figure 1.2, yellow dots). in the latter countries, the survival gap between rich and poor children has slightly widened. These disparities have serious consequences. The combination of demography (poorer households having more children) and inequality in survival prospects (children in poor households facing higher mortality rates) means that the poorest children account for a greater share of child deaths than the wealthiest. FIGURE 1.1 Countries with limited economic growth can still reduce child mortality annual rate of reduction in under-five mortality, 2000–2015, and annual rate of change in GdP, 2000–2014, by country Annual reduction 10% rwanda in under-five mortality rate democratic republic of the Congo Bubble size indicates the 8% estimated number of under-five deaths in 2015 6% ethiopia 4% india 1,000,000 nigeria 2% 100,000 Pakistan 0 10,000 -2% 0 2% 4% 6% 8% 10% Annual rate of change in GDP Note: Countries selected had an under-five mortality rate above 40 deaths per 1,000 live births in 2015, 10,000 or more live births in 2015, and available GdP data, for 2000–2014 or most recent available year. each bubble represents a country. Source: World Bank, World development indicators (update of 22 december 2015), and United nations inter-agency Group for Child Mortality estimation, Levels & Trends in Child Mortality: Report 2015. The STaTe of The World’S Children 2016 13
Child Health: A fair start in life >> Inequities in child survival But it also means that equivalent percentage reductions in child mortality rates save more lives among the poor. an analysis of survey data covering 51 high-mortality countries found that reducing the neonatal mortality rate of the poorest 20 per cent to the rate of the richest 20 per cent would have averted 41 some 600,000 deaths in 2012. Under-five mortality should continue to decline for all children. But in order to reach the child survival targets, mortality rates for children from the poorest households will have to fall much more rapidly than the rates for those from the wealthiest households (see Figure 1.3). To make that happen, governments will have to address a range of critical factors affecting the poorest and most disadvantaged children. FIGURE 1.2 Progress in under-five mortality does not necessarily come with greater equity Change in ratio of under-five mortality rate by household wealth and change in overall under-five mortality rate Percentage change Countries with decreasing 80 Countries with increasing in ratio of under-five under-five mortality rate under-five mortality rate and mortality rate among and increasing inequity increasing inequity children in poorest IN 60 y versus richest UIT households q INE 40 y SINGALIT 20 T R o INCREAM y -80 -60 -40 -20 0 20 40 60 80 IN y ALIT UITT -20 q R o INEM -40 SING -60 DECREA Countries with decreasing Countries with increasing under-five mortality rate under-five mortality rate and and decreasing inequity -80 decreasing inequity DECREASING MoRTALITy INCREASING MoRTALITy Percentage change in under-five mortality Note: Using surveys conducted in the years 2005–2009 and 2010–2014 with respective midpoints of the reference years in 2000–2004 and 2005–2012. Source: UniCef analysis based on demographic and health Surveys (dhS), Multiple indicator Cluster Surveys (MiCS) and other nationally representative sources of data for 37 countries. The STaTe of The World’S Children 2016 14
FIGURE 1.3 The poor will need to make faster progress to reach the 2030 goal required annual rate of reduction in under-five mortality to achieve the SdG target by 2030, by poorest and richest wealth quintiles, 2015–2030 Sierra leone nigeria Guinea Cameroon Central african republic Burkina faso Mali niger Swaziland liberia equatorial Guinea Togo Burundi ethiopia Pakistan democratic republic of the Congo Mozambique Malawi Uganda Côte d’ivoire Guinea-Bissau Zimbabwe afghanistan Zambia Senegal rwanda Mauritania Gambia Benin Wealth quintiles haiti richest Yemen lesotho Poorest United republic of Tanzania Madagascar Congo Sudan india Ghana Kenya Timor-leste Gabon namibia Tajikistan Myanmar 0 1% 2% 3% 4% 5% 6% 7% 8% 9% 10% Required annual rate of reduction to reach an under-five mortality rate of 25 deaths per 1,000 live births by 2030 Note: Most recent available survey data in countries with an under-five mortality rate above 40 deaths per 1,000 live births in 2015 using United nations inter-agency Group for Child Mortality estimation (Un iGMe) 2015 estimates. Source: UniCef analysis based on dhS, MiCS and other nationally representative sources from the most recent survey conducted since 2006. The STaTe of The World’S Children 2016 15
Child Health: A fair start in life >> Inequities in child survival achieving substantial improvements in nutrition – a target within Goal 2 – will be key to boosting child survival rates. half of all deaths of children under age 5 are attributable to undernutrition, and large disparities exist in related indicators such as stunting. an analysis of 87 countries with recent available data shows that stunting rates among the poorest children are more than double those among the 42 richest. in West and Central africa, progress on stunting has been slow, with less than a 25 per cent reduction between 1990 and 2014. and in over one third of low-income countries with available trend data, the gap between the richest and poorest households in stunting reduction has been widening.43 household wealth is one determinant of a child’s chance to survive, but maternal education is also a strong predictor. across much of South asia and sub-Saharan africa, children with mothers who received no education are almost three times as likely to die before age 5 as children of mothers with secondary education.44 education enables women to delay and space births, secure access to maternal and child health care and seek treatment for children when they fall ill. if all mothers achieved secondary education, there would be 1.5 million fewer annual deaths of children under age 5 in sub-Saharan africa and 1.3 million fewer 45 in South asia. Child marriage and women’s reproductive health management also influence child mortality patterns. While child marriage rates are decreasing, each year about 46 15 million girls are married before the age of 18. These girls represent a highly vulnerable group: They are denied their childhood, face limited opportunities for education and often begin childbearing too early. Girls in the poorest 20 per cent of 47 the population, as well as those living in rural areas, face the greatest risks. in africa, the level of child marriage among the poorest has remained unchanged since 1990.48 A smiling boy with his mother, in Bangladesh. © UNICEF/UNI78184/Siddique The STaTe of The World’S Children 2016 16
Rita Iriati and Novia, her around the world, child brides are less likely than adult women to receive three-year-old daughter, near adequate medical care while pregnant. The lack of care, and the fact that girls are the entrance to their home not physically mature enough to give birth, put both mothers and their babies at in the village of Kemalang in risk. Complications during pregnancy and childbirth are the second leading cause Klaten District, Central Java 49 of death for girls between ages 15 and 19. and babies born to mothers under Province, Indonesia. age 20 are 1.5 times more likely to die during the first 28 days than babies born to 50 mothers in their twenties or thirties. © UNICEF/UN04255/Estey When a woman is denied opportunities to manage her reproductive health, Zara, a mother of two, she and her children suffer. Short birth spacing, for example, is a risk factor for attends her first-ever 51 preterm birth, and limited access to contraception is one barrier to safe spacing. antenatal consultation at Globally, an estimated 216 million married women need, but lack, access to an extended health centre 52 modern contraceptive methods. if women who want to avoid pregnancy had recently established by 53 access to these methods, unintended pregnancies would drop by 70 per cent. UNICEF and Save the reducing the number of unintended pregnancies, in turn, could avert 60 per cent Children, in NGuagam, Niger. 54 of maternal deaths and 57 per cent of under-five child deaths. © UNICEF/UN010548/Abdou The rural-urban divide also contributes to unequal chances in child survival. Children born in rural areas are 1.7 times more likely to die before age 5 than 55 children in urban areas. looking specifically at disparities linked to wealth and residence, a new comparison (see Figure 1.4) uses household survey data to chart child survival trajectories between 2015 and 2030 in a group of eight countries starting out from different positions. These projections illustrate the need for the fastest progress among the worst-off groups. reaching the most marginalized households is more than an ethical imperative; it is a precondition for ending the preventable deaths of newborns, children under age 5 and their mothers. The STaTe of The World’S Children 2016 17
Child Health: A fair start in life >> Inequities in child survival FIGURE 1.4 Progress must accelerate for the least advantaged children required reduction in under-five mortality rate (deaths per 1,000 live births) from 2015–2030 to achieve the SdG target, by subgroups in selected countries Population segment U5Mr = Under-five mortality rate (deaths per 1,000 live births) richest Urban rural Poorest Nigeria and Pakistan. in both NIGERIA PAKISTAN countries, the under-five mortality rate (U5Mr) in the wealthiest U5MR north-West U5MR islamabad Capital and the poorest households is South-West Territory (iCT) above the SdG target, and marked 100 100 Balochistan disparities persist between regions. in the north-West region of nigeria, 80 80 for example, U5Mr was double that of the South-West. and while 60 60 the richest 20 per cent will have to cut mortality by more than half 40 40 to achieve the target by 2030, the 25 25 poorest 20 per cent must achieve a 20 SdG target 20 SdG target reduction of three quarters. 0 0 2015 2020 2025 2030 2015 2020 2025 2030 Ethiopia and Mozambique. ETHIoPIA MoZAMBIqUE Both countries achieved MdG 4 (reducing U5Mr by two thirds U5MR addis ababa U5MR inhambane between 1990 and 2015). for Benishangul Zambezia ethiopia to achieve the SdG target 100 Gumuz 100 by 2030, U5Mr in addis ababa – the country’s best performer – 80 80 will have to fall by more than one third. The worst performing region, 60 60 Benishangul-Gumuz, will have to cut mortality by more than two 40 40 thirds from 2015 to 2030. 25 25 20 SdG target 20 SdG target 0 0 2015 2020 2025 2030 2015 2020 2025 2030 Note: required annual rate of reduction to achieve the SdG target of 25 deaths per 1,000 live births by 2030 calculated from reference year (mid-year of reference period of 10 years preceding the survey) of the under-five mortality rate in the survey data. Subgroups that have already achieved the target are kept constant. Selected subgroups are by best and worst performing region, richest and poorest wealth quintiles and urban and rural residence. Groups may overlap. Source: UniCef analysis based on dhS, MiCS and other nationally representative sources. The STaTe of The World’S Children 2016 18
Population segment U5Mr = Under-five mortality rate (deaths per 1,000 live births) richest Urban rural Poorest Indonesia and the Philippines. INDoNESIA PHILIPPINES in both countries, the wealthiest 20 per cent and the most U5MR riau U5MR Cagayan Valley advantaged regions have Papua autonomous region already met the 2030 target. in 80 80 in Muslim Mindanao the Philippines, while both the richest quintile and urban areas 60 60 have reached the 2030 target, the poorest 20 per cent and the autonomous region in Muslim 40 40 Mindanao will have to reduce mortality rates by about two fifths 20 25 20 to do so. SdG target SdG target 0 0 2015 2020 2025 2030 2015 2020 2025 2030 Bangladesh and Cambodia. BANGLADESH CAMBoDIA Cambodia is one of the world’s most striking post-2000 child U5MR Barisal U5MR Phnom Penh survival success stories: in 2015, Sylhet Mondol Kiri/ U5Mr was close to the SdG 60 60 rattanak Kiri target. however, two provinces inhabited mainly by ethnic minorities reported rates of 79 or 40 40 80 deaths per 1,000 live births. Compared to the level in Phnom Penh, children born in these two 25 provinces faced about 3.5 times 20 SdG target 20 the risk of dying before their fifth SdG target birthday. Bangladesh will have 0 to reduce disparities linked to 0 household wealth and high levels of 2015 2020 2025 2030 2015 2020 2025 2030 mortality in regions such as Sylhet in order to maintain progress. The STaTe of The World’S Children 2016 19
Child Health: A fair start in life >> Disparities in access and quality of care Disparities in access and quality of care Providing all women with antenatal care, skilled care at birth and essential newborn care can dramatically improve prospects for safe pregnancy and child survival. Unfortunately, these areas are marked by extreme disparity – not just in access to care but also in the quality of care. evidence shows that unequal access starts before birth and continues into the critical early years. disparities in utilization of antenatal care and skilled birth attendance mirror social disparities in child survival. Globally, women from the richest 20 per cent of households are still more than twice as likely as those from the poorest 20 per cent to have a skilled attendant at birth.56 and a modest increase in antenatal care coverage since 2000 has done little to narrow disparities in the antenatal period.57 rural-urban divides have also remained intact. in 2015, just over half of pregnant women benefited from the recommended minimum of four antenatal care visits; the vast majority of those who do not receive the minimum are poor and live in rural areas.58 at the regional level, glaring disparities in antenatal care and skilled birth attendance SUCh larGe and aVoidaBle exist in South asia and sub-Saharan africa. in both Bangladesh and Pakistan, women ineQUiTieS CoST Children'S from the richest households are respectively four and six times more likely to receive liVeS and CaUSe iMMenSe antenatal care (at least four visits) than those from the poorest. on the other hand, some of the largest gaps in skilled birth attendance are in eastern and Southern africa. SUfferinG. in eritrea, women from the richest households are 10 times more likely to benefit from 59 skilled birth attendance than those from the poorest households. Mothers and newborns in the poorest households are also less likely to receive a post-natal check-up. as a result, they are exposed to elevated risks associated with undetected hypothermia, infection and post-birth complications. Such large and avoidable inequities cost children’s lives and cause immense suffering. The lack of adequate health facilities in poor communities plays a role in these outcomes, and so do the social attitudes of some health providers. Women from socially excluded groups often experience hostile treatment or a lack of responsiveness from the health system and health providers. even when health facilities serving the poor are accessible and affordable, discriminatory practices can be an obstacle to equal treatment. in the case of pneumonia, early diagnosis and effective case management by trained health providers can save lives. Yet children from the poorest households who develop symptoms of pneumonia, and face the greatest risks, are the least likely to be taken to a health facility. Children from the wealthiest households are 1.5 times as 60 likely as those from the poorest to be taken to a health facility in Madagascar, and approximately four times as likely in ethiopia.61 Similar patterns apply to the treatment of diarrhoea, another major killer. Marginalized communities such as the roma population in Central and eastern europe, for example, face inequities in access to and utilization of health services at every turn. in both Serbia and Bosnia and herzegovina, one in five roma children are moderately or severely stunted. as of 2012, only 4 per cent of roma children 18 to 29 months old in Bosnia and herzegovina had all the recommended vaccinations, compared to 68 per cent of non-roma children.62 achieving equity is not only relevant in the poorest countries. in some rich countries, children from different backgrounds face starkly unequal prospects. The United States, The STaTe of The World’S Children 2016 20
for instance, has a higher reported infant mortality rate than most high-income countries in the oeCd. for babies born here, the odds of survival are closely linked to ethnicity: in 2013, infants born to african american parents were more than twice as 63 likely to die as those born to white americans. as in other countries, factors such as income, mother’s education and birthplace also continue to determine a child’s chances of surviving to age 5 in the United States. These disparities are reflected dramatically at the state level. The infant mortality rate of the state of Mississippi in 2013, for example, was double that 64 of the state of Massachusetts. Combining home visits by health workers with wider measures aimed at narrowing inequalities in education and income could play a vital role in addressing the situation. Low-cost interventions can make a difference The overwhelming majority of child deaths could be prevented through well known, low-cost and easily deliverable interventions. This is true for deaths that occur both in the neonatal period and after the first month. Quality care during pregnancy, labour and birth, and in the immediate post-natal period, not only prevents the onset of complications but expedites their early detection and prompt management. early post-natal care is particularly important in reducing mortality in the first few days day of life. The rising proportion of neonatal deaths points to the more difficult challenges ahead in sustaining and accelerating progress on child survival. The interventions needed to address the major causes of neonatal mortality are closely linked to those that protect maternal health (see Figure 1.5), so it is vitally important to increase coverage of interventions before, during and after pregnancy. research published in The Lancet estimates that 40 per cent of neonatal deaths 40 Per CenT of neonaTal could be averted with key interventions around the time of birth. These include deaThS CoUld Be aVerTed WiTh care by a skilled birth attendant, emergency obstetric care, immediate newborn KeY inTerVenTionS aroUnd The care (including breastfeeding support and clean birth practices, such as cord and thermal care) and newborn resuscitation. another 30 per cent could be saved TiMe of BirTh. through ‘kangaroo mother’ care with skin-to-skin contact starting from birth, prevention or management of neonatal sepsis, treatment of neonatal jaundice and 65 prevention of brain damage caused by birth-related oxygen deprivation. The benefits of breastfeeding are still under-recognized in many countries. Starting within the first hour of birth, longer-duration breastfeeding is associated with protection against childhood infections, increases in intelligence and reductions in the prevalence of overweight and diabetes. research found that if breastfeeding were scaled up to near universal levels, the lives of 823,000 children under age 5 would be saved annually in 75 low- and middle-income countries. for nursing 66 women, breastfeeding protects against breast cancer and improves birth spacing. Reaching the most vulnerable national leadership, backed by international cooperation, has played a critical role in driving global achievements in child survival over the past 15 years. economic growth, rising incomes and poverty reduction have certainly contributed, by both improving living standards and generating resources for investment in health. But in many The STaTe of The World’S Children 2016 21
Child Health: A fair start in life >> Reaching the most vulnerable low- and middle-income countries, much of the impetus for progress has come from strengthened health systems and community-based health interventions. Community health workers have expanded the reach of care, linking vulnerable people to high 67 impact, low-cost interventions for maternal, newborn and child health. one striking example comes from ethiopia. Between 2004 and 2010, the Government of ethiopia trained and deployed 38,000 health extension workers to local posts across the country, where they delivered basic antenatal and post-natal 68 care, reaching populations previously not covered by the health system. Similarly, health Surveillance assistants in Malawi have provided an essential link between the formal health system and the community, contributing to one of the world’s 69 most accelerated national declines in child mortality. FIGURE 1.5 Accelerated progress in neonatal mortality is key to meeting the SDG target required annual rate of reduction 2015–2030 versus the observed annual rate of reduction in neonatal mortality Annual rate of reduction 10 required from 2015 CK to reach a neonatal Pakistan -Tra mortality rate of off CK 8 -Tra 12 deaths per 1,000 live on births by 2030 (%) nigeria Neonatal deaths 6 india 1.000.000 100.000 10.000 4 democratic republic of the Congo 2 0 2 4 6 8 10 -2 observed annual rate of reduction in neonatal mortality during 2000–2015 (%) low-income countries lower-middle-income countries Upper-middle-income countries high-income countries Bubble size indicates estimated number of neonatal deaths in 2015 1,000,000 100,000 10,000 Note: Countries above the diagonal line need faster rates of reduction (i.e., accelerated progress) to achieve the target. Countries below the diagonal line will be able to achieve the target at their current rates of reduction. Those on the horizontal axis had already reached the target in 2015. Source: UniCef analysis based on Un iGMe, 2015. The STaTe of The World’S Children 2016 22
BOx 1.1 FEMALE vOLUNTEERS HELP HEALTH WORkERS REACH THE MARGINALIzED IN NEPAL Nepal, one of the world’s poorest countries, has with health workers, a model that has extended the reach registered one of the most rapid reductions in maternal of the health system into some of the country’s most mortality since 1990. This progress is the result of marginalized areas. sustained policy reform stretching over two decades, including a period marked by conflict. Health sector plans have aimed to build the professionalism of health staff, improve training and Health system development played a critical role in expand delivery of basic services across political cycles. Nepal’s success. Safe motherhood policies, introduced The current National Safe Motherhood and Newborn in the 1990s and strengthened since then, have greatly Health Long Term Plan (2010–2017) emphasizes the increased the number of community-level health development of obstetric care and referral systems. workers and skilled birth attendants. In addition, the Reframing maternal and child care as health rights or government made maternal health and family planning entitlements, meanwhile, has empowered women, who priorities within an expanding health budget, and health can now hold providers to greater account for delivering spending per capita doubled between 1995 and 2011. interventions related to safe motherhood, neonatal During roughly the same period, antenatal care coverage health, nutrition and reproductive health. increased five-fold. The number of births assisted by skilled attendants doubled between 2006 and 2011, Developments outside the health system have also to 36 per cent of the total. fostered equitable progress in Nepal. Behaviour change, access to reproductive health care and increased access Alongside the formal health system, Nepal developed a to education have contributed to a steep decline in fertility network of female community health volunteers. After rates. In addition, the proportion of the population living receiving 18 days of basic training and being provided in poverty has dropped sharply, from 68 per cent in the with medical equipment, the volunteers liaise closely mid-1990s to 25 per cent in 2011. Source: engel, Jakob, et al., 'nepal’s Story: Understanding improvements in maternal health', Case Study, overseas development institute, July 2013. around 70 per cent of the global decline in under-five deaths since 2000 can be traced to the prevention and treatment of infectious diseases. The annual number of under-five deaths from pneumonia, diarrhoea, malaria, sepsis, pertussis, tetanus, meningitis, measles and aidS declined from 5.4 million to 2.5 million 70 from 2000 to 2015. Malaria deaths among children under age 5 have fallen by 58 per cent globally since 2000,71 largely through the use of insecticide-treated mosquito nets and the antimalarial drug artemisinin. and vaccination programmes resulted in a 79 per cent drop in measles deaths between 2000 and 2014, 72 preventing the deaths of an estimated 17.1 million children. innovation is also accelerating progress for the hardest-to-reach children. in Malawi – where 130,000 children under 14 were living with hiV in 2014 – the government, together with partners, is testing the use of drones as a cost-effective way of reducing waiting times for hiV-testing of infants, for whom early diagnosis is critical to quality care. Currently, dried blood samples are transported by road from local health centres to the central laboratory for testing, taking an average of 16 days to reach the lab, and another eight weeks to deliver the results. Challenges such as the cost of fuel and poor state of roads result in delays, which present a significant problem for effective treatment. if successful, the innovation using drones could cut both 73 costs and the time families wait to receive results from months to weeks. The STaTe of The World’S Children 2016 23
Child Health: A fair start in life >> What if the gaps are not closed? What if the gaps are not closed? The pace of progress on child and maternal health and survival can increase or decrease as a result of policy choices made by governments and the international community in the coming years. however, if current trends continue, in 2030: • There will be 3.6 million deaths of children under age 5 in that year alone. a 74 total of 69 million such deaths will have occurred between 2016 and 2030, with sub-Saharan africa accounting for around half of these and South asia 75 for another third. • five countries will account for more than half of the global burden of under-five deaths: india (17 per cent), nigeria (15 per cent), Pakistan (8 per cent), the democratic republic of the Congo (7 per cent) and angola (5 per cent).76 • all but five of the 30 countries with the highest under-five mortality rates 77 will be in sub-Saharan africa. Some 620 million children will have been born in that region between 2016 and 203078 – about 30 per cent of the 79 world total. it is the only region expected to see growth in its under-five 80 population, which is likely to expand by over 40 million. nigeria alone will account for around 6 per cent of all births globally.81 • The global maternal mortality rate will be around 161 deaths per 100,000 live births – still five times the level for high-income countries in 1990.82 • Pneumonia will remain the second biggest killer of children under age 5, and preterm birth complications will remain the first.83 Based on current trends, then, prospects for universal achievement of the 2030 aChieVinG The SdG Child targets for neonatal and under-five survival are bleak. Unless the trends change, SUrViVal TarGeT WoUld dozens of countries will miss the mark by a wide margin (see Figures 1.5 and SaVe The liVeS of 38 Million 1.6). South asia will not achieve the neonatal target until 2049 and sub-Saharan africa will reach it after mid-century.84 The average annual rate of reduction in Children. neonatal mortality required for india to reach the target is almost double the current level. Compared to staying at the 2015 survival rate for children under age 5, achieving the SdG child survival target would save the lives of 38 million children worldwide in the next 15 years. if each country matched its top regional performer’s trend, an additional 7 million lives could be saved. if each country matched or fell below the current average rate of under-five mortality in 85 high-income countries, an additional 21 million lives could be saved. The latter scenario – again, compared to staying at the 2015 rate – would save 59 million children’s lives between now and 2030. in an analysis of 75 high-burden countries, only eight are expected to reach the SdG target. if each country scaled up intervention coverage as fast as the best performer in each area of intervention (e.g., skilled birth attendance, exclusive breastfeeding for the first six months, etc.), 33 countries could reach the target by 2030. The annual number of children dying before age 5 in those countries would drop by almost two thirds — from 5.5 million in 2015 to 2 million in 2030.86 The STaTe of The World’S Children 2016 24
These and other scenarios for 2030 point to the urgent need to scale up proven interventions. Closing the gap between the current trajectory and the rate of progress needed to achieve the 2030 child survival goal would save the lives of 13 million children under age 5, almost half of them newborn. around four in 87 every five lives saved would be in sub-Saharan africa. FIGURE 1.6 Many countries will miss the under-five mortality target, some by a wide margin Projected under-five mortality rate, at current trends, in countries that are expected to miss the SdG target by 2030 SdG target under-five mortality rate of 25 deaths or fewer per 1,000 live births by 2030 Excess mortality angola Somalia Chad Central african republic lesotho Benin nigeria Mauritania Sierra leone afghanistan democratic republic of the Congo Mali Côte d’ivoire Pakistan equatorial Guinea Comoros Guinea Cameroon Togo Guinea-Bissau Zimbabwe South Sudan Sudan haiti Burundi Burkina faso djibouti Acceleration needed Papua new Guinea to meet SDG target niger Gambia More than 5x lao People’s democratic republic 3–5x Ghana 2–3x Mozambique less than 2x 0 25 50 75 100 125 Deaths per 1,000 live births Note: The countries shown had 10,000 or more live births in 2015 and are expected to miss the SdG target by more than 10 deaths per 1,000 live births, if current trends continue. Source: UniCef analysis based on Un iGMe, 2015. The STaTe of The World’S Children 2016 25
Child Health: A fair start in life >> Equity objectives Equity objectives interim equity objectives – or ‘stepping stone’ targets – linked to achievement of the 2030 goals could play a valuable role in guiding policy on child and maternal well-being. national strategies aimed at halving disparities in child survival in five to seven years, for example, would help put the most vulnerable women and children at the centre of policy. The strategies could focus on inequities associated with household wealth, education levels, rural-urban divides and differences between regions or ethnic groups. Translating these interim targets into outcomes would require fundamental changes in how child and maternal health services are financed and delivered, and in policies aimed at lowering background risks. But interim equity objectives could act as a powerful catalyst towards meeting the 2030 commitments. The objectives would also provide a reference point for monitoring and reporting. in effect, they would serve as milestones on the road to 2030. This is a key link in the chain of accountability. objectives become meaningful only when they provide a benchmark, backed by data, against which performance can be measured. Currently, there are large gaps in both coverage and quality of the data available. Civil registration systems cover only a small fraction of global births, and coverage is mostly limited in countries with the highest child and maternal death rates. Coverage of deaths is even sparser.88 Globally, the births of nearly one in four children under age 5 have not been recorded.89 of the 74 countries reviewed by the Commission on information and accountability for Women’s and Children’s health, only two registered more 90 than half of all deaths. in low- and middle-income countries, up to 80 per cent of deaths occur outside of health facilities, and many are not 91 reported accurately. This means that critical information on the deaths of newborns, children and mothers is incomplete. Because of deficits in these areas, data on child and maternal deaths have to be extrapolated and interpolated through modelling. as child and maternal deaths decline and become more statistically rare, the importance of observational data increases – especially for the most marginalized and hard-to-reach populations. High return on health investments The investments needed to end preventable child and maternal deaths offer high returns. The scale of the returns reflects the hidden costs of health risks. Childhood illness not only claims lives and causes suffering, but also undermines the potential of children, their communities and countries. Malnutrition and childhood illness compromise cognitive development and reduce adult productivity. When health systems fail to prevent illness, society pays a price in the form of treatment costs and lost productivity. Conversely, improved maternal and child health and nutritional status can create a positive cycle, enabling children to realize their potential and helping their communities and countries to prosper. What would it cost to effectively end preventable deaths among children and mothers? detailed financial costings developed under the Global investment framework for Women’s and Children’s health provide valuable insights.92 The STaTe of The World’S Children 2016 26
Six core investment packages for 74 high-mortality countries would cost about US$30 billion in additional annual spending, an increase of 2 per cent above current levels. The spending packages would cover maternal and newborn health, child health, immunization, family planning, hiV/aidS and malaria, with nutrition as a cross- cutting theme. Between 2013 and 2035, this investment would avert an estimated 147 million child deaths, 32 million stillborn deaths and 5 million maternal deaths. in effect, such an approach would bring the level of essential maternal and child health coverage available to the poorest 20 per cent of the population in the 74 countries towards the coverage available to the richest 20 per cent. BOx 1.2 EvERY CHILD COUNTS: THE IMPORTANCE OF qUALITY DATA ON CHILD SURvIvAL Accurately counting births and deaths is the first step The situation is further complicated by large information towards making sure that every child’s rights are gaps on cause-specific mortality. For example, estimates recognized and respected. yet more than 100 developing of the global burden of acute lower respiratory infection countries lack the civil registration and vital statistics (ALRI) among young children have to rely on hospital- (CRVS) systems needed to generate accurate birth and based data, but those numbers underestimate influenza- death data. associated ALRI incidence in low-income communities because of poor families’ limited access to specialized Around the world, 230 million children currently under care. And the best global estimates for severe bacterial age 5 were not registered at birth. That figure includes infection among neonatal children range from 5.5 million 39 per cent of children in sub-Saharan Africa and to 8.3 million – a large margin reflecting uncertainties in 44 per cent of children in South Asia. In the absence of the underlying data. reliable data, estimates for child mortality in countries lacking CRVS systems are based on a sophisticated Despite considerable progress resulting from increased statistical model using survey responses, census surveys, there are still major gaps in data tracking the information and other sources. But no model can coverage of health interventions as well. Such data are compensate for high-quality input data based on birth central to accountability, providing information on reach and death registration. and disparities. While not every country has the capacity to report on all indicators, existing survey tools could be Household surveys provide valuable information modified to focus more sharply on quality of care. on differences in child mortality by socio-economic characteristics – including parental wealth, location, In the end, however, there is no substitute for CRVS education and others. But greater disaggregation of systems. The cost of achieving universal CRVS coverage data on various population groups is required to provide by 2024 has been put at US$3.8 billion for 73 countries a detailed picture of localities marked by high levels (excluding China and India). In the interim, expanding of childhood disadvantage. That means collecting, health system coverage and applying new information synthesizing and speeding up data reporting on these and communication technologies can generate critical social groups and localities. birth and death registration information, along with vital information on specific diseases. Source: World Bank/World health organization, Global Civil Registration and Vital Statistics: Scaling up investment Plan 2015–2024, World Bank, Washington, d.C., 28 May 2014, p. 2. United nations Children’s fund, Every Child’s Birth Right: Inequities and trends in birth registration, UniCef, new York, 2013. pp. 6, 36. nair, harish, et al., ‘Global burden of respiratory infections due to seasonal influenza in young children: a systematic review and meta-analysis’, The Lancet, vol. 378, no. 9807, 3 december 2011, p. 1925. Seale, anna, et al., ‘estimates of possible severe bacterial infection in neonates in sub-Saharan africa, South asia, and latin america for 2012: a systematic review and meta-analysis’, The Lancet, vol. 14, no. 8, pp. 731–741, august 2014. The STaTe of The World’S Children 2016 27
Child Health: A fair start in life >> Benefits of universal health coverage The projected social and economic returns on this investment – in terms of productivity, increased output and wider benefits associated with improved 93 health – are also impressive, totalling nine times the cost. other projected returns on investments in ending child and maternal mortality include: • at least a 10-fold return on health and nutrition spending through better 94 educational attainment, workforce participation and social contributions. • returns of US$16 for every US$1 invested in immunization. even with the introduction of new, more costly vaccines, immunization remains one of the 95 most cost-effective buys in health planning. 96 • returns of US$16 for every US$1 invested in nutrition interventions. Child undernutrition can cost between 1.9 per cent (egypt) and 16.5 (ethiopia) per 97 cent of a country’s GdP. Nang Doy and her • Savings totalling US$302 billion annually through protection, promotion and 98 four-month-old child, Thao support for breastfeeding. Nga, sit for growth monitoring vaccinations administered by The spending identified by the Global investment framework would address the the District Mother and Child problem of insufficiently resourced health systems that provide low coverage outreach team, in Lao People's of cost-effective interventions. More than US$10 billion of the additional annual Democratic Republic. cost would support enhanced delivery of reproductive, maternal, newborn and child health care – including provision of an additional 544,000 community health workers and 675,000 nurses, doctors and midwives.99 © UNICEF/UNI76591/Holmes The STaTe of The World’S Children 2016 28
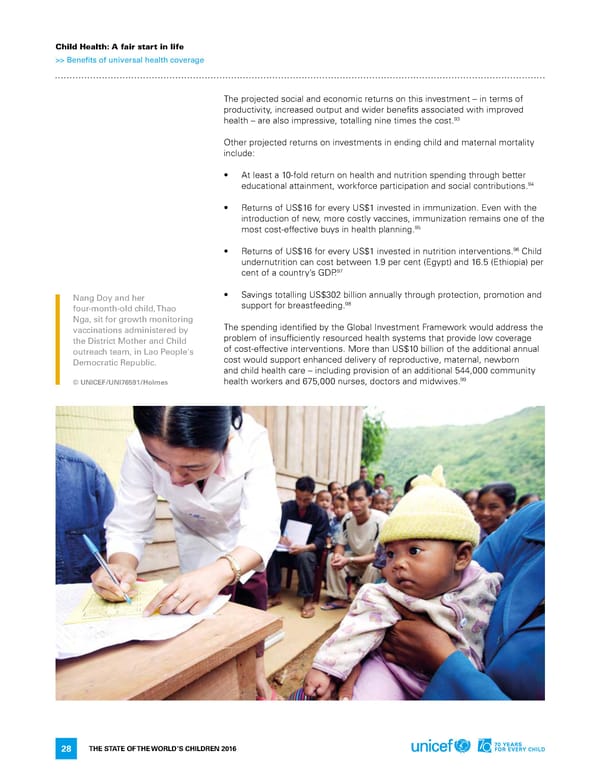
Benefits of universal health coverage Sustained progress will also require health systems that are equipped both to deliver quality care across a continuum of services and to reach all women and children, beginning with the most disadvantaged. The combination of high quality antenatal care, care during labour and around birth and the first week of life, and care for the small and sick newborn are essential to improve child and maternal health outcomes. effective antenatal care, for example, provides early identification of complications in pregnancy and offers women the micronutrient supplements they need for their own health and normal foetal development. educated and equipped health workers can deliver obstetric care and essential newborn care, in addition to promoting and supporting breastfeeding, identifying and treating infections, and providing potentially life-saving immunization. The association between antenatal care, skilled birth attendance and child survival is not automatic (see Figure 1.7), in part because the quality of care provided is highly variable within and among countries. nevertheless, expanded provision in both of the former has been central to progress in child survival. as the share of neonatal mortality rises as a proportion of total child deaths, the urgency of achieving universal coverage of quality antenatal care and skilled birth attendance increases. FIGURE 1.7 Antenatal care and skilled attendance at birth save newborn lives association between antenatal care (four or more visits), skilled attendance at birth and the neonatal mortality rate Neonatal 50 deaths per 1,000 live births 40 neonatal mortality rate target 30 by 2030 12 or fewer 20 neonatal deaths per 1,000 live 10 births 0 0 20% 40% 60% 80% 100% 0 20% 40% 60% 80% 100% Women attended 4+ times during last pregnancy Births attended by skilled personnel Neonatal mortality rate low ≤12 Medium (13–20) high ≥20 Source: for neonatal mortality rate, Un iGMe 2015 estimates. for antenatal care and skilled attendance at birth, UniCef global databases, 2015, based on MiCS, dhS and other national sources. The STaTe of The World’S Children 2016 29
Child Health: A fair start in life >> Benefits of universal health coverage FIGURE 1.8 In 63 countries, equity in intervention coverage could reduce under-five mortality rates by almost 30 per cent impact on the under-five mortality rate of increasing national coverage to the level of the top wealth quintile Under-five mortality rate 140 No change with scaled-up interventions (deaths per 1,000 live births) 120 20% reduction 100 40% 80 reduction 60 40 20 0 0 25 40 60 80 100 120 140 Baseline in under-five mortality rate (deaths per 1,000 live births) Note: health services in the scaled-up model included interventions such as skilled birth attendance, vitamin a supplementation and vaccinations. The 63 countries represent 88 per cent of global under-five deaths. The liST analyses were carried out by adrienne Clermont, Yvonne Tam and neff Walker at the institute for international Programs, Johns hopkins Bloomberg School of Public health. Source: lives Saved Tool (liST) analysis by Johns hopkins University, 2015. Strategies to deliver universal, quality health care by 2030 have to embrace two closely-related goals: expanding coverage while narrowing equity gaps. here again, coverage rates for the poorest 20 per cent of the population must increase much faster than rates for the wealthiest 20 per cent in order to reach universal coverage. in 63 high-mortality countries, scaling up national coverage of health interventions to the level of the wealthiest 20 per cent could prevent one in four under-five deaths and decrease average under-five mortality rates in countries by almost 30 per cent (see Figure 1.8). another strategy – set out by the World health organization (Who) and UniCef in the integrated Global action Plan for Pneumonia and diarrhoea – identifies the measures needed to eliminate avoidable deaths from pneumonia and diarrhoea by 2025. Simply scaling up existing interventions would cut deaths by two thirds 100 at a cost of US$6.7 billion under the plan. in child nutrition, a study of 34 high-burden countries, where 90 per cent of the world’s children who suffer stunting live, identified 10 proven interventions with the potential to avert 900,000 under-five deaths. They range from treatment of acute malnutrition to complementary feeding, breastfeeding, and vitamin a and The STaTe of The World’S Children 2016 30
zinc supplementation. The additional annual cost of scaling up present nutrition coverage to meet 90 per cent of the need in the 34 countries would be about US$9.6 billion, according to the study.101 as compelling as such estimates are, they sometimes divert attention from the critical importance of strengthening health systems’ capacity to deliver services. Properly trained and motivated health workers are the lifeblood of efficient, equitable and resilient health systems. The interventions needed to diagnose, prevent and treat the causes of child and maternal deaths are not stand-alone technologies. They have to be delivered by skilled community-level health workers, midwives, nurses and doctors. Chronic shortages of health workers represent major obstacles to accelerated progress. in many countries, health workers are concentrated in urban areas or facilities serving more advantaged populations. They may be reluctant to work in remote areas because of low remuneration, lack of continuing educational opportunities, difficult working conditions, shortages of supplies and equipment, or a lack of social services for their own families. Who has estimated that a minimum of 23 health workers for every 10,000 people is required in countries seeking relatively high levels of health system 102 coverage for the basic needs of their populations. Countries falling below this A health worker administers a dose of oral polio vaccine to a child at the entrance to his home in Baghdad's Sadr City, Iraq. © UNICEF/UNI199369/khuzaie The STaTe of The World’S Children 2016 31
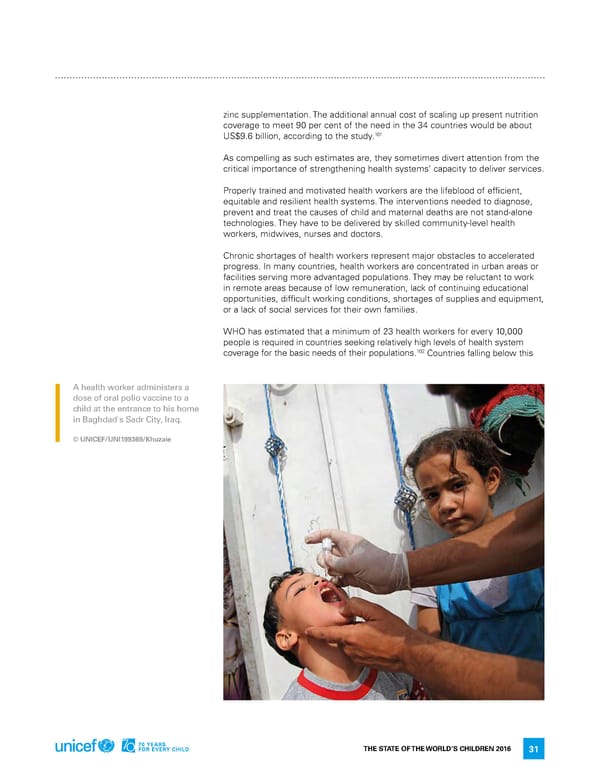
Child Health: A fair start in life >> Benefits of universal health coverage FIGURE 1.9 Many countries do not have enough health providers number of physicians, nurses and midwives per 10,000 population and Who minimum threshold Who minimum threshold = 23 doctors, nurses and midwives per 10,000 population Solomon islands nigeria Myanmar Zimbabwe Pakistan lao People’s democratic republic Kenya Ghana Gambia Cambodia Zambia Yemen Benin Mauritania afghanistan rwanda Guinea-Bissau Papua new Guinea Burkina faso Côte d’ivoire Bangladesh Mali Senegal United republic of Tanzania Mozambique Malawi Togo Central african republic liberia ethiopia Sierra leone niger 0 5 10 15 20 25 Number of physicians, nurses and midwives Source: World health organization, Global health Workforce Statistics, 2014. The STaTe of The World’S Children 2016 32
threshold struggle to provide skilled care at birth, as well as emergency and specialized services for newborn and young children. Most countries in sub-Saharan africa and many high-mortality countries in South asia fall well below the threshold (see Figure 1.9). By 2035, the world will need an additional 12.9 million health workers. already today, sub-Saharan africa has a health worker deficit of 1.8 million, and unless there is concerted action, that figure will rise to 4.3 million over the next 20 years 103 as population rises. The additional cost of providing sub-Saharan africa with just another 1 million community health workers would be US$3.1 billion per year, according to an estimate by the earth institute at Columbia University. The return on that investment, in addition to the lives saved and suffering reduced, would be an estimated US$19.4 billion per year from enhanced productivity.104 The ebola crisis in West africa graphically illustrated the fragility of under- resourced and under-staffed health systems. on the eve of the outbreak, Sierra leone and liberia had fewer than three health workers for every 10,000 people.105 106 liberia had approximately 50 doctors for a country of 4.3 million. deaths among health workers during the crisis depleted the affected countries’ already limited number of skilled providers. one of the lessons from the ebola crisis is that strong health systems are needed not only to contain epidemics and deliver vital interventions, but to help countries and communities become more resilient. for its part, indonesia has an overall health worker-to-population ratio close to Who’s recommended level, but health workers are unequally distributed throughout the country. facilities serving the poor often lack basic amenities and trained staff. Thus, approximately half the women in Maluku and Papua provinces deliver their babies without skilled attendance – more than double the level in Sumatera – and urban women are more than three times more likely than their rural counterparts to have skilled attendance at birth.107 Countries with some of the world’s lowest health worker-to-population ratios also face equity issues. in liberia, the ratio of skilled birth attendants to population in the best-covered county is over three times higher than in the 108 county with the least coverage. An attendant wipes the face of a preterm baby in the Special Care Newborn Unit at Tangail Medical College Hospital, Bangladesh. © UNICEF/UNI195711/Mawa The STaTe of The World’S Children 2016 33
Child Health: A fair start in life >> Adequate and equitable financing Adequate and equitable financing By one estimate from 2012, financing a health system equipped to provide a minimal level of essential services on a universal basis would cost about US$86 per capita annually. This is more than double the average level of health system 109 spending in low-income countries. even when services are available, formal and informal charges for maternal and child health care create affordability barriers for the poor. like other obstacles – including distance, time and costs associated with using services, poor awareness, quality concerns, and social and cultural impediments – these charges reduce demand for vital services, often with fatal consequences in the case of maternal, newborn and child health. They deplete assets and trap poor households in cycles of ill health and poverty. When public health spending does not cover the costs of provision, inadequate service coverage and imposition of user fees invariably hit the poorest households hardest. according to the World health report of 2010, Health Systems Financing: The path to universal coverage, each year, about 150 million people suffer financial catastrophe while 100 million are forced into poverty as a result of health-related expenses.110 The risk of impoverishment rises sharply once out-of-pocket payments 111 exceed 15 to 20 per cent of health expenses. increased public spending on health is a feature of many of the countries with the best performance in child survival. While there are no hard-and-fast rules, evidence suggests that governments should aim at allocating around 5 per cent of GdP for health spending.112 Yet many countries with high mortality rates in South asia spend less than 3 per cent of GdP on health, and in many cases, that spending is skewed towards services that do not reach the poor.113 even with concerted efforts to allocate funding towards health, many of the world’s poorest countries would fall short of the US$86 per capita spending target. one exercise estimated a financing gap of about US$74 billion under a A health worker marks a boy’s finger to indicate that he has been vaccinated during a measles immunization campaign, at a health outreach post in Lishiko Village, Lusaka, Zambia. © UNICEF/UNI91597/Nesbitt The STaTe of The World’S Children 2016 34
scenario in which all low-income countries meet more stringent standards for revenue allocation and health sector financing. While only indicative in nature, this estimate provides a valuable ballpark figure for the additional international public financing that would be needed to bring the 2030 child and maternal 114 health targets within reach. Targeted schemes to finance services for the poor, exempt them from user fees and provide them with insurance have a mixed record of success. experience shows that targeted financing often has a negligible impact on service utilization. financing the entry of poor households into existing national health insurance programmes, which pool risk across populations, has 115 produced more positive results. Brazil’s family health Programme, for example, expanded coverage from 10.6 million to 100 million people between 1998 and 2010, with an initial focus on disadvantaged areas. The programme provides access to health care – free at 116 the point of use – to more than 90 per cent of the country’s municipalities. Thailand’s Universal Coverage Scheme (UCS) enhanced equity by bringing a large uninsured population under the umbrella of a national programme, greatly reducing ’catastrophic‘ health payments among the poor and improving BOx 1.3 BANGLADESH SHOWS THE CHALLENGE OF SUSTAINED PROGRESS IN CHILD SURvIvAL In recent years, Bangladesh has made solid progress behind the rest of the country. And fewer than one third in reducing mortality rates among children under age of women received the recommended minimum of four 5. Part of its success can be traced to the expansion antenatal care visits in 2014. of community-level health interventions. Accelerated progress will depend on expanded and more equitable on a more positive note, Bangladesh has been making provision of antenatal care and skilled birth attendance. progress towards equity in terms of deliveries that take place in health facilities. In 2004, the ratio of poorest-to- Starting from a low base, the country has already richest women delivering in a health facility was 1 to 12. achieved a rapid expansion of coverage in both areas. By 2014, the ratio had improved to one to four. The proportion of babies delivered in health facilities increased from 8 per cent to 37 per cent between 2000 Recognizing that sustained improvements in maternal and 2014. Antenatal coverage by skilled providers also and child health will require a greater reduction in rose, from 33 per cent to 64 per cent. disparities between different social and economic groups, the government has introduced a range of equity targets Nevertheless, large disparities remain. The wealth gap for key interventions. The targets form the basis for in access to skilled antenatal care has declined only monitoring coverage in low-income communities, urban marginally. Coverage is 36 per cent for the poorest slum areas, poor-performing districts and areas with women and 90 per cent for the wealthiest. The ratio ethnic minorities, such as the Chittagong Hill Tracts in of poor-to-rich women benefitting from skilled birth south-eastern Bangladesh. Taken together, they represent attendance in 2014 was about one to four, with two of a potential pathway to equity for the country’s most the country’s divisions – Sylhet and Barisal – lagging far disadvantaged mothers and children. Source: national institute of Population research and Training (niPorT), Mitra and associates, and iCf international, Bangladesh demographic and health Survey 2014: Key indicators, dhaka, Bangladesh, and rockville, Maryland, USa, 2015. The STaTe of The World’S Children 2016 35
Child Health: A fair start in life >> Adequate and equitable financing BOx 1.4 HEALTH EqUITY FUNDS PROvIDE FREE HEALTH CARE TO THE POOR Cambodia has witnessed extraordinary advances in child care by providing cash incentives for staff and facilities to survival and other health indicators. Between 2000 and serve patients. 2015, under-five mortality fell from 108 to 29 deaths per 1,000 live births, one of the most rapid rates of decline In essence, HEFs are a purchasing mechanism that provides in the world. The same period saw a dramatic increase free health care to the poor. As of 2013, they covered more in utilization of child and maternal health facilities. Social than 2.5 million people in 51 of Cambodia’s 81 districts, insurance provided through the country’s Health Equity supporting more than a million health centre consultations. Funds (HEFs) has played an important role in this success. Studies show that where HEFs operate they are a HEFs are multi-stakeholder initiatives in which non- significant force for inclusion, improving access for the governmental organizations reimburse public health poor and reducing out-of-pocket payments. However, there facilities for treating poor patients, using a combination are limits to what has been achieved. An estimated 40 to of government and donor financing. The mechanism has 50 per cent of the poor do not use HEFs, perhaps as a result largely eliminated the practice of charging under-the- of distance or the quality of care, and those just above the counter fees. It has also contributed to improving quality of poverty line are excluded. Source: Kelsall, Tim, and Seiha heng, ‘The Political economy of inclusive healthcare in Cambodia’, eSid Working Paper no. 43, 16 december 2014. BOx 1.5 ELIMINATING MALNUTRITION CAN HELP BREAk THE CYCLE OF UNEqUAL OPPORTUNITY In 2014, 159 million children under age 5 were stunted. scientists to eliminate all forms of malnutrition through Another 41 million children under age 5 were overweight nationally-driven processes. SUN countries are working – and their number is rising. Stunting and other forms to increase access to affordable and nutritious food, as of undernutrition reflect societal inequities; stunting can well as demand for it. serve as a marker for poverty. As of March 2016, 56 countries had joined SUN, including In Africa and Asia, 11 per cent of GNP is lost due to poor the Democratic Republic of the Congo, Ethiopia, Haiti, nutrition. Eliminating malnutrition in young children has Kyrgyzstan, Peru and Sri Lanka. This means that SUN has several benefits. It could improve school attainment by at the potential to reach 82.8 million children. least one year, reduce poverty, empower women and, in turn, break the intergenerational cycle of poverty. In Peru, the national programme Incluir para Crecer (Inclusion for Growth) focuses on children and Everyone has a right to food and good nutrition. Realizing pregnant women in the poorest areas with the aim that right is critical to fulfilling children’s rights, including of reducing social inequities and poverty in order to the right to good health that is a prerequisite to expanded reduce malnutrition and promote growth. Since 2006, opportunities in life. stunting has fallen by half – from about 30 per cent in 2004–2006 to 15 per cent in 2014. Stunting prevalence That is the principle behind the Scaling Up Nutrition among children from the poorest households declined (SUN) movement, which brings together governments, from 54 per cent to 34 per cent over the same time civil society, the United Nations, donors, businesses and period. Source: United nations Children’s fund, Improving Child Nutrition: The achievable imperative for global progress, UniCef, new York, 2013, and UniCef global nutrition database, 2016. The STaTe of The World’S Children 2016 36
117 access to essential health services. Within a year of its launch, UCS covered 75 per cent of the Thai population, including 18 million previously uninsured people.118 in rwanda, the national health insurance programme, Mutuelle de Santé, covers about 90 per cent of the population and provides free coverage for the very poor. out-of-pocket spending fell from 28 per cent to 12 per cent of total 119 health expenditures in the programme’s first decade. and Cambodia’s health equity funds have played a critical role in strengthening both the reach and the equity of the health system in that country (see Box 1.4). Power in partnerships Many of the interventions needed for more children to enjoy good health are well known. The challenge is to implement them at scale so that there are enough community health workers, nurses and doctors to link the most disadvantaged people to high-quality services. failure to mobilize the necessary resources will act as a brake on progress in child survival and health. The challenge is great, but concrete and practical strategies such as the every newborn action plan offer a road map for equitable policy and financing. Movements such as every Woman every Child and a Promise renewed (aPr) provide a platform for action, bringing together governments, the private sector, international agencies and campaigners. The aPr movement was launched in June 2012, when the Governments of ethiopia, india and the United States, in collaboration with UniCef, convened the Child Survival Call to action in Washington, d.C. answering the call, 178 governments – as well as hundreds of civil society, private sector and faith-based organizations – signed a pledge under the aPr banner vowing to do everything possible to stop women and children from dying of causes that are easily preventable. Since then, more than 30 countries have deepened their commitments by launching sharpened national strategies for maternal, newborn and child survival based on aPr’s core principles: building political commitment, strengthening accountability and mobilizing societies and communities. Current multilateral partnerships also provide a strong foundation for broadening and deepening cooperation to support national strategies on child and maternal health. one example comes from the GaVi alliance. in collaboration with global companies involved in pharmaceutical development and supply-chain management, and represented in the international federation of Pharmaceutical Wholesalers, the alliance has developed a three-year partnership to immunize hard-to-reach children in 73 countries. Pharmaceutical companies themselves have an important role in developing affordable products to prevent and treat 120 killer diseases, including rotavirus, pneumonia and sepsis. effective implementation of the strategies outlined in this chapter will require stepped-up coordination and more robust leadership, both nationally and globally. national strategies to achieve universal health coverage and equitable, quality care for children and their mothers should set clear priorities, specifically, to reach the most disadvantaged groups with life-saving interventions. These strategies will have to include providing trained staff with incentives to work in hard-to-reach areas. The STaTe of The World’S Children 2016 37
PERSPECTIVE: a fair chance for girls – end child marriage By angélique Kidjo, award-winning artist and UniCef Goodwill ambassador Child marriage exemplifies how the world’s poorest act like children, but instead were forced to be grown- girls bear the heaviest burden of disadvantage, ups. i noticed they carried a sense of shame, a sharp especially those living in marginalized communities awareness that they were different from the rest of us. in rural areas of sub-Saharan africa and South asia, where the practice is most common. While there has been progress in reducing child marriage, it is uneven. Girls from the poorest Girls who are married have their childhoods stolen households – and those living in rural areas – face from them. i’ve seen this, and how it hurts them. twice the risk of being married before turning 18 as girls from the richest households or those living in When i was growing up in Cotonou, Benin, several of urban areas. my girlfriends from primary school were married at a very young age. Some i never even saw again – their With no progress, almost 950 million women will have married lives took them far away. others i met up been married as children by 2030, up from more than with later on, but they weren’t the same. Their joy and 700 million today. and by 2050, almost half of the enthusiasm were gone. They were no longer free to world’s child brides will be african. The STaTe of The World’S Children 2016 38
a fair chance for girls – end child marriage The costs are too high – for the girls whose rights are incentives and supporting families, and strengthening violated when they are married, and for the societies and enforcing laws and policies that set the minimum that need those girls to grow up into productive, age of marriage at 18 for both girls and boys. empowered adults. education is a critical part of the solution. Girls who Married girls are among the world’s most vulnerable have little or no education are up to six times more people. When their education is cut short, girls lose likely to be married as children than girls who have the chance to gain the skills and knowledge to secure secondary schooling. When a girl is in school, those a good job and provide for themselves and their around her are more likely to see her as a child, rather families. They are socially isolated. as i observed than as a woman ready to be a wife and mother. and among my former schoolmates who were forced to the experience of going to school is empowering for get married, the consciousness of their isolation is in girls, enabling them to develop skills and knowledge, itself painful. and to forge social networks that equip them to communicate and stand up for their interests. Subordinate to their husbands and families, married educated girls are better able to contribute to their girls are more vulnerable to domestic violence, and countries’ growth and development, and also to the not in a position to make decisions about safe sex prosperity and well-being of their future families. and family planning – which puts them at high risk of sexually transmitted infections, including hiV, and of fifteen million girls are married as children every year, pregnancy and childbearing before their bodies are and the sheer numbers underline the importance fully mature. already risky pregnancies become even of investing in solutions that can have an impact at riskier, as married girls are less likely to get adequate scale, to speed up progress in ending the practice. medical care. during delivery, mothers who are still focused investments to reach and empower poor and children are at higher risk of potentially disabling marginalized girls through health, education, social complications, like obstetric fistula, and both they and protection and other systems can create alternative their babies are more likely to die. pathways for girls and their families. By robbing girls of their potential, child marriage no less critical is the slow, patient work of changing robs families, communities and nations of the social norms. These kinds of long-lasting, fundamental contributions these girls might have made as changes come from within communities, and they women. Child marriage hampers countries’ efforts depend on engaging both mothers and fathers in to improve the health of mothers and children, fight finding solutions that make a difference in their malnutrition and keep children in school. When girls daughters’ lives. are married as children, they cannot help but pass on poverty, low education and poor health – into which When child marriage is a thing of the past, we will they themselves have been trapped – to the next have put an end to an inequity that takes away girls’ generation. fundamental rights and steals their childhoods. More girls and women will be able to make the most of their Child marriage may seem like an intractable problem. lives and give their best to their families, communities it happens because societies often place a lesser and societies – which will go a long way towards value on girls – so they don’t get the same chances as breaking intergenerational cycles of poverty and their brothers – and because poverty and other forms strengthening communities and nations. ending child of disadvantage, like low levels of education, further marriage unlocks possibilities that can transform life constrain their opportunities, making marriage seem for girls and yield benefits for us all. like the best option to secure a girl’s future. But there are proven strategies that can change girls’ lives, preserve their childhoods and empower them to make better futures for themselves and their societies. Florence, 14, at the Hope Secondary School, in These involve increasing girls’ access to education, Kinshasa, the Democratic Republic of the Congo. empowering girls with knowledge and skills, educating parents and communities, increasing economic © UNICEF/UNI199292/Dubourthoumieu The STaTe of The World’S Children 2016 39
EDUCATION: LEvELLING THE PLAYING FIELD The STaTe of The World’S Children 2016 40
ChaPTer 2 Education: levelling the playing field quality education has the power to end intergenerational cycles of inequity, improving the lives of children and the societies in which they live. Education can provide children with the knowledge and skills they need to succeed in life. It is associated with increased incomes, reduced poverty and improved health. But for education to play this role, it must begin with early childhood development and continue with quality learning opportunities that provide all children, especially the most disadvantaged, with a fair chance to thrive. Jhuma Akhter, 14, does her in rich and poor countries around the globe, education has long served as homework under the glow a great leveller of opportunity because it helps people realize their potential of a lamp post outside her and contribute to their communities and the world. Good education increases home in Khulna, Bangladesh. knowledge, sparks innovation, builds skills that drive growth and prosperity, and fosters inclusive societies. for generations, quality and equitable education has © UNICEF/UN016303/Gilbertson provided children with a pathway out of deprivation. What has been true for the vII Photo prospects of individual children has also held true for the future of nations. and yet, millions of children around the world are still denied their right to education because of factors they do not control – factors such as poverty, gender, ethnicity, disability or geographical location. armed conflict, natural disasters and the impacts of climate change also deprive children of the chance to go to school and learn. in addition, when public resources are not allocated on the basis of evidence pointing to the greatest need, education systems can entrench inequities rather than dismantle them. This chapter will make the case that two challenges – lack of access to education and deficits in learning outcomes – must be overcome for education to fulfil its role as an agent of equity. To overcome these challenges, countries will be best served if they offer comprehensive early childhood care and learning opportunities, and if they focus on making the fastest progress for the children left furthest behind. This approach has the potential to narrow the gaps in educational outcomes between the richest and poorest children by 2030. The STaTe of The World’S Children 2016 41
Education: Levelling the playing field >> Access to education – from the start Access to education – from the start The Convention on the rights of the Child recognizes that every child has the right to go to school and learn. That right begins in early childhood, which is one reason why the Sustainable development Goals (SdGs) call on governments to “ensure that all girls and boys have access to quality early childhood development, care and pre-primary education.” for education to fulfil its role as a catalyst for equity, it must begin with early childhood interventions that help mitigate the disadvantages faced by children born into poor and non-literate environments. investment in quality early childhood care and education produces a double benefit: it is both fair and efficient. one key to success is the provision of comprehensive interventions that cross development sectors to include nutrition, health, and water, sanitation and hygiene practices. This kind of holistic approach also takes child protection into account and focuses on the quality of care provided to infants and young children. There are indications that a holistic approach can provide success. Comprehensive interventions that combine nutrition, protection and stimulation have been shown to produce marked gains in young children’s cognitive 121 development. improved nutrition and preparedness for learning translate into improved education outcomes – which, in turn, improve children’s health and can raise their earning levels as adults. a long-term study in Jamaica found a 42 per cent increase in average adult earnings associated with early childhood 122 stimulation. research in the United States puts the returns on early childhood 123 investments at 7 to 10 per cent a year. 38% of children leave primary school without learning how to read, write and do simple arithmetic The STaTe of The World’S Children 2016 42
Lunchtime at Kotingli Basic efforts to protect and expand the right to education – starting from early childhood School, Northern Region, – have been under way for decades. in many cases, they have led to great Ghana. success. But school enrolment figures indicate that the pace of progress is in jeopardy. Since 2011, the global number of children who do not attend school has © UNICEF/UN04349/Logan 124 increased. in most countries, less than half of children attend early childhood education 125 programmes. about 124 million children and adolescents are denied opportunities to enter and complete school – including around 59 million children of primary school age (see Figure 2.1) and 65 million young adolescents of lower secondary school age, according to figures from 2013.126 More than half of the 127 primary-school-aged children who are not in school live in sub-Saharan africa. in addition, gender gaps in enrolment continue to be a problem. School enrolment trends do not bode well for achieving SdG 4, which, in addition to an emphasis on early childhood development, calls for primary and secondary education for all children in the next 15 years. indeed, if current trends persist, by 2030: 128 • There could be over 60 million primary-school-aged children still out of school. • low-income countries will have primary and lower secondary completion rates of about 76 per cent and 50 per cent, respectively.129 • lower-middle-income countries will have completion rates of nearly 92 per cent for primary education and more than 80 per cent for lower secondary education (see Figure 2.2).130 also based on current trends, low-income countries in 2030 will not be on track to achieve universal primary and lower secondary school completion until around the turn of the next century.131 The STaTe of The World’S Children 2016 43
Education: Levelling the playing field >> Access to education – from the start Charting a path towards universal access to primary and secondary schooling, along with effective learning for all, begins with identifying the children left behind. Those excluded from learning opportunities often face multiple kinds of disadvantage. Poor girls living in rural areas usually have the least access 132 to education. Children also face disadvantages and lack of services due to discrimination based on ethnic origin or disability. Some out-of-school children never enter a classroom. Many children – especially those from the poorest households – arrive on the first day unprepared to succeed 133 in school. as they progress through the education system, some drop out well before completing primary school. for many others, the transition from primary into lower secondary education, or from lower to upper secondary school, remains an insurmountable hurdle (see Figure 2.3). FIGURE 2.1 More than half of the 59 million out-of-school children live in sub-Saharan Africa number and percentage of primary-school-aged children out of school for UniCef regions for 2000 and 2013 out-of- 50% 43% school (22 million) rate 39% (43 million) 40% 2000 34% (19 million) 30% 20% (33 million) 15% 18% (99 million) 26% (8 million) 20% (18 million) 2013 2000 21% (33 million) 16% 7% 10% (12 million) 6% 5% (2 million) (3 million) (11 million) 10% 2013 (5 million) 6% 5% 6% 9% (59 million) (10 million) (1 million) (4 million) 4% (7 million) 0% West eastern and South Middle east Cee/CiS latin america east asia Sub-Saharan World and Central Southern asia and north and the and the africa africa africa africa Caribbean Pacific Bubble size indicates number of out-of school children 2000 2013 10 million 5 million 1 million Source: UniCef analysis based on data from the UneSCo institute for Statistics global database, 2015. The STaTe of The World’S Children 2016 44
FIGURE 2.2 If current trends persist, the world is off-track to reach primary and secondary education for all by 2030 Projected completion rates by country income group and level, 2010–2100 2.2a 100% 2.2b 100% Primary Lower completion 80% secondary 80% rate completion rate 60% 60% 40% 40% 20% 20% 0 0 2010 2030 2100 2010 2030 2100 all countries Upper-middle-income countries lower-middle-income countries low-income countries Note: Projections are based on current trends. Source: United nations educational, Cultural and Scientific organization, EFA Global Monitoring Report, ‘how long will it take to achieve universal primary and secondary education?’, Technical background note for the framework for action on the post-2015 education agenda, UneSCo, Paris, May 2015. FIGURE 2.3 Many girls and boys drop out as they transition through education levels Gross enrolment ratio (Ger) in pre-primary, primary and secondary education in five UniCef regions and sub-Saharan africa, 2013 120% 100% 80% 60% 40% 20% 0 Sub-Saharan South asia Middle east latin america and east asia Cee/CiS africa and north africa the Caribbean and the Pacific Pre-primary, boys Primary, boys lower secondary, boys Upper secondary, boys Pre-primary, girls Primary, girls lower secondary, girls Upper secondary, girls Source: UneSCo institute for Statistics global database, 2015. The STaTe of The World’S Children 2016 45
Education: Levelling the playing field >> Equity and learning outcomes There are multiple reasons for disadvantage in education. in China, for example, migration from rural districts to urban centres affects whether children have 134 access to education entitlements. if they are living in cities but remain registered in rural areas, their entitlements may be severely limited. Poverty is also an important part of the equation. The impact of poverty on education begins early, because the poorest children in any country are the least likely to attend early childhood education programmes.135 and the disadvantages continue. in sub-Saharan africa, nearly 60 per cent of 20- to 24-year-olds from the poorest fifth of the population have been through fewer than four years of schooling. By contrast, only 15 per cent in the richest quintile have been in school 136 for less than four years. in egypt and the United republic of Tanzania, being born poor nearly doubles the risk of missing out on basic education relative to the 137 national average. for poor women in both countries, the risk is even higher. in recent years, wealth-based disparities in attendance rates have narrowed in many countries as primary school attendance has increased.138 however, while children from the poorest households are now more likely to enter school, they are also more likely than their more advantaged peers to drop out.139 140 Pakistan has more than 5.6 million out-of-school children of primary school age. edUCaTion iS noT JUST aBoUT There are also large wealth-related gaps in school attendance and retention (see GeTTinG ThroUGh SChool; Figure 2.4). Children in the richest 20 per cent of the population get nearly nine more years of schooling, on average, than children in the poorest 20 per cent. This wealth learninG iS WhaT CoUnTS. gap is magnified by gender disadvantages among the poorest girls and by regional disparities. While Pakistan is making national progress in primary school completion, some groups – notably poor rural girls – have been left behind.141 education pathway analysis helps to identify when disparities intensify as children progress in school. in nigeria, disparities begin early. according to 2013 data, less than a third of poor nigerian children between 15 and 17 years of age had entered primary school at the correct time, though nearly all of the children from richer households had (see Figure 2.5). The gap continues to widen at the start of each level of education, as greater proportions of poor children drop out. By the start of upper secondary education, only 7 per cent of poor children enter school, compared to 80 per cent of wealthier children. Equity and learning outcomes education is not just about getting through school; learning is what counts. But assessments of the knowledge and skills that children acquire in school indicate that education systems have failed millions of children. Worldwide, nearly 250 million children of primary school age – well over one third of the 650 million children in this age group – do not master basic literacy and numeracy, according to an estimate from 2013.142 Some 130 million of them spend at least four years in school and still lack these skills. learning deficits begin early, sometimes even before primary school. in 28 countries or areas with available data, less than half of children between the ages 143 of 3 and nearly 5 were developmentally on track in literacy and numeracy in 2014. The lack of learning in children’s early years raises concerns at many levels. in early childhood and primary school, children acquire the foundational skills that allow them to develop problem-solving capabilities, flourish in secondary education and later succeed in employment markets. The STaTe of The World’S Children 2016 46
FIGURE 2.4 In Pakistan, the level of education achieved depends on gender, residence and wealth average number of years of schooling of youth aged 20–24, 2013 Boys 11.10 years Boys Urban 10.76 10.5 years 1 years Richest 20% 10.50 years Rural 10.46 years Girls 10.25 years Girls 9.95 years National average 6.30 years Boys 3.69 years Boys 3.08 Urban years 2.54 years Poorest 20% 1.99 years Rural 1.86 years Girls 1.27 years Girls 0.75 years Note: Chart is not drawn to scale. Source: UneSCo, Global education Monitoring report, World inequality database on education (Wide), 2013 dhS data. The STaTe of The World’S Children 2016 47
Education: Levelling the playing field >> Equity and learning outcomes FIGURE 2.5 Wealth, gender and residence affect education in Nigeria FIGURE 2.5 educational attainment of upper-secondary-school-aged adolescents by sex, residence and wealth quintile, 2013 Wealth, gender and residence affect education in Nigeria Educational attainment of upper-secondary-school-aged adolescents in Nigeria, 2013 Entered primary school Still attending primary school Completed primary school Still attending lower secondary school Transited to lower secondary school Never entered, dropped out or did not transition from previous educational level Completed lower secondary school Transited to upper secondary school 17% never BOYS 83% entered 71% entered GIRLS 29% never entered school primary school primary school entered school 83% 71% 76% 66% 71% 60% 49% 44% 48% 42% 100% 80% 60% 40% 20% 0 20% 40% 60% 80% 100% 48% transited to 42% transited to upper secondary school upper secondary school 6% never URBAN 94% entered 64% entered RURAL 36% never entered school primary school primary school entered school 94% 64% 90% 57% 51% 86% 33% 65% 31% 63% 100% 80% 60% 40% 20% 0 20% 40% 60% 80% 100% 63% transited to 33% transited to upper secondary school upper secondary school 1% never RICHEST QUINTILE 99% entered 28% entered POOREST QUINTILE 72% never entered school primary school primary school entered school 99% 28% 98% 21% 97% 16% 81% 8% 80% 7% 100% 80% 60% 40% 20% 0 20% 40% 60% 80% 100% 80% transited to 7% transited to upper secondary school upper secondary school Note: Due to rounding, some totals may not correspond with the sum of the separate figures. Source: UNICEF analysis based on Nigeria DHS, 2013. The STaTe of The World’S Children 2016 48 65
experiences at home set the stage for success in learning. While more than half of children aged 3 to nearly 5 in most countries are engaged by an adult in learning activities at home, less than half have access to three or more books at home.144 learning outcomes are also tied to the multiple kinds of advantages and disadvantages that children face. evidence shows that poverty often leaves children with deficits in learning outcomes (see Figure 2.6). Starting early in life, even before reaching age 5, children from poor households are more likely than their more affluent peers to present developmental delays in literacy and 145 numeracy. in india, being born into the poorest households carries a learning ‘penalty’ relative to children from the richest households. The penalty widens between ages 7 and 11, reaching a 19 per cent gap in students’ ability to 146 subtract. When children face wealth-related disadvantages and have parents who did not attend school, there are powerful multiplier effects – especially for young girls. By age 11 in india, girls and boys who come from the richest homes and have educated parents enjoy a huge academic advantage over other children. The most advantaged boys and girls are about six times more likely to learn basic reading and mathematics skills than girls from the poorest households whose parents were not educated.147 FIGURE 2.6 Wealth-based gaps in basic math skills start early and persist over time Percentage of children able to subtract, by age, 2012 90% 80% 70% 60% 50% 40% Ages 7–8: Wealthiest 30% Poorest 20% Ages 10–11: 10% Wealthiest 0 Poorest india Pakistan Kenya Note: While indian and Kenyan children should have completed Grade 2 by age 8, Pakistani children should have completed Grade 3 by age 8. Source: aSer india, aSer Pakistan and Uwezo Kenya survey data from 2012, in rose, Pauline, and Benjamin alcott, How can education systems become equitable by 2030?: DFID think pieces – Learning and equity, United Kingdom department for international development, london, august 2015. The STaTe of The World’S Children 2016 49
Education: Levelling the playing field >> Equity and learning outcomes BOx 2.1 THE DEvELOPING BRAIN: AN EARLY WINDOW OF OPPORTUNITY FOR LEARNING Long before a child enters the classroom, inequities can violence, can affect children by damaging neurons in create a lasting imprint on the architecture of the brain. areas involved in learning and emotional development. In other words, these deprivations affect how the brain Recent research on brain development casts new light develops. Negative experiences in a child’s life often on the formative influence of early childhood experience. manifest themselves later as difficulties with learning, In the first few years of life, a child’s brain creates 700 emotional development and management of anxieties. to 1,000 new neural connections every second, a pace that later diminishes. These early connections set the Because the first years of a child’s life affect brain foundation on which later connections are built. development so significantly, early childhood offers a critical window of opportunity to break intergenerational The new research shows that nutrition, health care and cycles of inequity. Early childhood care, protection and interaction between children and their caregivers can help stimulation can jumpstart brain development, strengthen with brain development in early childhood. Conversation, children’s ability to learn, help them develop psychological repeating and connecting words in meaningful contexts, resilience and allow them to adapt to change. and early exposure to literacy through reading and play are all positively associated with language skills. Early interventions can even affect future earnings. Research has shown, for example, that preventing Conversely, frequent exposure to chronically stressful undernutrition in early childhood leads to an increase in events in infancy, including nutritional deprivation and hourly earnings of at least 20 per cent later in a child’s life. Source: The World Bank, World development report 2015: Mind, society, and behavior, Washington, d.C., 2015, Chapter 5. Center on the developing Child at harvard Univer- sity, ‘Brain architecture’, , accessed 15 March 2016. lake, anthony, and Margaret Chan, ‘Putting science into practice for early child development’, The lancet, vol. 385, no. 9980, 2014, pp. 1816–1817. international food Policy research institute, Global nutrition report 2014: actions and accountability to accelerate the world’s progress on nutrition, Washington, d.C., 2014. although evidence is still limited and fragmented, a growing body of research appears to validate this pattern of substantial differences in key learning indicators between children from the poorest and richest households. research from five countries in latin america finds large wealth-related gaps on children’s standardized test scores for language development. The gaps are evident by 148 age 3, and there is no evidence of recovery once children enter school. The deficits continue as children progress through school. in latin america, a region-wide assessment showed that more than one quarter of third-grade students were unable to recognize basic phrases or locate information in a simple text.149 in india’s rural schools, a 2014 study showed that just under half of children in fifth grade were able to read a basic second-grade text. in arithmetic, half of fifth graders could not subtract two-digit numbers, and only about one quarter could do basic division.150 The same issues arise in other countries. in Uganda, an enrolment success story, just over half of the children in Grade 5 were able to read a story at Grade 2 level, according to the results of a 2012 assessment.151 in Kenya, a third of children in Grade 5 could not perform Grade 2 numeracy tasks. about 10 per cent of students in Grade 8 were unable to perform these tasks, according to a 2012 assessment.152 The STaTe of The World’S Children 2016 50
and at the secondary level, international student achievement tests point to desperately low levels of learning in many low- and middle-income countries. in the most recent Programme for international Student assessment (PiSa), two thirds or more of secondary school students in argentina, Brazil, Colombia, indonesia, Jordan, Peru, Qatar and Tunisia were performing below level 2, a marker of baseline proficiency in math. less than 1 per cent were performing at the top two levels. in comparison, an average of 23 per cent of students in the high-income organisation for economic Co-operation and development (oeCd) countries were low-achieving, and 13 per cent 153 performed at the top level. evidence from latin america underscores the interaction between inequity and low levels of learning achievement. research on the 2012 PiSa scores by the inter-american development Bank found that the average gap between the poorest and richest students of the same age in the region was equivalent to two years of schooling.154 Such failures in learning have repercussions for children’s futures and for national prosperity. Many education systems fail to teach children the skills they need to become productively employed adults and contribute to national social development and economic growth. The costs of misalignment between skills and jobs are visible in many parts of the world. according to the international labour organization, the share of aroUnd one in fiVe YoUnG undereducated young workers in low-income economies is triple that of the PeoPle in oeCd CoUnTrieS share in upper-middle-income economies. in sub-Saharan africa, three in five young workers do not have the level of education needed for their jobs.155 do noT CoMPleTe SeCondarY employer surveys in the Middle east and north africa indicate a pervasive edUCaTion. disconnect between the skills learned in school and those demanded by modern business.156 That mismatch is one of the reasons for the persistently high levels of unemployment among educated youth in the region, and it is an issue facing young people worldwide. as the high-level Commission for Quality education for all in latin america has summarized the problem: “Without significant improvements in learning levels, the rising levels of schooling will hardly turn into the improvements in 157 quality of life to which latin american citizens aspire.” high-income countries also face learning challenges. The growth in the number of children with access to education in oeCd countries has resulted in 80 per cent of young people achieving upper secondary qualifications and a 158 quarter gaining tertiary education. however, around one in five young people in oeCd countries do not complete secondary education and have to make the transition to adulthood facing the prospect of lower wages, less secure employment and marginalization.159 This education gap is an increasingly powerful determinant of wider inequalities in wealth and opportunity, 160 hampering the development of more inclusive societies. for governments, addressing the problems at the source – within education systems – is the most cost-effective way to make sure that children and young people develop the skills and competencies they need. efforts to narrow the learning gaps are under way. in Tunisia, for example, the government has embarked on a major reform process to improve learning outcomes for children in school and on a comprehensive programme for out-of-school 161 children. The STaTe of The World’S Children 2016 51
Education: Levelling the playing field >> Education in emergencies and protracted crises at the same time, many young people are living with the consequences of the system’s past failures. in 2012, UneSCo’s Global Education Monitoring Report found that 200 million 15- to 24-year-olds had left school without basic skills. Tackling this backlog will require investment in second-chance education and skills training for adolescents and young adults through partnerships between 162 governments and the private sector. Education in emergencies and protracted crises increasingly, complex emergencies and protracted crises are impeding the right to education. These emergencies do not just temporarily interrupt children’s lives and educations, they close doors on education for the length of a childhood, or even a lifetime. Though an armed conflict, epidemic or natural disaster can devastate the life of any child, the poorest and most disadvantaged children are the most vulnerable. humanitarian emergencies and protracted crises can disrupt education. an estimated 75 million children aged 3 to 18 in 35 countries are in desperate need of education, according to a recent report. of these children, 17 million are refugees, 163 internally displaced or part of another population of concern (see Box 2.2). notably, girls in conflict-affected contexts are 2.5 times more likely to be out of 164 school than girls in more peaceful settings. Two boys carry chopped in conflict situations, education is often under fire either directly or indirectly, as 165 firewood in Kafar Batna conflict damages schools and endangers the lives of teachers and students. village in Damascus, the a study by the Global Coalition to Protect education from attack documented Syrian Arab Republic. thousands of assaults on students, teachers and institutions in 70 countries in a five-year period ending in 2013. The incidents included bombings, kidnappings, © UNICEF/UN06854/Al Shami illegal arrests, torture and killings of students and teachers.166 The STaTe of The World’S Children 2016 52
Specific examples are numerous. in nigeria, the armed group Boko haram abducted hundreds of women and girls in major attacks in 2014. Between 2012 and 2014, the group killed 314 children in schools in north-eastern 167 nigeria. from the start of the group’s insurgency to the end of 2015, more than 600 teachers had been killed and more than 1,200 schools damaged or destroyed.168 Teachers and children also have been attacked, kidnapped and killed in Yemen, the Syrian arab republic and many other countries. in 2014 alone, there were 163 attacks on schools in afghanistan; nine schools were attacked in the Central african republic; and there were 67 reported attacks on schools in iraq.169 BOx 2.2 THE DESTRUCTIvE IMPACT OF ARMED CONFLICT ON EDUCATION Conflict has immediate and often life-threatening effects available to them. The language of instruction is a major on children. It also holds back the development of the factor hindering their ability to continue their education. In education systems that should be functioning to help them addition, in most countries where refugees settle, Syrian reach their full potential. Recent experience in the Syrian teachers are not employed in the public system. Arab Republic has shown how conflict can halt and even reverse progress on education. But it is not just the Syrian Arab Republic where education is interrupted by conflict. In Gaza, nearly 500,000 children In 2010, before the current crisis began, nearly all of the were unable to return to classrooms at the start of country’s primary-school-aged children and 90 per cent the 2014/15 school year because of damage to school of lower-secondary-school-aged children were enrolled infrastructure. In yemen, conflict had closed thousands of in school. Five years later, some 2.1 million children aged schools and pushed 1.8 million children out of education 5 to 17 in the Syrian Arab Republic were not in school. In as of August 2015, adding to the 1.6 million who were addition, about 700,000 school-age Syrian refugee children out of school before the violence there escalated. In the – half of the school-age refugee population – were out of Sudan, war that has lasted decades in some areas has school in neighbouring states. deprived more than 3 million children of an education. Armed conflicts in the Central African Republic, the More than half of the nearly 4.6 million refugees who have Democratic Republic of the Congo and South Sudan fled the conflict are children, many now facing a future have stalled progress in areas already marked by chronic without the hope that comes with education. Neighbouring deficits in education. states have struggled to cope with this influx. With support from donors, the Government of Lebanon has introduced In DRC, where conflict has been ongoing since 1993, an innovative system that accommodates large numbers more than 3.5 million children of primary school age are of out-of-school refugee children by creating a two-shift out of school. Even so, recent data show primary school system in public schools. About 150,000 refugee children attendance has been increasing steadily – from 51 per have entered Lebanon’s public school system in this way. cent in 2001 to 87 per cent in 2013. Meanwhile, the gaps in attendance between boys and girls, children living in yet there is still a large gap between the education needs urban versus rural areas, and those from the richest and of Syrian refugee children and the learning opportunities poorest households have all been narrowing.170 Source: UneSCo institute for Statistics and United nations Children’s fund, Fixing the Broken Promise of Education for All: Findings from the Global Initiative on Out-of- School Children, UiS, Montreal, 2015, p. 49. United nations Children’s fund, Syria Crisis Education Strategic Paper, london 2016 Conference paper, UniCef, new York, January 2016, p. 1. United nations high Commissioner for refugees, ‘education Sector Situation analysis’ for november and december 2015, found on the Syria regional refugee response website, , accessed 12 January 2016. United nations Children’s fund regional office for the Middle east and north africa, Education under Fire: How conflict in the Middle East is depriving children of their schooling, UniCef, amman, 3 September 2015, p. 6. Global Partnership for education, democratic republic of Congo page, , accessed 8 april 2016; MICS 2001 and 2010; DHS 2007 and 2013–2014. The STaTe of The World’S Children 2016 53
Education: Levelling the playing field >> Education in emergencies and protracted crises Conflict that drives children and families from their homes often leads to a state of persistent displacement. at the end of 2014, half of all refugees had been in exile for more than 10 years, and at least half of internally displaced 171 people had a high probability of being uprooted for three years or longer. for them, displacement has become the new normal. But conflict is not the only cause of protracted crisis in children’s lives. Climate change poses another growing danger, intensifying the risks associated with drought and floods. Climate-related disasters threaten children’s lives and disrupt their education, creating conditions that leave them at increased risk of 172 abuse, neglect, trafficking and child labour. These disasters can also inflict extensive damage on school infrastructure. When Cyclone Pam struck Vanuatu in 2015, for example, it affected about 80 per cent of schools. Some were damaged and others were turned into evacuation centres.173 The problem exists throughout the Pacific region, where many schools in small island states are unavoidably located near coastal areas. Throughout the region, climate change and weather-related emergencies have hindered efforts to provide children with good-quality learning opportunities.174 despite the challenges of conflict and climate change, education accounts for a small share of requests for humanitarian aid – and only a small fraction of those requests are funded. less than 2 per cent of the funds raised by 175 humanitarian appeals went to education. This figure suggests that education is considered a low priority in humanitarian contexts, a viewpoint that is curiously out of step with the aspirations of parents and children affected by 176 crises. for them, a return to school can help restore a sense of security, normalcy and, above all, hope for a better future. The deeper problem is that aid mechanisms are poorly aligned with real needs. it is not possible to finance education for children facing the prospect of long-term displacement through short-term (and invariably under-funded) emergency appeals. rapid response has to be coupled with long-term financing. a holistic approach that bridges the traditional divide between development expertise and humanitarian response is required. By linking humanitarian and development efforts, education programmes in emergency or post-emergency contexts can provide children with the chance to bounce back and lead productive, peaceful and fulfilling lives. The STaTe of The World’S Children 2016 54
Nydeng Khot Gatkwoth, 10, her brother Chuol, 12, and a friend attend a UNICEF- supported temporary learning space in the Bor Protection of Civilians Site, South Sudan. © UNICEF/UN010064/Rich Benefits of quality education The inequities that deny children the right to quality education from early childhood through adolescence can trap young people in low-skilled, poorly paid, insecure employment, which holds back economic growth and fuels inequality. Changing demographics underscore the importance of educating all children, especially those who have been excluded. in the next 15 years, the population of 15- to 24-year-olds worldwide will increase by nearly 100 million. The largest share 177 of this cohort will be in asia and africa. if current trends continue through 2030, the poor-quality education and high levels of inequity in access to school compromising young people’s future employment prospects and their countries’ economic growth can also threaten stability and social cohesion. indeed, in many low- and middle-income countries, growing disparities in education among different social groups already have increased the 178 probability of conflict. Conversely, if this growing population enters adulthood with the skills needed to build secure livelihoods and make positive choices, the effects could be socially and 179 economically transformative. Good quality and equitable education serves to unlock opportunity and undo intergenerational cycles of inequity: on average, each additional year of education a child receives increases her or his adult earnings by about 10 per cent. and for each additional year of schooling completed, on average, by young adults in a country, that country’s poverty rate falls by 9 per cent.180 The returns on education are 181 highest in low-income and lower-middle-income countries. Some of the highest returns of all are associated with education for girls. education empowers girls later in life to seek better health care during pregnancy, in childbirth and during their children’s early years. The results are reflected in lower levels of under-five mortality, reduced fertility, improved health-care practices and later marriage and childbearing.182 Children – especially girls – born to educated mothers are more likely to attend school, resulting in a cycle of opportunity that extends across generations. There is also evidence that education is associated with higher levels of civic engagement and participation in political processes.183 The STaTe of The World’S Children 2016 55
Education: Levelling the playing field >> Reaching children throughout the learning process education can also be a tool in the fight against child rights violations such as child labour, though stopping such violations will demand action on many fronts. historically, enforcement of compulsory education has provided a powerful impetus towards ending child labour. in today’s rich countries, that was a critical part of the largely successful effort to limit the practice in the late nineteenth 184 and early twentieth centuries. Backed by the right mix of anti-poverty measures and strategies for improving the quality of learning opportunities, compulsory education could play a similar role in the struggle to eliminate child labour in the low- and lower-middle-income countries of the twenty-first century. The benefits of education are not solely the product of more years of schooling. learning outcomes also matter and have a powerful effect on earnings, the 185 distribution of income and long-term economic growth. in lower-middle- income countries, if all children born today could be educated to a basic level of literacy and numeracy skills, there would be a 13-fold increase in GdP over their 186 lifetimes. Universal basic skills can also make economic growth more inclusive. disparities UniVerSal BaSiC SKillS Can in access to quality education are among the most powerful determinants of alSo MaKe eConoMiC GroWTh income disparities because of the effect learning and skills have on productivity, More inClUSiVe. wages and employment. narrowing the skills gap would create the conditions for more equitable patterns of growth, while increasing the size of the economy 187 and reducing poverty. Reaching children throughout the learning process as suggested previously in this chapter, quality education begins with interventions in early childhood. There is evidence that early childhood education can prepare children from the most disadvantaged homes for greater success when they enter primary school. however, not all children have access (see Figure 2.7). in Cape Verde, an assessment of children entering primary school demonstrated a 14 percentage point advantage for children who attended pre-primary school 188 over the children who did not. an evaluation published in 2009 from argentina found that attending pre-primary school had a significant positive effect on standardized test scores in third-grade math and Spanish. it also improved classroom attention, effort, discipline and participation. and the benefits of preschool for children in neighbourhoods with high poverty levels were greater 189 than for other argentine children. early childhood interventions for poor children in Bangladesh, indonesia, the Plurinational State of Bolivia, and other countries have all shown results in reducing early learning gaps.190 Unfortunately, attendance rates for pre-primary education are lowest in the poorest countries with the highest levels of child poverty.191 early interventions thus build a foundation for making sure that all children complete school and learn essential knowledge and skills. But equity in education requires even more. it calls for a focus on the children who are left behind throughout the learning process. The progress these children make will have to be accelerated if their rates of school participation and their learning outcomes are to catch up with those of more advantaged children by 2030. The STaTe of The World’S Children 2016 56
This acceleration can take different forms, depending on the national context. The Philippines, Senegal and Uganda, for instance, all have large out-of-school populations at different levels of school enrolment and completion. in the case of Senegal, while there are large disparities in primary school completion rates among different social groups, all groups are far from universal completion. The challenge is to accelerate overall progress with rapid advancement for disadvantaged groups. By contrast, in the Philippines and Uganda, children from the wealthiest households and the best-performing regions are close to universal school completion. Therefore, efforts in those countries would best be concentrated on the poorest and most disadvantaged children (see Figure 2.8). disparities in access among different groups of children dictate the rate of progress needed in each group to achieve universal primary school completion. The needs of each group, in turn, will have far-reaching implications for how governments frame policies and allocate resources to specific regions, schools and children. To succeed, these policies must combine a commitment to equity in the schools with initiatives that tackle the determinants of inequity operating outside the classroom. The reaching out-of-School Children programme in Bangladesh illustrates how governmental and non-governmental organizations can develop innovative strategies for reaching the most disadvantaged children. as part of the programme, ananda (Joy of learning) Schools have offered a second chance at FIGURE 2.7 Early childhood education gaps vary by wealth and residence early childhood education attendance by wealth, residence and national average Early 100% childhood education 90% attendance 80% 70% 60% 50% 40% 30% 20% 10% 0 Ghana Jamaica lao People's nigeria Tunisia Viet nam democratic republic richest Poorest Urban rural national average Note: data are for 2011, except for the lao People’s democratic republic and Tunisia (2011–2012) and Viet nam (2013–2014). Source: UniCef global databases, 2016. The STaTe of The World’S Children 2016 57
Education: Levelling the playing field >> Reaching children throughout the learning process FIGURE 2.8 Progress must accelerate for the least advantaged children Speed of acceleration required for universal primary completion for all, by background richest Poorest Urban rural SENEGAL 100% Ziguinchor 75% louga 50% 25% 0 2015 2020 2025 2030 UGANDA 100% Kampala 75% Karamoja 50% 25% 0 2015 2020 2025 2030 THE PHILIPPINES 100% national Capital region 75% autonomous region in Muslim Mindanao 50% 25% 0 2015 2020 2025 2030 Note: Calculations use the survey year and the annual compound rate of change. Source: dhS data, overseas development institute calculations. The STaTe of The World’S Children 2016 58
education for children in areas of high poverty and low school completion rates. Blending formal and non-formal methods to prepare students aged 8 to 14 for Grade 5 exams, the schools enrolled more than 790,000 children in 90 of the country’s poorest upazilas (sub-districts) between 2005 and 2012 and achieved an 192 83 per cent pass rate. The goal is to reach 148 sub-districts by 2017. initiatives like the one in Bangladesh demonstrate that the goal of reaching the hardest-to-reach children with quality education is not a matter of simply doing more of the same. it demands a commitment to trying something new. from argentina to Zimbabwe, new approaches to education are tested and scaled to meet local, national and global needs. Some innovations make use of new technology. eduTrac, for example, is a mobile phone-based data-collection system using SMS technology to encourage the flow of real-time information 193 on education indicators in Uganda, among other countries. Through elearning Sudan, electronic tablets are used to instruct out-of-school children in remote villages of north Kordofan state, where traditional modes of education are not 194 available. other innovations tackle the challenge of education in crisis situations with self-learning curricula that provide access to alternative education with adult guidance. attitudes and cultural norms will also have to change. in Montenegro, for example, national efforts have been under way to change attitudes that block access to education for children with disabilities. an intensive public awareness campaign, which started in 2010, is partially credited with generating greater 195 public interest in the issue. a poll in 2014 showed that 78 per cent of 196 Montenegrins supported inclusive education. Equity targets To accelerate progress for the hardest-to-reach children, national education eQUiTY TarGeTS Can ProVide policies may consider setting equity targets – calibrated to national a Clear SeT of PrioriTieS circumstances – aimed at making sure all children have a fair chance to go ThaT Shine a SPoTliGhT to school and learn. interim or ‘stepping stone’ equity targets on the road to meeting the 2030 goals for education would also be useful. on a CoUnTrY’S MoST edUCaTionallY diSadVanTaGed for instance, governments could set an interim target of halving disparities Children. associated with wealth, gender, ethnicity and location in access to early childhood, primary and lower secondary education by 2022. or they could decide on an interim target that places special emphasis on the poorest girls. 197 Similar interim targets could be set to reduce disparities in learning outcomes. equity targets will make a difference only if they are grounded in policy reform, and closing gaps in school participation will require detailed data on who is out of school or at risk of dropping out. Some equity targets can be achieved through the education system – for example, through learning assessment tools that identify which children are falling behind and guide resources towards them. other targets can be reached by tackling disadvantages associated with poverty, gender, ethnicity and disability. as a guide for policymakers, equity targets can provide a clear set of priorities that shine a spotlight on a country’s most educationally disadvantaged children. The STaTe of The World’S Children 2016 59
Education: Levelling the playing field >> Teaching matters Teaching matters inextricably linked to issues of effective learning and equity are the women and men who interact with children in learning environments: teachers. effective teachers can transform lives. Poorly trained, badly paid, ineffective teachers working in weakly governed education systems undermine opportunity and often reinforce inequities. Problems associated with teachers and the governance systems in which they operate are evident worldwide. among other issues, teacher absenteeism is endemic in many countries. for example, a 2013 survey of primary schools in Kenya reported teacher absenteeism rates of nearly 17 per cent for public primary 198 schools. other aspects of teaching and class planning have received insufficient attention. for example, a wave of first-generation learners – children whose parents did not have access to education – have entered primary school. These students are considered to be at risk of low learning levels. Yet teacher training systematically fails to equip educators with the skills needed to teach them.199 how teachers are distributed within a country can create difficulties with class size and quality of instruction for disadvantaged children in underserved districts. in countries with data on student-teacher ratios and qualifications of teachers, it is the early grades – ironically, the grades with the most students and the greatest needs – that have the largest classes and the least qualified teachers.200 Poorly trained and unmotivated teachers are hardly the only governance issue in underperforming schools. a lack of planning and financing becomes evident in the form of overcrowded classes, insufficient resources and poor infrastructure. for example, in sub-Saharan africa, over half of the schools lack access to drinking water and toilets.201 not all have separate facilities for boys and girls. few schools have access to electricity, which they need to take advantage of new learning technologies. average class sizes in the United republic of Tanzania and Malawi are 72 and 90 children, respectively.202 in Uganda, there is one textbook for every three children. as countries seek to climb the scale of educational performance, teachers – by definition – will play a critical role. Societies need to make sure teaching is considered a high-status profession in keeping with its critical role in shaping the future. With the future in mind, national equity goals should aim to connect the best teachers with the most disadvantaged pupils. Too often, career incentives have the inverse effect, guiding the best teachers towards the most advantaged students. research provides a number of clues to guide reform in this regard. in india, a programme run by Pratham, a non-governmental organization, provided remedial 203 education to the lowest-performing children in public schools. hiring informal teachers from the local community to provide supplementary education, the programme achieved marked improvements in test scores. Targeted pedagogical training for teachers in Kenya, Mali and niger similarly improved early grade 204 reading among underperforming children. as these examples suggest, preschool and early grade teaching for first- generation learners and students needing remedial support – scaled up to a national level – could dramatically improve learning trajectories. The most effective route to scaling up these efforts is through national teacher training programmes. The STaTe of The World’S Children 2016 60
There will also simply be a need for more teachers, now that the adoption of the SdGs has committed governments around the world to universal secondary schooling by 2030. even achieving universal lower secondary education by then will require an additional 5.1 million teachers, 3.3 million of them for primary schools. half of the new lower secondary school teachers and 63 per cent of the primary school teachers will be needed to serve the rapidly growing school-aged 205 population in sub-Saharan africa. Education financing one of the lessons of the past decade is that more money, in itself, does not deliver better learning outcomes. how resources are allocated, however, does matter. Many governments around the world have increased education spending. average spending on education in low-income countries increased from 3.2 per 206 cent of GdP in 1999 to 4 per cent in 2012. But many governments continue to systematically underinvest in education, especially in South asia. in 2012, india 207 invested 3.9 per cent of its GdP in education. The Government of Pakistan 208 reports spending about 2 per cent of GdP on education. These investment levels are below the estimated 5.5 per cent of GdP that will be required to 209 provide education for all by 2030. how resources are allocated within countries has an important bearing on equity. Providing equal amounts of finance on a per pupil basis is not necessarily a formula for equitable funding. for a child who enters an education system carrying disadvantages associated with poverty, gender, disability or ethnicity, more resources may be needed to achieve opportunities equivalent to those enjoyed by more privileged children. Unfortunately, spending is often skewed in favour of the most privileged pupils. This is partly because poor children are more likely to drop out of school early, thereby losing the benefits of public spending. UniCef research on low-income countries overall shows that children from the richest 10 per cent of the population receive around 46 per cent of the benefits from public spending on 210 education. A pre-school student, 5, traces a number on a flip chart, as part of a numeracy lesson in Timor-Leste. © UNICEF/UN07789/Nazer The STaTe of The World’S Children 2016 61
Education: Levelling the playing field >> The role of aid Several countries, including Brazil and Viet nam (see Box 2.3), have introduced reforms aimed at achieving more equitable spending patterns. in Chile, a school subsidy programme, Subvención escolar Preferencial, provides a mechanism that makes flat-rate payments for each pupil, plus additional payments to schools that have high concentrations of disadvantaged students and students 211 with learning difficulties. The global commitment to achieving universal secondary education reflects a growing awareness of the role of higher-level skills in driving economic growth. Yet in countries where a large share or even a majority of children fail to complete primary school, increasing spending on secondary education actually could have negative consequences for equity. The per-pupil costs of secondary schooling are far higher than those for primary school, and in many low-income 212 countries, only a minority of poor children even enter secondary education. in addressing this important equity issue, governments should consider the sequencing and phasing of any expenditure increases. Broadly speaking, countries that are still some distance from universal primary completion should focus public spending at the pre-primary, primary and lower secondary levels. as progress towards universal access is achieved, spending can gradually shift to upper secondary education. The role of aid aid continues to play a critical role in mobilizing the resources needed to The 2030 edUCaTion GoalS strengthen education systems for the world’s poorest and most disadvantaged Will reMain oUT of reaCh if children, including children threatened by conflict and displacement. The Children WhoSe liVeS are When a political crisis led to a potentially shattering shortfall in Madagascar’s diSrUPTed BY ConfliCT are budget for primary schools, for instance, an already fragile education system iGnored. faced teacher strikes, a lack of resources and dropping school attendance. in 2013, a UniCef programme provided teacher salaries and supplies that allowed 213 primary school students to continue their studies. But the question of aid is much bigger than any single emergency. Providing universal pre-primary, primary and lower secondary education in low-income and lower-middle-income countries by 2030 will cost an estimated US$340 billion a 214 year. Much of the cost could be covered through a combination of economic growth and increased revenue collection. even if governments meet minimum benchmarks in these areas, though, there will still be an annual education financing gap of US$39 billion in low-income and lower-middle-income countries. in the case of low-income countries, the gap is equivalent to 42 per cent of the financing needed to meet the 2030 education goals.215 Whichever way the equation is viewed, without an increase in aid, the gap will leave many countries far short of the goals, with fragile states experiencing some of the largest potential shortfalls.216 recent developments in aid for education are not encouraging. Between 217 2010 and 2013, development assistance for basic education fell 11 per cent. Several major bilateral donors have cut aid to education, and the international aid architecture is ill suited to address the plight of children affected by armed 218 conflict and humanitarian emergencies. But the 2030 education goals will remain out of reach if the children whose lives are disrupted by conflict are ignored. The STaTe of The World’S Children 2016 62
To address this concern, a group of organizations and leaders – including UniCef and the United nations Secretary-General’s Special envoy for Global education, Gordon Brown, launched education Cannot Wait – a fund for education in emergencies. Geared towards rapid disbursement in the immediate aftermath of a crisis and sustained support over the longer term, such a fund could help bridge the gap in education financing. Two factors stand out as critical to its success. first, there is a global shortfall of around US$8.5 billion a year – an average of US$113 per child – in the funding 219 needed to educate the estimated 75 million children affected by crises. To make up that deficit, the fund for education in emergencies would need to involve regional governments in conflict-affected areas, the private sector and philanthropists. Second, governance arrangements would be needed for effective coordination across United nations agencies, multilateral partnerships such as the Global Partnership for education, and aid organizations. Coordination could give rise to partnerships that successfully bridge the divide between humanitarian responses and development expertise. BOx 2.3 BRAzIL AND vIET NAM: MAkING THE GRADE B Brazil and Viet Nam offer valuable lessons on reforming razil’s successes were driven by multiple reforms education systems. that began in the mid-1990s and included the establishment of an independent evaluation body, In 2012, students in Viet Nam achieved mathematics and which became the Evaluation System for Basic reading scores in the Programme for International Student Education. The system now serves as a transparent Assessment (PISA) that were far higher than expected given reporting mechanism and a common method for the country’s income level. Fifteen-year-olds performed measuring learning achievements. High-performing on a par with their peers in Germany and outperformed schools are allowed greater autonomy, while students in the United Kingdom and the United States. This underperforming schools receive support for achievement resulted from the country’s commitment to improving standards. measuring success and providing resources to achieve its education goals. By 2012, Viet Nam was allocating Brazil also increased funding for education, which 21.4 per cent of its national budget to education. Teachers reached 6.3 per cent of GDP by 2012. The central were capable and absenteeism was very low. government’s financing facility targeted funds to schools in low-performing municipal education In Brazil, meanwhile, success was recorded in enrolment, systems, and it now funds pre-primary education increased equity and learning outcomes. Between 2003 as well. Teacher training improved and equity was and 2012, enrolment rates for 15-year-olds increased strengthened with Bolsa Escola, a programme that from 65 per cent to 78 per cent. Many of the children provided cash transfers to poor households. entering the school system were from socio-economically disadvantaged groups. Also between 2003 and 2012, The examples of Viet Nam and Brazil show that Brazilian students’ average PISA scores rose by 25 points; accelerating educational progress for the children left for disadvantaged pupils, the increase was 27 points. furthest behind can produce positive results. Source: Bodewig, Christian, ‘What explains Vietnam’s stunning performance in PiSa 2012?’, east asia & Pacific on the rise, World Bank blogs, 11 december 2013, , accessed 22 January 2015. The World Bank, ‘Government expenditure on education as % of GdP’, , accessed 12 february 2016. hanushek, eric a., and ludger Woessmann, Universal Basic Skills: What countries stand to gain, oeCd Publishing, 2015, pp. 31–33. Bruns, Barbara, david evans and Javier luque, Achieving World-Class Education in Brazil: The next agenda, The World Bank, Washington, d.C., 2012, pp. 7, 40, 11, 8. UneSCo institute for Statistics, database, , accessed 10 february 2016. The STaTe of The World’S Children 2016 63
Education: Levelling the playing field >> Equitable progress is possible five years of conflict in the Syrian arab republic have illustrated the critical need to make education an integral part of the response to humanitarian crises. in this case, no lost Generation, an initiative launched by UniCef and partners, offers protection and learning opportunities for children and adolescents in the Syrian arab republic and the countries where millions of Syrian refugees have settled, including egypt, iraq, Jordan, lebanon and Turkey. Equitable progress is possible education has the power to end intergenerational cycles of inequity and improve the lives of children and the societies in which they live. however, achieving effective learning for all children regardless of their circumstances – from early childhood education through primary and secondary school – is a daunting challenge. a drive for greater equity is a condition for meeting the challenge by 2030, but will it run the risk of undermining the overall quality of school systems? do the demands of equity and quality pull in different directions? international experience provides an unequivocal answer: The highest- performing education systems in the world – such as those in finland, the republic of Korea and Japan – have been successful in combining equity with 220 quality. These systems strive to deliver quality education for all children, recognizing that the needs of the most disadvantaged pupils are as important as the accomplishments of the most advantaged. recent evidence from the PiSa learning assessments in the oeCd countries is instructive. of the 13 countries that were able to substantially increase their scores, nine did so from a starting 221 point of strong equity and the other four increased equity. Fajer, 5, sits in a classroom at Teabat al Reah School in the Zumar sub-district of Ninewa, Iraq. © UNICEF/UNI199908/Anmar The STaTe of The World’S Children 2016 64
Universal primary and secondary schooling and improved learning outcomes are ambitious but achievable goals. Many countries have developed and tested innovative approaches to meeting these goals, and there have been some successes. Chile has been one of the world’s fastest climbers in international and regional learning assessments, and the gaps in basic education test scores between the country’s poorest and richest children have been narrowing.222 as noted previously, Brazil and Viet nam have succeeded in expanding access to education, improving learning outcomes and strengthening equity. from these examples, some of the ingredients of successful reform emerge. establishing equity as a central goal for access and learning can guide countries in reforming their education systems to make sure that the most disadvantaged Indigenous Awa children stand in children are not forgotten. Countries need to identify disadvantaged schools, line to enter the El Diviso school in pupils and regions, and direct more financial support to them. More spending Colombia. on education also will be essential. While much of the impetus for change has to come from national governments, the international community has a vital role © UNICEF/UN013357/LeMoyne to play in supporting and financing education. Success in providing quality education for every child depends on making learning an explicit objective in education policy and on investing in the development of strong national learning assessment institutions. it requires a strong commitment to the professionalization of teaching and improved teacher training and support systems. To help children from poor and marginalized groups overcome the disadvantages they start out with, early childhood care and universal pre-primary education should be priorities. in addition, providing disadvantaged children with access to quality education requires integrated strategies to combat poverty and efforts to remove the financial barriers to education. The benefits of investing in quality education for the most disadvantaged children are tremendous – for this generation of children, for the next generation and for the communities and societies in which they live. education nourishes young minds, expands horizons and can break the cycle of disadvantage that traps generations in poverty. By investing in education systems and putting the needs of the most disadvantaged children first, nations can unlock education’s potential to transform children’s lives and the world. The STaTe of The World’S Children 2016 65
PERSPECTIVE: Give children a chance By Gordon Brown, United nations Special envoy for Global education The voices of young people are at fever pitch. The world’s biggest challenge in the decade to Technologically gifted, hungry for knowledge and with come is bridging the gap between, on one hand, the boundless energy, today’s children and youth adapt opportunities young people have been promised, see quickly. They are connected. This is the generation that others enjoying and expect, and on the other, the denial ‘gets it’. of those opportunities as doors are closed to them and the ladders of opportunity are kicked away. So global leaders should listen. But all too often, they don’t. Somehow, our planet’s future guardians – millions The good news is that children across the world are of them – continue to be underestimated, ignored and participating in rights campaigns. in Bangladesh, abused. now, all that children are likely to see is a greedy young girls are forming child marriage-free zones. Child world that denies them their right to equal opportunities labourers have joined the Global March against Child and the chance to flourish. labour. and a girls’ rights movement pressing for access to education has been inspired by Malala Yousafzai, the despite international laws designed to protect child more than 200 still-missing Chibok girls of nigeria and rights, emergencies and protracted crises affected the 1,000 global youth ambassadors from a World at School, education of an estimated 75 million children and young a campaign working to get all children into school. people 3 to 18 years of age. Many are living without proper access to food, shelter, health care and education. it is time for progressive minds everywhere to support Many of them are victims of human trafficking and sexual these freedom struggles. here is a set of short-term, exploitation. practical proposals that can not only advance the SdGs but also support a global civil rights movement for around 150 million children under the age of 14 are children and young people. engaged in child labour, often in hazardous conditions. Child trafficking is on the rise and 5.5 million children are engaged in forced labour, with thousands more subject Invest in children to abuse, forced into marriage and coerced into militias despite the prohibition of such practices under the rome Making sure children have the opportunities they need Statute of the international Criminal Court (iCC). to flourish and realize their rights will take resources. We must focus on getting every child into school and also for decades, civil rights and liberation movements ensure that quality of learning is consistently high. have fought the worst of oppression – from Western colonialism to South african apartheid, discrimination education Cannot Wait – a fund for education in against african americans and centuries-old prejudice emergencies can address the needs of the estimated against gay and lesbian adults. By comparison, children’s 75 million children affected by crises and protracted rights have been neglected. They continue to be emergencies. The fund, launched in May 2016, would undermined even as world leaders commit to more help offset an annual funding shortfall of US$8.5 billion ambitious targets for health, education and security needed to maintain access to education for these under the newly adopted Sustainable development children. Goals (SdGs). in addition to greater international aid, countries While the number of out-of-school boys and girls of should adopt child-focused budgeting of their available primary school age rose from about 56.6 million in 2010 resources. Under article 4 of the Convention on the to 59 million in 2013, for example, aid to basic education rights of the Child, States parties are obligated to invest has been cut – yet again. it is down nearly 10 per cent in children to the maximum extent of their available since 2010. resources. as a result, increasing numbers of countries The STaTe of The World’S Children 2016 66
Give children a chance are designing budgets with children specifically in an annual meeting of the United nations Security mind. The Committee on the rights of the Child, with Council as a Children’s rights Council would have a huge the support of child advocacy organizations, is already impact. over the course of the year, a children’s sub- drafting a General Comment on public spending council of the Security Council could examine the key to realize children’s rights that will clarify the policy issues that need to be raised. implications of article 4. To make this happen, the United nations General assembly should host a session for children and young Uphold child rights people, preferably before its next session. ideally, agreement on a United nations Children’s Council that But more resources, by themselves, will not suffice. reports to the Security Council could be reached in time What is to guarantee that children’s rights will be upheld for the 70th anniversary of the Universal declaration or even taken seriously? of human rights in 2018. and by the 30th anniversary of the Convention on the rights of the Child in 2019, no United nations convention has been ratified in we could see the establishment of a new international as many countries as the Convention on the rights Children’s Court. of the Child. But in too many areas, these rights are not being implemented. Similarly, the 1998 rome The long-term goal is much simpler: Give children a Statute recognizes the need for special measures chance. Give children a voice. The future is theirs. to protect children as victims and witnesses during judicial proceedings, and requires that judicial staff have expertise on children’s issues. Yet criminal acts affecting children and within the province of the iCC – rape, sexual violence, trafficking and the use of children as soldiers – are not being properly investigated. impunity remains widespread. The Third optional Protocol to the Convention on a Communications Procedure, which entered into force in april 2014, allows children to bring complaints about rights violations directly to the Committee on the rights of the Child – but only if no solution is found at the national level. as of february 2016, only 26 countries had ratified the Protocol, and those most likely to violate it are the least likely to sign on. an international Children’s Court, along with a Children’s Commissioner appointed to each country, is therefore vital to address these outstanding issues. Listen to young voices There is at least one other prerequisite for mustering the necessary resources to secure opportunities for children and establishing legal mechanisms to protect their rights. namely, children and young people need Education activist Malala yousafzai speaks with a political mechanism through which they can debate students at a school in the Za’atari camp for Syrian these important issues. Young people’s parliaments refugees in Mafraq Governorate, Jordan. and other platforms for meaningful participation are a must. © UNICEF/UNI158222/Malhas The STaTe of The World’S Children 2016 67
CHILDREN AND POvERTY: BREAkING THE vICIOUS CYCLE The STaTe of The World’S Children 2016 68
ChaPTer 3 Children and poverty: Breaking the vicious cycle No one is more vulnerable to poverty than children. Poverty perpetuates the cycle of disadvantage and inequity, which robs millions of children of their potential and causes irreparable damage that reverberates throughout a lifetime. Putting children at the heart of poverty reduction is one of the best ways to break that cycle and create a level playing field for every child. Muhammad Modu, 15, The amount of money available in a household plays a crucial role in determining internally displaced from the opportunities a child may encounter in life. But for children, poverty is about Malori, digs through a rubbish more than money. it affects very real aspects of their lives – including whether dump for saleable items in they can attend school, be well nourished or have access to health care, safe Maiduguri, Nigeria. drinking water and sanitation. Children from the poorest households are the most likely to die from preventable causes and the least likely to have access to quality © UNICEF/UN016293/Gilbertson vII education and health care. Photo efforts to reduce child poverty must therefore go beyond moving households above a monetary threshold. a multidimensional approach is critical to respond to this multifaceted challenge. This chapter begins by looking at how children experience poverty. it then asks how many of the world’s children live in poverty, defined in terms of ‘extreme’, ‘moderate’ and ‘relative’ monetary poverty. it also explores the multiple and overlapping dimensions of poverty that further deprive children of their rights. The chapter argues that the key to a more equitable world is reducing child poverty in all its dimensions and narrowing the gaps between those who are most and least advantaged. it notes that consistent measurement – and knowing who the most disadvantaged children are, where they live and how they are deprived – is essential to developing successful policies and programmes to end child poverty. finally, the chapter examines the role of cash transfer programmes in reducing poverty and inequality and improving equitable access to nutrition, health, education and other services. The STaTe of The World’S Children 2016 69
Children and poverty: Breaking the vicious cycle >> The effects of poverty in childhood The effects of poverty in childhood There is no universal interpretation of poverty in general, or of child poverty more specifically. While it may seem like a simple concept, poverty is not always easy to quantify. Some may understand poverty as the lack of adequate income to meet basic human needs. others define it as the inability to keep up with the average standard of living in a given society. Still others take a wider view, interpreting poverty as a lack of access to basic services such as education, primary health care or safe drinking water. Viewed from the perspective of a child, the exact definition becomes immaterial. Being deprived, by any measure, is damaging to a child’s development, particularly when deprivations are experienced in early childhood. a child rarely has a second chance at a good start in life. deprivations of health, nutrition or stimulation in the earliest months and years of life when the brain is developing at a rapid pace, can lead to damage that is difficult or even impossible to overcome later. Undernutrition in early childhood, for instance, can result in stunting. left unaddressed at that point, it can affect cognitive development, leading to learning difficulties and poor health in adolescence and adulthood. Poor health, beyond the physical and emotional consequences, also denies children the chance to play and learn. Missing out on education in early childhood or living in an environment that provides little stimulation or emotional support can severely restrict a person’s productivity as an adult. in these and many other ways, poverty, in the form of deprivations that begin in childhood, can be felt throughout a lifetime. Children who grow up deprived not only have limited opportunities to fulfil their potential; they often have no option but to raise their own children in poverty. To break this vicious cycle, poverty reduction must begin with a focus on children. At current trends 9out of 10 of the world’s children living in extreme poverty will live in sub-Saharan Africa in 2030 The STaTe of The World’S Children 2016 70
A woman washes her hands Measuring how many children in dirty water while camping outside to register for a food live in poverty ration card in Thanyang, South Sudan. The first step in reducing child poverty is measuring it. Methods to calculate © UNICEF/UN016625/Holt monetary poverty provide a useful yardstick against which to measure social progress. While limited, these measures are the most widespread indicators used to capture the extent of poverty at the household level and can gauge the financial bottlenecks faced by disadvantaged children and their families (see Box 3.1). Monetary poverty lines are set at both national and international levels. They usually work by placing a value on a basket of goods and services considered the minimum requirement to live a non-impoverished life at current prices. households lacking sufficient resources to afford that basket are considered poor. Monetary poverty measures do not, however, take into account other crucial dimensions – such as lack of education, health, water or sanitation – that are extremely important for understanding how children experience poverty. relying on household-level measures may also mask the fact that individuals within the household, especially children, may not have adequate resources allocated to them and may be deprived in other dimensions. for these reasons, child poverty is best seen as a combination of monetary and non-monetary factors at both the household and individual levels. The STaTe of The World’S Children 2016 71
Children and poverty: Breaking the vicious cycle >> Children living in extreme poverty Children living in extreme poverty The measure most commonly used to calculate monetary poverty is the international poverty line developed by the World Bank and set at US$1.90 per day since october 2015. By this measure, in 2012, almost 900 million people struggling to survive below 223 that line, were living in extreme poverty. Because poorer families tend to be larger, children are disproportionately represented among the extreme poor. While children aged 17 and under account for about one third (34 per cent) of the total population in low- and middle-income countries, they make up nearly half (46 per cent) of the population living on less than US$1.90 per day (see Figure 3.1). nevertheless, the last three decades have seen unprecedented progress in reducing extreme poverty. The overall proportion of people living in extreme poverty has fallen, and that trend is projected to continue. in 2012, the number of people living in extreme poverty worldwide was almost half of what it had been at the end 224 of the 1990s. But particular attention to the pace of progress is warranted in some regions. in the Middle east and north africa, for example, after years of progress, the rates of monetary poverty appear to be stagnant or, by some estimates, even on the rise.225 BOx 3.1 MONETARY CHILD POvERTY MEASURES The most common indicators to measure monetary child National poverty lines poverty are: Governments use national poverty lines to monitor monetary poverty within their own countries. According The international extreme poverty line to these measures, a person is considered poor if he or she lives in a household with a consumption or income The World Bank’s ‘extreme poverty’ line identifies people level below a nationally established threshold. National living in households that have less than US$1.90 per poverty lines are estimated in local currencies and reflect person per day. It is calculated by converting the national national standards. poverty lines from a selection of the poorest countries in the world to a common currency – using purchasing While absolute poverty lines reflect the minimum power parity (PPP) exchange rates to adjust for the level of income or consumption needed to fulfil basic difference in cost of living across countries – and then requirements, some governments opt to use ‘relative taking an average of those lines. poverty’ lines. These thresholds still allow for participation in the normal consumption and living standards of the This measure reflects a very low absolute poverty country but measure poverty in relation to the national standard based on basic needs for survival. It was used average income levels. (The European Union and to set targets for poverty reduction under the Millennium organisation of Economic Co-operation and Development Development Goals and is now part of the Sustainable also use relative poverty lines to compare levels of Development Goals, which aim to eradicate extreme poverty among their members and with other countries.) poverty by 2030. The great advantage of national poverty lines is that The World Bank also calculates higher international they are specific to the country, reflecting its specific poverty thresholds, such as US$3.10 per person per day, characteristics and level of development. However, the using the same per capita approach. These measures methodology used varies greatly across countries and, represent levels of poverty above extreme poverty. therefore, doesn’t allow for comparisons between them. The STaTe of The World’S Children 2016 72
in the Syrian arab republic, data suggest the conflict that began there in 2011 caused a sharp increase in the rate of extreme poverty, measured by the proportion of the population living below a national poverty line. The rate increased 226 from 12.3 per cent in 2007 to an estimated 43 per cent in 2013. Poverty is also a concern for the millions of refugees who have fled the crisis. in 2014, the United nations high Commissioner for refugees estimated that 7 out of 10 registered 227 Syrian refugees in Jordan and lebanon could be considered poor. half of these refugees are children. another region of particular concern is sub-Saharan africa, which accounts for a large and rising share of the world’s extreme poor. Based on current trends, 9 out of 10 of the world’s children surviving on less than US$1.90 a day will live in sub-Saharan africa in 2030 (see Figure 3.2). FIGURE 3.1 A disproportionate share of children live in extreme poverty Percentage of children under 18 among the total population and the extreme poor, in low- and middle-income countries, 2012 estimates are presented as the share of 66% 54% children among the total extreme poor. The analysis considers how the age profile of the extreme poor evolves depending on changes in the age composition of the population, and fertility rates by wealth quintile. The analysis does not include the Middle east and north africa or europe and Central asia due to lack of data and low poverty rates. Percentages for all low- and middle-income countries are estimated based on World Bank data for Sub-Saharan africa, South asia, and the latin america and Caribbean regions. data for other regions were not available at the time of calculation. 34% 46% Total population Total extreme poor (US$1.90 a day) Children under 18 adults (18 and over) Note: Poverty rates are derived from the World Bank’s Povcalnet and Global Monitoring Report 2015/2016. age-disaggregated population profiles are from the United nations department of economic and Social affairs 2012 estimates. fertility rates by wealth quintile are derived from demographic and health Surveys (after 2005). Child poverty estimates were calculated based on regional poverty aggregates and demographic factors, and not household income or consumption survey analysis. estimates for children using the updated international poverty line of US$1.90 a day are not yet available. however, the latest profile of the world’s extreme poor (based on the previous level of US$1.25 a day) revealed that 47 per cent of those living in extreme poverty were 18 years old or younger. Since the data used to calculate the first estimates relied on ranking profiles based on old surveys, the profile should provide a valid reference. Source: overseas development institute calculations for UniCef (2016), based on data from the World Bank (2016), and the United nations department of economic and Social affairs (2013) and dhS (after 2005). The STaTe of The World’S Children 2016 73
Children and poverty: Breaking the vicious cycle >> Children living in extreme poverty FIGURE 3.2 In 2030, 9 out of 10 children in extreme poverty will live in sub-Saharan Africa estimated percentage of children living in extreme poverty (US$1.90 a day), by World Bank region, in 2002, 2012 and projections for 2030 5.1% 3.9% 100% 6.5% 10.9% 4.5% 0.7% 80% 27.3% 32.4% 60% 37.5% 88.3% Region: 40% latin america and the Caribbean 52.9% east asia and the Pacific 20% 30.2% South asia 0 Sub-Saharan africa 2002 2012 2030 Note: Poverty projections are linear interpolations based on projections published in the World Bank’s Global Monitoring Report 2015/2016 and assume average growth over the past 10 years. The analysis does not include Middle east and north africa, europe and Central asia due to lack of data and low poverty rates. The analysis considers how the age profile of the extreme poor evolves depending on changes in the age composition of the population and fertility rates by wealth quintile. Source: overseas development institute calculations for UniCef (2016), based on data from the World Bank (2016) and United nations department of economic and Social affairs (2013) and dhS (after 2005). BOx 3.2 MEASURING MULTIDIMENSIONAL CHILD POvERTY Ideally, all countries should report on the number of The Multidimensional Poverty Index (MPI) is one example children living in poverty using both monetary and of a tool designed to enhance poverty data. The index multidimensional measures. covers three dimensions of disadvantage – health, education and material deprivation – measured by 10 Monetary measures, such as the national and international indicators. MPI data reports, which can be disaggregated poverty lines mentioned previously, are already widely for children, count individuals as poor when they are used to report progress in reducing poverty. They can form disadvantaged in relation to at least one third of the the basis for estimating the number of children living in indicators. monetary poverty – that is, the child poverty rate – at the national, regional and global levels. The Multiple overlapping Deprivation Analysis is another tool, developed by UNICEF, to sharpen the equity focus of Multidimensional child poverty measures add depth and child poverty and deprivation analyses around the world. complexity to the data. They can be adapted and applied t It selects the child as the unit of analysis, rather than the o each country’s economic and social context, informing the household, since children experience poverty differently development of national approaches to poverty reduction. than adults. The STaTe of The World’S Children 2016 74
This concentration is especially alarming given that sub-Saharan africa is the world’s youngest region, with children under age 18 accounting for around half the 228 population. over the next 15 years, the region will account for almost the entire increase in the world’s population of children. if current trends persist, 156 million children in sub-Saharan africa will be struggling to survive on less than US$1.90 a day 229 in 2030; as a group, they will comprise nearly half of the world’s extreme poor. Poverty is not just more pervasive but also more intense in sub-Saharan africa than in other regions. on average, poor people there are starting the journey towards the US$1.90 extreme poverty threshold from a lower base than their counterparts in other parts of the world. Some 89 million people in the region, or around 10 per cent of the population, lived on less than 80 cents a day in 2012. in sub-Saharan africa, people who are below the extreme poverty threshold live on an average of 230 US$1.20 a day, compared to US$1.50 for the extreme poor in South asia. Children living in ‘moderate’ poverty it is worth noting that the extreme poverty line of US$1.90 a day is not a hard-and-fast border dividing the poor from the non-poor. Millions of children living above this line still live in poverty, are vulnerable to it or experience deprivations in other dimensions of their lives. data using broader poverty lines give a sense of the global and universal nature WorldWide, More Than of poverty (see Figure 3.3). in 2012, more than 2 billion people in low- and 3 Billion PeoPle reMained middle-income countries lived on less than US$3.10 a day, which is considered VUlneraBle To PoVerTY ‘moderate’ poverty. This total includes almost 900 million people in South asia, in 2012, SUBSiSTinG on leSS some 500 million in east asia and the Pacific, and about 72 million in latin america and the Caribbean. about 50 million people in the Middle east and north africa lived Than US$5 a daY. on less than US$3.10 a day in 2008, the latest year for which reliable surveys are 231 available. Worldwide, more than 3 billion people remained vulnerable to poverty in 2012, subsisting on less than US$5 a day.232 in many cases, these people – who represent more than half the population in low- and middle-income countries – are already subject to some dimensions of deprivation and remain well within the gravitational pull of extreme poverty. a drought, an illness, the outbreak of conflict or an economic downturn is all it might take to put them back under the US$1.90 a day level. The experience of latin america illustrates the need to look beyond poverty thresholds. Between the mid-1990s and 2011, extreme poverty in the region fell by half, thanks to rising incomes as well as pensions and other social transfers.233 in 2012, there were more people in latin america’s middle class than in the ranks of the extreme poor. however, 38 per cent of the population lived on a daily income of between US$4 and US$10 a day in 2013, at risk of slipping back into extreme poverty.234 Poor children living in rich countries relative poverty, which is of particular relevance in richer countries, can also affect the lives of children. having fewer opportunities to be educated, healthy or nourished compared to their peers puts children at a disadvantage and limits their life chances. The STaTe of The World’S Children 2016 75
Children and poverty: Breaking the vicious cycle >> Poor children living in rich countries FIGURE 3.3 More than half of the population in low- and middle-income countries live on less than US$5 a day Percentage of population living below various international poverty lines, by World Bank region, 2012 100% 82% 84% 80% 67% 60% 55% 55% 44% 43% 40% 35% 25% 22% 19% 20% 13% 12% 15% 7% 6% 6% 2% 0 east asia and europe and latin america and South asia Sub-Saharan Total the Pacific Central asia the Caribbean africa People vulnerable to poverty (less than $5.00 a day) People living in moderate poverty (less than $3.10 a day) People living in extreme poverty (less than $1.90 a day) Note: Total refers to low- and middle-income countries available in Povcalnet. data were not available for the Middle east and north africa at the time of calculation. all estimates are based on purchasing power parity figures (current international $) extrapolated from the 2011 international Comparison Program (iCP) benchmark estimates. US$5.00/day is not an official international poverty line used by the World Bank. Source: The World Bank (2016). eight years after the onset of the 2008 financial crisis, the slow pace of economic recovery, high levels of unemployment, financial pressure and rising inequality are jeopardizing the hopes of a generation of children in high-income countries belonging to the organisation for economic Co-operation and development 235 (oeCd). at the same time, children and poor families are feeling the effects of deficit reduction programmes initiated by governments in response to the 236 crisis. in the 41 most affluent countries, nearly 77 million children lived in monetary poverty 237 in 2014. Taking pre-crisis levels as an anchor point, child poverty rates increased in 23 oeCd countries after 2008. in five countries, child poverty rates increased by 238 more than 50 per cent. in most countries in the european Union, the proportion of children in poverty is higher than the rate for adults (see Figure 3.4). The STaTe of The World’S Children 2016 76
FIGURE 3.4 In most European Union countries, children are at a higher risk of monetary poverty than adults Percentage of population at risk of poverty in the european Union, by age group, 2014 average average adult child poverty poverty rate rate 16.3% 21.1% Czech republic netherlands denmark Slovakia finland france austria Cyprus Slovenia hungary Sweden ireland Belgium Malta luxembourg Germany United Kingdom Poland lithuania Croatia italy Portugal latvia Bulgaria estonia Greece Spain romania 0 5% 10% 15% 20% 25% 30% 35% 40% Population at risk of poverty Total poverty rate adult poverty rate Child poverty rate Note: 'at risk of poverty' is defined as living below the poverty threshold, which is 60 per cent of median equivalized income after social transfers. Source: eurostat (2016) based on european Union Statistics on income and living Conditions. The STaTe of The World’S Children 2016 77
Children and poverty: Breaking the vicious cycle >> Child poverty in all its dimensions Child poverty in all its dimensions Simply living in a household that is above the threshold of monetary poverty does not necessarily mean a child is out of poverty. Consider a family that meets the threshold defined by the national poverty line but still lacks access to shelter, food, water, sanitation, education, health care or information. according to a monetary interpretation of poverty, this family would not be considered poor. a wider interpretation, however, would consider a child living in that household as poor because of the deprivations faced by his or her family. Several measures have been developed to better understand and monitor poverty in its multiple dimensions (see Box 3.2). By looking at the different deprivations that children experience in crucial aspects of their lives, countries can better target policies and programmes that benefit the most disadvantaged. Measures such as the Multidimensional Poverty index aim to accurately estimate the extent of the problem. its most recent findings indicate that 1.6 billion people 239 lived in multidimensional poverty in 2015. another study of multidimensional poverty focused on children in sub-Saharan africa and returned alarming results. in the 30 countries for which comparable data were available, 247 million out of a total of 368 million children under age 18 experience two to five deprivations that threaten their survival and 240 development. a study in 2008–2009 found that 81 million children and adolescents in countries in latin america and the Caribbean were affected by at least one moderate or severe deprivation of their rights to education, nutrition, 241 housing, sanitation, drinking water or access to information. A boy feeds a younger child in the Nyarugusu refugee camp, Disadvantages overlap in Kigoma Region, United Republic of Tanzania. and reinforce one another © UNICEF/UNI186112/Calvin When children experience poverty, poor health, malnutrition, stress, violence, abuse, neglect, inadequate care or a lack of learning opportunities, particularly during the first years of their lives, their ability to fulfil their potential is at risk. a girl who must walk long distances to fetch water has less time to attend school. a child who is undernourished is more susceptible to diseases spread through poor sanitation. a baby who lacks nurturing, stimulation and interaction when the neural connections in the brain are forming might never have the chance to develop fully. each deprivation exacerbates the effect of the others, and when two or more coincide, the effects on children can be catastrophic. deprivations are particularly magnified for children living in fragile and conflict- affected states. These children are more than twice as likely to be undernourished as children in other low- and middle-income countries. They are also more than three times as likely to be out of school, twice as likely to die before their fifth birthday and more than twice as likely to lack access to improved sources of 242 drinking water, according to the World Development Report 2011. in addition to conflict, the impacts of climate change and environmental degradation create new risks and reinforce old social and economic vulnerabilities created by poverty and inequality. Some of the world’s poorest children live in areas that are especially vulnerable to natural disasters such as flooding, drought or The STaTe of The World’S Children 2016 78
Moses, 1, Sarah, 2, and Paul, 7, severe storms. More than 300 million children live in zones of very high flood stand with their mother Lucy occurrence that are also in countries where over half of the population gets by on less than US$3.10 a day.243 and cousin Joslyn, 7, outside their home, destroyed by Super Cyclone Pam, Tanna Island, Children who are already deprived in many dimensions of their lives are likely to Vanuatu. face some of the most immediate dangers of climate change as their families are most exposed to the potential harm and find it hardest to bounce back from © UNICEF/UNI181237/Crumb climate-related shocks. as noted previously, many families living above the threshold of extreme poverty may be just one disaster away from falling into it. as climate hazards arise more frequently, the cumulative effect of repeated shocks will make it difficult for many of the most disadvantaged households to survive, recover, cope and adapt. Urbanization is another force putting pressure on poverty reduction efforts and highlighting inequities. national poverty lines may not take into account all of the high costs of urban living – especially housing, transportation, water, sanitation, education and health services. and children in urban areas may lack access to essential services even when they live close to them. as a result, the risks for urban populations can exceed those in rural areas. for example, a 2006 study in sub-Saharan africa showed greater disparities in child nutrition between rich and poor urban communities than between 244 urban and rural areas. a 2012 study in egypt found that rates of poverty and deprivation among some children in urban slums reached or exceeded those in the country’s most deprived rural areas.245 and for the many children in China who have migrated to cities with their families, holding a hukou household registration from a rural area often means they are not entitled to urban health, 246 education and other critical services. The STaTe of The World’S Children 2016 79
Children and poverty: Breaking the vicious cycle >> Universal measurement of child poverty The challenges facing children in poor urban communities are particularly relevant in light of the projection that 66 per cent of the world’s population will be urban in 2050, with the fastest urbanization on the african and asian 247 continents. excluded from other opportunities, many of the urban poor have little choice but to take informal jobs that are outside of government regulation, taxation and observation. The most marginalized people – including women and people with disabilities – are often trapped in the informal economy because of 248 discrimination, which limits their opportunities. There is a strong link between informal work and poverty.249 informal workers lack basic social protection, face unsafe working conditions and are subject to layoffs without compensation. They are locked in low-productivity activities with few opportunities for mobility and no protection in the event of non-payment of wages. race, ethnicity and social exclusion also often play a role in determining a child’s life chances, even in some of the world’s richest countries. in the United States in 2013, 39 per cent of african american children, 36 per cent of american indian children and 32 per cent of hispanic children lived in poor families, defined as having income below the established federal poverty level. That compares to 13 per cent of the country’s white children and 13 per cent of its asian children.250 in europe, roma people are the largest ethnic minority and are among the most 251 deprived. a 2011 study in 11 european Union countries found that around 41 per cent of roma children lived in households where someone had to go to bed hungry at least once in the month prior to the survey because they could not 252 afford to buy food. Based on national thresholds, families with four or more children – practically all of the roma households surveyed – were at risk of 253 poverty. The proportion of roma children living in households that fell below the national ‘at-risk-of-poverty’ line was twice as high as that of non-roma children 254 living nearby. Migrant households in europe are also especially vulnerable to poverty. in Spain, one in two children in migrant households lived in poverty in 2012.255 The naTionS SiGninG on To in Greece, The 2030 GoalS haVe Made a child poverty rates for migrant households increased by 35 per cent between 2008 and 2012, compared to 15 per cent for the general population.256 CoMMiTMenT To addreSS Child PoVerTY in all iTS diMenSionS. While the challenges are great, many of the solutions are at hand. an integrated approach that focuses on interventions in health, nutrition, water and sanitation, protection, and learning during the first years of children’s lives can set a firm foundation for their entire lifetime. Universal measurement of child poverty The nations signing on to the 2030 goals have made a commitment to address child poverty in all its dimensions. Given this commitment, they need consistently updated data on who is poor and how they are poor in order to monitor progress, identify gaps and guide policies and programmes – all in the interest of making sure that vulnerable children are not left behind. efforts to measure child poverty are not new. indeed, many countries have already taken steps to generate data on how many children are living in poverty, based on the international extreme-poverty threshold of US$1.90 a day, as well The STaTe of The World’S Children 2016 80
Children attending the Traiko as on national poverty lines. There are also well-established methodologies, Simeonov primary school, where mentioned previously, to capture the extent of multidimensional child poverty, and 90 per cent of students are Roma, these measurements can complement the monetary measurements. in Shumen, northern Bulgaria. Still, the number of countries that report child poverty figures is limited. a recent © UNICEF/UNI154479/Pirozzi internal analysis by UniCef found that more than one third of countries are not measuring child poverty, and around half of those that are measuring it are not 257 doing so routinely. ideally, all countries should report on the number of children living in poverty using both monetary and multidimensional measures. Multidimensional child poverty measures give a fuller picture of how children experience poverty. These data can be adapted and applied to each country’s economic and social context, informing the development of national approaches to poverty reduction. international financial institutions, development agencies, donors and regional bodies could be cooperating more effectively to raise standards and strengthen national statistical capacity in these countries. Such a course would bring the world one step closer to the goal of eradicating extreme poverty in general, and child poverty in particular. The role of cash transfers in reducing poverty and inequality reducing child poverty in all its dimensions is one of the world’s most important and urgent tasks, requiring concerted and sustained efforts to put children first and give them what they need to have a fair chance to survive and thrive. Because children experience poverty in multifaceted ways, it is critical not only to provide equitable services – including essential health care and quality The STaTe of The World’S Children 2016 81
Children and poverty: Breaking the vicious cycle >> The role of cash transfers in reducing poverty and inequality education – but also to make sure the most disadvantaged children have access to those services. Social protection mechanisms such as pensions, fee waivers, child support grants and cash transfers are an effective approach that can reduce vulnerability to poverty and deprivation, strengthen families’ capacity to care for their children and overcome barriers to accessing essential services. Cash transfers can work as a ‘safety net’ to keep the poorest, most vulnerable households out of destitution in all settings, including humanitarian emergencies. at the same time, they offer families a ladder out of poverty by boosting incomes, increasing school attendance, improving nutrition, encouraging the use of health services and providing job opportunities. By one estimate, social protection initiatives keep some 150 million people out of 258 poverty, and they make a positive impact on children’s lives across a range of indicators. results from many regions demonstrate direct impacts such as increased income and consumption, increased access to goods and services, greater social inclusion and reduced household stress. Because of their usually modest size, cash transfer programmes alone cannot directly lift most households above the monetary poverty threshold. But they can make a real difference in reducing the effects of poverty and bolstering Children in Supaul, a flood- families and economies. Cash transfers work by putting more money into the prone district in the state of hands of the poor, strengthening local markets and creating a stream of social Bihar, India. benefits that come with poverty reduction. as households spend the transfers they receive, their impact is multiplied in the local economy and the benefits © UNICEF/UNI130498/Singh transmitted to others in society. The STaTe of The World’S Children 2016 82
Cash transfer programmes can reduce inequality while contributing to economic growth, productivity and job creation. in Brazil, for example, Bolsa familia, one of the largest cash transfer programmes in the world, was paired with Beneficio de Prestação Continuada – a combination social pension and disability grant. Together, these programmes contributed to more than one quarter of the country’s 2.7 per cent fall in inequality as measured by the Gini index between 259 1995 and 2004. in Ukraine, meanwhile, child allowances contributed to an estimated 1 per cent decrease in inequality between 2001 and 2007. The allowances were designed to take into account the specific vulnerabilities affecting households with more 260 than one child, who faced the greatest risk of poverty. Cash transfer programmes also offer protection against shocks, helping households to weather downturns without having to sell off productive assets, take children out of school or cut vital spending on health and nutrition. Some programmes explicitly target families with children, but cash transfers need not be child oriented to benefit them. Some evidence has shown that cash transfers can also increase women’s role in making household spending decisions, allowing them more financial security and 261 enabling them to engage in income-generating activities. in conflict-affected countries, fragile states and humanitarian emergencies, cash grants may be among the most efficient and effective ways of reaching the 262 poorest households. one recent example is a programme that, each month, has assisted around 56,000 children from 15,000 vulnerable Syrian refugee families living in host communities in Jordan. Cash transfers have given the families the means to cover basic needs and expenses specific to children. of the 500 families who participated in a survey about the programme, 88 per CaSh TranSferS haVe Been cent reported using the cash grant to cover at least one child-specific expense. ShoWn To helP Children The majority said they spent it on fresh foods for children (65 per cent), school- related expenses (56 per cent) and medicines for children (53 per cent).263 STaY in SChool lonGer and adVanCe To hiGher leVelS of in Kenya, the hunger Safety net Programme provided cash transfers to poor edUCaTion. households in four arid and semi-arid counties. in spite of a severe drought, households receiving the grant were 10 per cent less likely than non-recipients to 264 fall into the poorest tenth of the population. Beyond its effects on poverty, the transfer programme was found to improve food security and enable households to spend more on health care. it also had a positive impact on classroom performance for children already in school. Cash transfers and access to essential services as some of these examples show, cash transfers address multiple deprivations and help children gain access to services that are critical to their well-being. for example, cash transfers for the most vulnerable households and children can be used to trigger eligibility for health coverage – an approach adopted by Ghana with its livelihood empowerment against Poverty (leaP) programme. a unique feature of leaP is that, in addition to small, bimonthly cash payments, it provides beneficiaries with free health care coverage through the national 265 health insurance Scheme. The STaTe of The World’S Children 2016 83
Children and poverty: Breaking the vicious cycle >> Expanding social protection – and looking ahead Cash transfers can also address some of the determinants of educational disadvantage, helping to break the link between poverty and school 266 drop-out rates. in Morocco, a cash transfer programme led to a significant 267 improvement in school participation. evidence shows that cash transfers 268 have increased demand for education and improved school enrolment and 269 attendance. in addition, cash transfers have been shown to help children stay in school longer and advance to higher levels of education.in Cambodia, an initiative providing scholarships to at-risk pupils from low-income households increased the average time they remained in school by more than half a grade.270 in Colombia, Ghana and Pakistan, cash transfers programmes have helped improve rates of transition to higher levels of education. in some cases, cash transfers and other social protection measures have had an impact on learning as well. for example, cash transfer programmes led to improved test scores for children in Burkina faso and modest improvements in Morocco.271 Meanwhile, school feeding programmes have been linked to increased learning and cognitive development. in Bangladesh, primary school students in a school meal programme showed a 15.7 per cent improvement in learning metrics, mostly in mathematics, compared with children who did not 272 participate in the programme. Cash transfers have also proven to have some impact on child marriage and child labour and on the educational disadvantages these practices entail. While addressing these child rights violations is a complex challenge that demands action in multiple sectors, cash transfers can play a role in alleviating some of the financial pressures that force children into work or marriage and out of 273 school. a cash transfer programme in Panama, for example, led to a nearly 16 per cent reduction in child labour among indigenous children aged 12 to 15 and to a nearly 8 per cent increase in elementary school enrolment in indigenous 274 areas. Pakistan’s female School Stipend Programme reduced girls’ labour- 275 force participation by as much as 5 per cent. in Bangladesh, a cash transfer programme was successful in encouraging girls to enrol, particularly in secondary school, and in delaying marriage. Expanding social protection – and looking ahead every country in the world has at least one social safety net programme in place, and specific child and family benefit programmes rooted in legislation exist in 108 countries. Yet these often cover only small groups of the population, and in 75 countries no such targeted programmes are available at all.276 expanding social protection is critical to achieving the 2030 goals. in fact, the goals include a specific target on implementing nationally appropriate social protection systems and measures to achieve substantial coverage of the poor and vulnerable by 2030. a universal approach to expanding social protection would not only increase coverage but would also reduce the chances of mistakenly excluding eligible households, create social solidarity and reduce the stigma that is sometimes The STaTe of The World’S Children 2016 84
Children stand near their family's associated with targeting. however, countries can realize social protection by house in the Muhamasheen area taking incremental approaches that work within their resource and capacity of Mathbah, in Sana'a, yemen. constraints – as well as their social and economic policy frameworks – towards the ultimate goal of universal coverage. © UNICEF/UN013965/Shamsan for rich countries, the immediate challenge is to repair and strengthen the A boy trying to earn money by safety nets and benefits that were eroded in the wake of the global financial weighing people in the street, in crisis. for many middle-income countries, the architecture of existing cash Sana’a, yemen. transfer programmes provides a basis for further expansion. Governments in low-income countries face starker choices. With limited budgets and high levels © UNICEF/UN018345/Altwaity of child poverty, there are tensions between targeted transfer approaches and universal approaches. These tensions have to be addressed on a case-by-case basis. in the end, however, social protection programmes are just one tool in the wider effort to address the underlying issue of child poverty. in adopting the SdGs, world leaders recognized the central importance of that issue. Goal 1 aims to effectively end extreme poverty by 2030 (Target 1.1) and to reduce by at least half the proportion of men, women and children living in poverty in all its dimensions under national definitions (Target 1.2). The goals also emphasize that no country is immune to the impact of poverty, underscoring the fact that ending child poverty is a universal challenge. Working towards the 2030 goals, governments will have to recognize and respond to the distinctive challenges of child poverty in all its dimensions and make explicit commitments to end it. failing to do so in this generation will transmit the human, social and economic costs to future generations. The STaTe of The World’S Children 2016 85
PERSPECTIVE: What are we waiting for? Sustainable societies begin with children By Kailash Satyarthi, nobel Peace Prize laureate and founder, Kailash Satyarthi Children's foundation in the foothills of the himalayas, many years ago, in September 2015, more than 200 world leaders i met a small, skinny child labourer. he asked me: came together to adopt a 15-year plan for sustainable “is the world so poor that it cannot give me a toy development. i applaud the United nations for and a book, instead of forcing me to take a gun or a incorporating the need to eliminate child labour, forced tool?” another time, a child-mother from the streets labour, modern slavery and human trafficking, as well of Colombia who had been trafficked, raped and as a strong emphasis on inclusive and equitable quality enslaved, asked me this: “i have never had a dream. education, into the Sustainable development Goals Can my child have one?” a Sudanese child, kidnapped (SdGs). for the first time, clear targets have been by an extremist militia and forced to kill his friends and set to end these evils, and the relationship between family, once asked me: “is this my fault?” them and sustainable growth has been recognized. My fellow activists and i had been calling for this for many Slavery did not end with abolition in the 19th century. years. even in modern times and developed countries, it still exists in its cruellest forms. Most recent data show Sustainable societies can only have a prosperous that there are still 150 million child labourers in the future when their children are safe, educated and world; that 59 million children of primary school age healthy. Put simply, ending child labour, slavery, are out of school; and that 15 million girls under 18 trafficking and violence against children is directly tied are forced into marriage each year. Millions of children to achieving most of the other development goals. live with a disability that makes them more likely to be marginalized or miss out on education. Together, we have framed a will for a better future. however, what matters most is the will in the words, Millions of undocumented immigrants and people on not the words in the will. the margins of society are trafficked and forced into domestic labour or the sex trade. in crisis-affected addressing the United nations SdG Summit in new areas, slavery is much more rampant, as children are York, i, on behalf of the most marginalized children, given guns instead of toys and girls are sometimes demanded action, not promises. We know progress is sold for less than a pack of cigarettes. Unfortunately, possible: Since the last development agenda, both the 37 million children living in crisis-affected countries are number of people living in extreme poverty and the out of primary or lower-secondary school. i have met number of primary-school-aged children out of school children toiling on cocoa farms in Côte d’ivoire, selling have been halved successfully. flowers in Colombia, sewing footballs in Pakistan, working in mica mines and brick kilns in india, and our generation can be the one that puts a complete living unimaginable horrors in nigeria. end to the evil of child slavery. We can provide an education for every last child. We have an opportunity all children deserve a fair and equal start in life. They to embrace peace, equality, inclusivity and sustainable deserve freedom and a childhood. They deserve development by ensuring freedom for all. comprehensive, well-rounded, quality education. These have to be viewed not just as basic rights but But we can only do so when governments, as a means towards a more inclusive and sustainable businesses, civil society and citizens unite, and when society. each carries out its role wilfully and effectively. We The STaTe of The World’S Children 2016 86
What are we waiting for? Sustainable societies begin with children need governments to make child-friendly policies and change if we channel our energies and our anger at invest adequately in education and young people. injustices in the right way. even a small spark can Governments can no longer ignore the economic dispel darkness in a room. and each of us represents arguments against child labour. increased child labour a small but critical spark if we act on the problems we leads to higher unemployment. Today, for the 150 see rather than just witness them. million children (5–14 years old) doing jobs meant for adults, there are 200 million unemployed adults. Together we can ensure that the commitments Through the right economic measures, governments for a sustainable world are kept and that slavery is should ensure decent living wages for parents so they relegated to the history books where it belongs. let can send their children to school. that be the legacy of our lives – our gift to the world. The benefits of education are known to contribute to economic growth and poverty alleviation. reports show that each dollar invested in quality education will return 15 times the amount in two decades. The rule of law should extend to every last child. Businesses must be more responsible and faith leaders must recognize that compassion for others is a central tenet for all faiths. it is the responsibility of each and every one of us: We must build the world of our dreams with compassion for our fellow man and woman, regardless of ethnicity, race, religion, nationality, politics or anything else. When we as citizens unite in holding governments, businesses and civil society accountable, anything will be possible. My colleagues and i have humbly done our part – drop by drop over the years. The result is that more than 85,000 children have been rescued from child labour and servitude and given back their childhood. it is not enough to extinguish the blaze represented by the millions of children who remain in slavery, but to those children and their families it has meant everything. We can be and must be the generation that extinguishes that blaze once and for all. We need to teach our bright, young, energetic and idealistic youth the value of compassion, so they don’t become disillusioned or turn to violence at a time when both they and the world seem more susceptible than ever. devli, an eight-year-old bonded labourer whom my colleagues and i once rescued from a stone quarry, perfectly captured the urgency upon which we must act. She asked me, “Why didn’t you come earlier?” her question is for all of us. What are we waiting A girl makes bricks at a factory in the Shahdra for? each one of us has the potential to bring about neighbourhood, north of Lahore, Pakistan. © UNICEF/UNI44028/Pirozzi The STaTe of The World’S Children 2016 87
PATHWAYS TO EqUITY The STaTe of The World’S Children 2016 88
ChaPTer 4 Pathways to equity Every child has the right to a fair chance – and every society has a stake in expanding opportunity, leaving no one behind. It’s the right thing to do, and the smart thing to do. And now is the time to chart our course towards a more equitable world. Fatuma, 10, lost both of her a defining shift in this still-new century is the growing global understanding of the parents to Ebola. She attends scope – and the cost – of an increasingly unequal world. This report has argued that, primary school in Freetown, left unaddressed, inequities in childhood and adolescence will continue to generate Sierra Leone. unequal outcomes for families around the world, fuelling intergenerational cycles of disadvantage that threaten the strength and stability of societies everywhere. © UNICEF/UN011612/Holt Current rates of progress are insufficient to interrupt those cycles and close gaps in equity by 2030 – the target year for reaching the Sustainable development Goals, which pledge to leave no one behind. if current trends continue until then, some regions and countries with growing populations and high levels of disadvantage, especially africa and asia, will have the same number of children out of school as there are today. almost 120 million children will suffer from stunting, undermining their physical and cognitive development, with potentially irreversible consequences. Conflicts and chronic crises caused by the effects of climate change will increase risks to children’s lives and futures, displacing more and more children and families, increasing vulnerability and deepening disadvantage. But as this report shows, and as growing evidence clearly indicates, inequity is neither inevitable nor insurmountable. With the right investments, at the right time, disadvantaged children can realize their rights to a better life. By reducing the inequities that violate their rights today, such investments can help these children lead more productive lives as adults and enable them to pass on more opportunities to their children, thus replacing intergenerational cycles of deprivation with sustainable cycles of opportunity. That is the promise – and the imperative – of equity. every child has the right to a fair chance, and all societies have a stake in expanding opportunity for their youngest members. drawing from the work of UniCef and partners, the five key areas that follow – information, integration, innovation, investment and involvement – represent broad, often overlapping, pathways to equity. They encompass operating principles and critical shifts that can help governments, development partners, civil society and communities shape policies and programmes with the potential to make that fair chance a reality for every child. The STaTe of The World’S Children 2016 89
Information Going beyond national averages to focus on the most excluded information – broadly encompassing data about who is being left behind and how programmes are reaching or failing to reach those in greatest need – is a first operating principle of equitable development. one of the most significant drawbacks in the global effort to achieve the Millennium development Goals (MdGs) was the fact that national averages showing overall gains towards certain goals sometimes masked persistent disparities, failing to reveal that the poorest were not always benefiting proportionately from overall progress. for example, the global target on safe drinking water was met five years ahead of schedule, even though gaps in access to safe sources of drinking water actually widened in some low-income countries. Without solid data on the status of populations at the subnational level, communities unreached by the advance of progress may remain unnoticed. improving the availability and quality of data about the children and families in greatest need is therefore critical, including by expanding efforts to measure child poverty in all of its dimensions. The Multiple indicator Cluster Surveys programme, pioneered by UniCef and conducted with partners, is helping to break down data on children by household wealth, geography, gender, ethnicity, language, religion, age and many other key factors. The more governments incorporate such disaggregated data into policy planning and public spending, the greater 1in 4 of the world’s school-aged children live in countries affected by crises The STaTe of The World’S Children 2016 90
the chances of making a difference in the lives of the most disadvantaged, vulnerable and marginalized children. information not only helps shape programmes around community needs, it also helps governments and their development partners change course when programmes are not as efficient as they could be in meeting those needs. f or example, M-Trac, an SMS-based disease surveillance and tracking system, provides real-time data, helping governments and development partners monitor stocks of essential medicines more efficiently. and in humanitarian emergencies and other critical situations, information can drive a more timely and targeted response, directing life-saving aid to where it is most needed. But in itself, information about disparities and other factors that contribute to inequity is not sufficient. inequities will persist without equity targets and tracking mechanisms to monitor the widening or narrowing of gaps. UniCef and some partners already use a new system called the Monitoring equity for results System (MoreS) to track the progress of joint efforts to overcome bottlenecks that stand between children and families and the services they need. MoreS identifies both barriers to supply – for instance, not enough community health centres or skilled birth attendants to serve the needs of poor communities – and barriers to demand – for instance, the inability of poor families to pay for medical care, or insufficient understanding of the urgent importance of post-natal care. equipped with such data, governments and development partners can target programmes to expand opportunity – for instance, through cash transfers to help families pay school fees, or public awareness campaigns about the importance of birth registration, which provides children with an official identity that can expand their access to services and shield them from exploitation throughout their childhoods. Governments can further accelerate progress towards the 2030 goals by establishing national equity targets to spotlight disparities, such as those affecting disadvantaged regions or ethnic groups. Governments can also adopt interim ‘stepping stone’ markers to measure progress towards achieving the overall equity targets – and thus towards achieving the SdGs’ mandate to leave no one behind. The data revolution can benefit the most disadvantaged and hardest to reach, but only if it is truly inclusive of those left behind and uncounted. among the more exciting and promising shifts in recent years is the way in which communities are collecting and sharing information about local needs and the degree to which they are unmet. for example, U-report, a real-time social messaging tool, is enabling young U-reporters to share important information with their governments about pressing issues in their communities and lives – from whether girls are able to go to school to where health interventions are needed to halt the spread of epidemics. decision makers are listening. in Uganda, Members of Parliament voluntarily signed up for U-report to find out what their youngest constituents have to say, and the system has helped strengthen immunization coverage there. in Zambia, it is raising awareness about hiV testing. With more than 2 million active users in 22 countries to date, U-report shows that momentum around citizen-driven data collection and information sharing is a growing trend. The STaTe of The World’S Children 2016 91
Integration Taking a multidimensional approach to tackling multiple deprivations that deny children a fair chance in life integration – in how we approach solutions and how we deliver interventions – is a critical path towards equitable development. The multiple threats to the survival and well-being of the most disadvantaged and vulnerable children are not neatly divided by sector. The enormous challenges that affect them – conflicts, climate change, extreme poverty and more – are all closely interconnected. The multiple deprivations that children suffer are also overlapping and all too often mutually reinforcing. So solutions must intersect as well. Consider the earliest days of a child’s life, a brief window of opportunity when brain development is at its peak. Whether children’s brains reach the potential that nature has given them depends on how they are nurtured – whether children receive proper nourishment and stimulation, whether they are protected from violence and prolonged adversity. early childhood development programmes must therefore be integrated, encompassing education, nutrition and protection. integrating interventions across these separate sectors is more effective than addressing them individually: Success in one area supports success in another. for example, the introduction of school feeding programmes to boost nutrition has been linked to increased learning and cognitive development. as noted earlier in this report, in Bangladesh, primary school students in a school meal programme showed a 15.7 per cent improvement in learning achievement, mostly 277 in mathematics. integrated strategies can also be more cost-effective, particularly where service providers share human resources278 – for example, using immunization campaigns in remote areas to deliver critical micronutrients and measure children for stunting. Most urgently for the hundreds of millions of children affected by conflict and chronic crises – including those caused by climate change – we need to break down the artificial barriers between development work and humanitarian action. no such distinction exists in the lives of the children these interventions are designed to help. a lack of development can intensify the impact of conflict and worsen or even help trigger natural disasters, such as flooding and mudslides. disasters and conflicts can interrupt, and sometimes roll back, years of development progress, risks that are now playing out in countries like the Central african republic, the Syrian arab republic and Yemen, with tremendous short- and long-term consequences. Conversely, strong development reduces the impact and perhaps even the likelihood of future crises. immediate humanitarian action can also provide pathways to ‘build back better’ and advance development. for example, following the 2015 earthquake in nepal, the government’s social assistance programmes provided a platform to disburse cash transfers to approximately 400,000 of the people most affected. from a humanitarian standpoint, this assistance supported the immediate needs of people whose lives had been torn apart. from a development perspective, it prevented those families from spending their assets to cope with the aftermath of the disaster and spurred the government to establish a new monitoring system to strengthen future social assistance efforts. The STaTe of The World’S Children 2016 92
Students whose education has Similarly, during the worst of the ebola crisis in West africa, UniCef and been disrupted by conflict attend partners not only built new community care centres to help care for ebola Curriculum B classes at the victims, but also worked to revitalize existing primary-health-care centres to Hasan Zaiat school in Aleppo, the treat those suffering from other ailments – an important investment in the Syrian Arab Republic. future. © UNICEF/UN018888/Al-Issa The SdGs explicitly recognize – as the MdGs did not – the inherent connections among economic development, social development, environmental protection and peacebuilding. We will not meet the global goals without an integrated approach to development and humanitarian action. not when millions of children are bearing the brunt of climate-related disasters and chronic crises and nearly 250 million are living in countries and areas affected by armed conflict. not when 24 million of the children in these places are out of school. not when these countries account for nearly two thirds of the world’s children who have 279 not been immunized with basic vaccines. and not when millions of children are on the move as families desperately flee their homes and embark on dangerous journeys that leave children more vulnerable and deepen deprivation. insisting on closer coordination among humanitarian and development organizations can help break down divisions between sectors. This includes joint planning, keeping humanitarian needs front and centre as we implement the SdGs, and integrating appeals for both humanitarian and development funding during specific crises. and it includes using more social protection tools like cash transfers in humanitarian emergencies to provide short-term support for families while strengthening social safety nets for the future. Taken together, these practical, cost-effective measures, focusing on countries in crisis, will not only support emergency response in the short term but also map out a path to expanded opportunity for the most vulnerable and excluded children throughout their lives. The STaTe of The World’S Children 2016 93
Innovation accelerating change for the most disadvantaged children by using new and different approaches to development for UniCef, innovation means doing our work in a different way that adds value to children’s lives. innovation is not a value in itself but, rather, a new approach to solving difficult problems. UniCef has a long history of supporting innovation for children. We have pioneered and collaborated on solutions such as the Mark ii handpump (to improve access to safe water) and ready-to-use therapeutic food (to treat severe A child receives ready-to-use acute malnutrition). and we found new ways of working with governments and therapeutic food as part of a other partners to increase global immunization rates of children under age 5, from package of services for the 20 per cent to 76 per cent, in a single decade (1980–1990). treatment of malnutrition, in The evolving challenges now facing the world’s children – from disease outbreaks Somalia. to the migrant and refugee crisis, to the situation of millions of out-of-school © UNICEF/UNI201564/Rich children – have one thing in common: the great speed at which they are disrupting young lives. Meeting these challenges means, yet again, reinventing our ways of A woman is photographed for working. it means being agile and adaptable in how we build solutions. it means the Rapid Family Tracing and looking towards new partnerships – including collaborations with companies that Reunification mobile phone might not be our traditional partners, and with young people themselves. application in the Nyarugusu refugee camp, in Kigoma Region, in an increasingly connected world, more and more people are accessing basic Burundi. information services. as a result, the global drive for new solutions is engaging more and more young people not only as beneficiaries of solutions but also as © UNICEF/UNI188792/Beechey problem-solvers in their own right. The STaTe of The World’S Children 2016 94
innovation in the development and humanitarian sectors is also about being open about failures as well as successes. it is about using technology to get information in new ways, at new speeds. in an emergency setting, social messaging tools now make it possible to get information from the affected populations in real time. for example, during the ebola epidemic in West africa, UniCef was able to talk with young people directly using the U-report system, our social messaging platform for communication between young people and decision makers. in liberia, UniCef and partners involved in the ebola response polled more than 43,000 people in a single day via text messages to find out about their needs, aggregate that information and take action accordingly. U-report is now available in 22 countries and has more than 2.1 million users. it is one of the many new tools that are dramatically changing the way problems come to light – and the way solutions are discovered. These tools add urgency to the work of governments and the rest of the international community. When we get information in real time, we have an obligation to respond. Technological innovations not only improve communication and collaboration, but they also provide new ways of gathering data. for instance, the Ugandan Bureau of Statistics is using the U-report survey tool to create micro surveys that the government can distribute via mobile phone. Such digital tools complement paper- based surveys, which often reflect information obtained several months or even years in the past. Using real-time data gives governments and their development partners a quicker sense of critical issues as they arise and enables them to direct their responses strategically. But innovative solutions are not only about technology; they also demonstrate how technology can support human behaviour as a key driver of success in solving complex, systemic problems in 2016 and beyond. for UniCef and partners, innovation means working with young people in new ways. in Blantyre, Malawi, our innovation lab works with the Polytechnic institute and primary and secondary schoolchildren who are able to design solutions to their own problems. These young people are using modern design techniques and concepts to figure out how to best shape their world – including ways to create a school environment that is more conducive to learning. in this relationship, UniCef functions as a broker and a convener, not pushing ideas but working with young people and institutional partners to help them take good ideas to scale. This approach points to a new way of doing business, with innovation opening up opportunities for new types of partnerships in areas such as personal data. for example, in collaboration with arM, a leading digital technology company, UniCef recently launched the Wearables for Good Challenge to accelerate the development of new wearable technologies that can help save and improve children’s lives. More than 250 teams from around the world applied. Most of them consisted of young people who believed they could work together on open- source technologies providing mothers in rural environments with the information they need to keep themselves and their children safe. innovating for equity is also about how to fund this work and make it real. UniCef's innovation fund, launched in 2015, is a novel instrument enabling us to support local entrepreneurs and designers in a very concrete sense. By creating a The STaTe of The World’S Children 2016 95
Pathways to equity >> Innovation hybrid with elements from the worlds of both venture finance and development, we are now in a position to build a network of companies working on open- source solutions for children who have been left behind. The innovation fund pushes UniCef to work with partners – including innovation labs, incubators and accelerators – in new ways. it allows for innovative ideas to more quickly permeate UniCef’s global system, and for us to test, evaluate and adapt them to the needs of the world's most vulnerable children. in the end, our goal is to create real change for children. There is evidence that adopting new ways of doing business can help us do just that. in Uganda, for instance, unpublished preliminary data indicate a substantial increase in national birth registration levels, stemming from policy change, legislation and community outreach – and the application of mobile technology. and in liberia, more than 13,000 U-reporters responded almost instantly to a question about sexual violence in schools, with 86 per cent saying it was a serious problem. They also provided ideas on how to address the issue. The government subsequently used their feedback to shape local and national policy changes and interventions. U-Reporter Michelle Abika (centre) helps raise community around the world, innovation is making a difference. Building up real-time, multi- awareness about Ebola directional information flows, creating communities of open-source change agents prevention, in Monrovia, Liberia. and funding them to take innovations to scale: These approaches and more have the potential to reduce inequities by accelerating results for the poorest and most © NICEF/UNI178336/Naftalin disadvantaged children. The STaTe of The World’S Children 2016 96
Investment Using equity-focused budgeting and innovative finance to reach the most excluded children and families as this report has argued, investing in the most disadvantaged children and communities is more than a moral imperative. it is a smart, strategic investment that helps achieve results more effectively and more cost-effectively, in turn helping to break intergenerational cycles of deprivation and strengthening societies. The reverse is also true: When we fail to invest in the most marginalized children and families, we also fail their societies. disparities in access to critical 280 services and support cost hundreds of billions of dollars globally every year. expanding opportunity for the most disadvantaged children should be a first priority in budget design and public spending. a country’s budget reflects how well political commitments are being translated into direct actions to benefit the most excluded children. Such spending plays a crucial role in funding the systems that connect disadvantaged children and families with essential services and support, including social safety nets that protect families during crises and other shocks. Prioritizing children in national budgets is not enough. all governments – whether they are in low-, middle- or high-income countries – also need to analyse the impact of their budget decisions on the most vulnerable children. in some cases, public spending is skewed in favour of the most, not the least, advantaged children. Perhaps the most glaring illustration of this injustice is the gap in per capita spending on education. in some low-income countries, nearly half of all public spending on education is dedicated to the best-educated students, representing only 10 per cent of the total student population. Similarly, in many countries, students growing up in the wealthiest households have access to up to 18 times more public educational resources, including textbooks and other materials, than 281 students from the poorest households. But better coordination and planning between ministries of finance and development can help national budgets better serve the needs of the most disadvantaged. So can tracking expenditures more closely to understand whether the programmes they pay for are reaching the hardest to reach. Better monitoring of the impact of public spending is critical to achieving virtually all of a government’s priorities, and achieving equity for children is no exception. Several countries have mechanisms in place to provide a foundation for monitoring the impact of public spending on child poverty. Bangladesh, for example, has developed a child-focused budgeting framework that is used by the Ministry of finance to review potential impacts on children. in South africa, the Children’s institute is monitoring budgetary allocations aimed at implementing the provisions of the country’s Children’s act of 2005. at the same time, governments can increase the return on their investments by adopting more integrated planning and budget approaches, as well as more integrated programme delivery across sectors, as this chapter has already discussed. in the midst of funding shortfalls and increasing competition for official development assistance and humanitarian aid, low- and middle-income countries and their development partners are finding new ways of filling gaps in funding and securing more predictable and diversified funding sources. While targeted, short-term investments can often break bottlenecks that prevent children and The STaTe of The World’S Children 2016 97
Pathways to equity >> Investment families from accessing critical services and support, those achievements cannot be sustained over time without more sustainable financing. Today, new partnerships are showing how public and private funding can be mobilized and targeted directly to the most disadvantaged – from cash grants for poor families so they can afford health care and education for their children, to financing for programmes that train front-line and community health workers, to support for expanded education programming in ethnic minority and indigenous communities. Some of the most promising of these new partnerships are finding new ways to finance the development and provision of critical supplies such as vaccines, insecticide-treated mosquito nets and nutritional supplements to the most excluded children and communities. for instance, the Power of nutrition partnership aims to raise US$1 billion for nutrition using an innovative matching mechanism that multiplies every dollar in private funding up to six times with new financing secured from other investors. Similarly, UniTlife uses micro levies from extractive industries to increase resources for the fight against malnutrition in sub-Saharan africa; for example, the republic of the Congo will contribute the equivalent of US$0.10 per barrel of oil sold by its national oil company. and UniTaid, a global health initiative to combat hiV/aidS, tuberculosis and malaria, raised more than half its funds over the past five years through levies on air travel. among the most successful examples of such an innovative partnership is GaVi, the Vaccine alliance, which helps shape markets and make vaccines more affordable for developing countries. GaVi has partnered with the World Bank, the World health organization, the Bill and Melinda Gates foundation and UniCef to speed up the development and availability of vaccines to prevent pneumococcal disease, one of the leading causes of mortality in children under age 5. The need for more predictable funding and sustained investment is of more urgent importance when it comes to humanitarian emergencies. humanitarian needs have grown exponentially as conflicts have become more protracted and crises both more frequent and more intense. With funding shortfalls growing, donors, governments and international organizations are exploring new ways to fund humanitarian action. investing in emergency-preparedness before emergencies happen improves the ability of governments and international organizations to respond to them – with high returns on investment. Prepositioning supplies in regions prone to droughts and floods and conducting training and simulations in-country can decrease the need to surge staff in emergencies, reduce procurement and transportation costs, speed up response time and even cut carbon dioxide emissions. Similarly, investing in improving local health systems and other critical infrastructure not only strengthens development, but also reduces the impact and the cost of responding to crises. a joint research initiative by the World food Programme and UniCef, supported by the United Kingdom department for international development, calculated that investment for humanitarian preparedness in high-risk contexts yields an average financial return of 200 per cent – meaning that every US$1 spent on preparing is 282 worth an average US$2 needed in the event of an emergency. Making resources work best for the most disadvantaged children – by securing more equitable investment – takes on ever increasing importance in the context of the Sustainable development Goals. By encouraging governments to leave no one behind, the new global goals require deliberate shifts in policy, budget design and public spending to benefit those in greatest need. The STaTe of The World’S Children 2016 98
Involvement achieving equity for children is everybody’s business By definition, equitable development is inclusive development. Traditional, top-down ways of promoting development – a vertical system led almost entirely by governments and international agencies – are beginning to shift. development is becoming more horizontal, crossing sectors, geographies and age groups, and transcending traditional barriers to participation. Greater cooperation, coordination and collaboration among low- and middle-income countries is creating a robust exchange of resources, technology and knowledge to tackle common challenges. Social media and digital technology are organizing, increasing and sustaining public engagement more quickly and effectively, as groups share information, broaden their memberships and multiply the number of partners dedicated to the same causes. These new opportunities and channels are giving citizens a way to raise their voices about urgent issues affecting their lives. They are providing governments with valuable insights into the lives and needs of those who have been left behind and uncounted. and, significantly, they are fuelling a new era of involvement and public engagement – ranging from local campaigns to broad movements that call for change and give people a powerful new way to demand accountability for the promises their leaders have made. These loosely organized efforts can be local, national, regional or global – or cross the lines among them. in india, the i Paid a Bribe movement started out as a website for ordinary citizens to report instances of government corruption in their own lives, but it rapidly grew into a movement to combat government corruption in india and beyond. in nigeria, the #bringbackourgirls campaign – which has achieved global reach – began with a single tweet by a lawyer in abuja protesting the abduction of hundreds of schoolgirls by the armed group Boko haram. As part of the Scaling Up Nutrition movement, women attend a nutrition demonstration in Burkina Faso. © UNICEF/UNI189376/Hubbard The STaTe of The World’S Children 2016 99
Pathways to equity >> Involvement Mohammad Abdullah-Shariff, in the United States, the ice Bucket Challenge was started in 2014 by a group of his wife, Shirin Aziz-Amah, and college students after a friend was diagnosed with amyotrophic lateral sclerosis their five children. After fleeing (alS), an incurable degenerative disorder. Their online challenge to their friends to Iraq, they received help from either dump a bucket of ice on their heads within 24 hours and challenge others volunteers, near the village of to do the same, or make a contribution to the alS association. it raised US$115 283 Skala Eressos, Lesbos, Greece. million to date and engaged millions of people in finding a cure. At right, the family, at the Moria reception centre for refugees and Some movements are never meant to ‘go viral’ or to transform a national or local migrants. issue into a global call for action. But they can still have a tremendous impact on people’s lives. for example, a movement to end open defecation in nepal mobilized © UNICEF/UNI197504/Gilbertson vII both citizens and civic authorities in some of the poorest parts of the country and, Photo in a short time, resulted in 27 districts becoming open-defecation–free. Movements can also be a powerful pillar of support for government efforts to benefit the most disadvantaged children. for example, the Scaling Up nutrition (SUn) movement has succeeded in making the prevention of undernutrition a growing global priority – a success it owes to a powerful combination of government commitment and resources, supported by networks of activists and experts around the world using technology to draw attention to the scourge of stunting and organize for change. Whatever form they take, movements require a different way of working and a new kind of leadership. True movements are led from within, not solely from the offices of decision makers in national governments or the United nations. But governments, international organizations and civil society should see this as an opportunity to work together with communities to address common challenges, such as protecting the environment, ending extreme poverty, promoting women’s rights and, fundamentally, expanding opportunity so that the most disadvantaged children can realize their right to a fair chance in life. 100 The STaTe of The World’S Children 2016
equity for every child information and data help us identify the children and communities being left behind and monitor the effectiveness of our efforts to reach them. integration across sectors addresses the overlapping deprivations and challenges children face. innovation spurs new solutions to old problems, helping children and communities meet the challenges of a changing world. investment, approached equitably, fuels more sustainable progress for the most disadvantaged. involvement by communities, including by children and young people, is changing the way we set priorities and take action. all are pathways to building a more equitable world where every child has a fair chance for a better future. fulfilling the promise of equity is possible. inequalities in opportunity for children can be drastically reduced within a generation. as the world embarks on an ambitious new course of international development, the pledge to leave no one behind must become more than a slogan. Providing a fair chance for every child must be an operating principle for us all. achieving equity for children is a question of priorities, recognizing both the moral and strategic importance of investing in those in greatest need. it is a practical challenge, overcoming barriers and bottlenecks that keep children from the support they need and block their access to critical opportunities. it is a matter of political will, translating commitment into action through equity- focused policies, programmes and public spending to improve the lives of the most disadvantaged. it is an investment, shifting how governments and donors finance development to better serve the most excluded. it is a broader commitment, putting an end to conflict and violence that target children and following through on pledges to address the effects of climate change. finally, it is a call to action for all people to engage in building a more equitable world, knowing that a sustainable future – and our shared destiny – depend on it. The STaTe of The World’S Children 2016 101
ENDNOTES 1. United Nations Children’s Fund, Narrowing 25. United Nations Children’s Fund, Unless We 47. Ibid. p. 4. the Gaps to Meet the Goals, UNICEF, New Act Now: The impact of climate change on 48. United Nations Children’s Fund, A Profile of York, September 2010. children, UNICEF, New York, November 2015, Child Marriage in Africa, UNICEF, New York, 2. United Nations Inter-agency Group for Child p. 8. 2015. Mortality Estimation, Levels & Trends in Child 26. Ibid. 49. World Health Organization, ‘Adolescent Mortality – Report 2015, UNICEF, New York, 27. World Health Organization, Preventing pregnancy’, Fact Sheet No. 364, WHO, September 2015, p. 3 (hereafter referred to as Diarrhoea through Better Water, Sanitation Geneva, Updated September 2014. ‘UN IGME 2015’). and Hygiene: Exposures and impacts in low- 50. United Nations Children’s Fund, Committing 3. Ibid. and middle-income countries, WHO, Geneva, to Child Survival: A Promise Renewed − 4. United Nations Children’s Fund, Progress for December 2014. Progress report 2014, UNICEF, New York, Children: Beyond averages – learning from 28. Ezeh, Osita K., et al., ‘The Impact of Water and September 2014, p. 34. the MDGs, No. 11, UNICEF, New York, Sanitation on Childhood Mortality in Nigeria: 51. DeFranco, Emily A., Shelley Ehrlich and June 2015, pp. 22, 26. Evidence from Demographic and Health Louis J. Muglia, ‘Influence of interpregnancy 5. The projections in this paragraph were Surveys, 2003–2013’, International Journal of interval on birth timing’, British Journal of calculated for UNICEF by the Overseas Environmental Research and Public Health, vol. Obstetrics & Gynaecology, vol. 121, no. 13, Development Institute, 2015. 11, no. 9, September 2014, pp. 9256−9272. December 2014, pp. 1633–1641. 6. United Nations, Transforming our world: the 29. Nepal National Sanitation and Hygiene 52. United Nations, Department of Economic and 2030 Agenda for Sustainable Development, Coordination Committee, ‘Nepal Country Social Affairs, ‘World Contraceptive Patterns General Assembly Resolution A/RES/70/1, Paper on Sixth South Asian Conference on 2015’, United Nations, New York, 2015. paragraph 4, United Nations, New York, Sanitation (SACOSAN-VI)’, Dhaka, January 53. United Nations Population Fund, Adding It Up: 25 September 2015. 2016, p. 17. The costs and benefits of investing in sexual 7. United Nations Office for the Coordination 30. United Nations Children’s Fund, Annual and reproductive health, UNFPA, 2014, p. 4. of Humanitarian Affairs, Global Humanitarian Results Report 2014: Water, sanitation and 54. World Health Organization, Every Newborn: Overview 2016, United Nations OCHA, hygiene, UNICEF, New York, June 2015, p. 3. An action plan to end preventable deaths, New York 2015, p. 5. 31. UN IGME 2015. WHO, Geneva, June 2014, p. 17. 8. United Nations High Commissioner for 32. APR 2015, p. 19. 55. UNICEF Global databases 2016. Refugees, UNHCR Mid-Year Trends 2015, 33. World Health Organization, United Nations 56. United Nations Children’s Fund, The State of UNHCR, Geneva, 2015, p. 3. Children’s Fund, United Nations Population the World’s Children 2016: A fair chance for 9. United Nations Office for the Coordination Fund and the World Bank, Trends in Maternal every child, Table 13, New York, 2016. of Humanitarian Affairs, Global Humanitarian Mortality: 1990 to 2015 − Estimates by WHO, 57. United Nations Children’s Fund, Progress for Overview 2016, United Nations OCHA, UNICEF, UNFPA, World Bank Group and the Children − Beyond Averages: Learning from New York, December 2015, p. 3. United Nations Population Division, WHO, the MDGs, No. 11, UNICEF, New York, 10. United Nations Children’s Fund, Humanitarian Geneva, November 2015. June 2015, p. 2 Action for Children 2016 – Overview, UNICEF, 34. Victora, Cesar G., et al., ‘Countdown to 2015: 58. UNICEF Global databases 2016. New York, January 2016, pp. 3, 6–7. A decade of tracking progress for maternal, 59. Bangladesh DHS 2014; Pakistan DHS 11. United Nations Children’s Fund, Unless We newborn, and child survival’, The Lancet, 2012–2013; Eritrean Population and Health Act Now: The impact of climate change on October 2015, pp. 1–2. Survey 2010. children, UNICEF, New York, November 2015. 35. You, Danzhen, et al., ‘Global, Regional, 60. MDG survey 2012–2013. 12. World Health Organization, Quantitative Risk and National Levels and Trends in Under-5 61. Central Statistical Agency (Ethiopia) and ICF Assessment of the Effects of Climate Change Mortality between 1990 and 2015, with International, 2012; Ethiopia Demographic and on Selected Causes of Death, 2030s and Scenario-Based Projections to 2030: A Health Survey 2011, Addis Ababa, Ethiopia, and 2050s, WHO, Geneva, 2014. systematic analysis by the UN Inter-agency Calverton, Maryland, USA; Central Statistical 13. Grant, James P., The State of the World’s Group for Child Mortality Estimation’, The Agency and ICF International, p. 143. Children 1980–81, UNICEF, New York, n.d., Lancet, vol. 386, no. 10010, pp. 2275–2286, 62. UNICEF Regional Office for CEE/CIS, p. 6. December 2015. ‘Realizing the Rights of Roma Children and 14. UN IGME 2015. 36. Ibid. Women in Bosnia and Herzegovina, the 15. World Health Organization, United Nations 37. United Nations Children’s Fund, Levels and former Yugoslav Republic of Macedonia, and Children’s Fund, United Nations Population Trends in Child Mortality, UNICEF, New York, Serbia: Summary analysis of key findings Fund and the World Bank, Trends in Maternal 2015, pp. 20, 26. from MICS surveys in Roma settlements in Mortality: 1990 to 2015 − Estimates by WHO, 38. Wang, Yanping, et al., ‘Under-5 mortality the three countries’, UNICEF Regional Office UNICEF, UNFPA, World Bank Group and the in 2851 Chinese Counties, 1996–2012: A for CEE/CIS, issue 2, 2014. United Nations Population Division, WHO, subnational assessment of achieving MDG 4 63. Mathews, T. J., Marian F. MacDorman and Geneva, November 2015. goals in China’, The Lancet, vol. 387, Marie E. Thoma, ‘Infant Mortality Statistics 16. United Nations Children’s Fund, Committing no. 10015, January 2016, pp. 273−283. From the 2013 Period: Linked birth/infant to Child Survival: A Promise Renewed − 39. APR 2015, p. 9. death data set’, Division of Vital Statistics, Progress report 2015, UNICEF, New York, 40. Bangladesh (DHS 2014), Indonesia (DHS National Vital Statistics Reports, vol. 64, no. 9, September 2015 (hereafter referred to as 2012), India (DHS 2005–2006), Philippines August 2015, pp. 3–4. ‘APR 2015’), p. 35. (DHS 2013). 64. Ibid. p. 6. 17. United Nations Children’s Fund, Narrowing 41. Lawn, Joy E., et al., ‘Every Newborn: 65. APR 2015, p. 12. the Gaps to Meet the Goals, UNICEF, Progress, priorities, and potential beyond 66. Victora, Cesar G., et al., ‘Breastfeeding in the New York, September 2010. survival’, The Lancet, vol. 384, no. 9938, 21st Century: Epidemiology, mechanisms, 18. APR 2015, p. 35. July 2014, pp. 189−205. and lifelong effect’, The Lancet, vol. 387, 19. APR 2015, pp. 28, 29. 42. UNICEF global databases, 2016. no. 10017, pp. 475−490, January 2016. 20. The World Bank, World Development Report: 43. United Nations Children’s Fund, Progress for 67. John Hopkins University, the Office of the Conflict, security, and development, Children: Beyond Averages – Learning from UN Special Envoy for the health-MDGs, the The World Bank, Washington, D.C., 2011, p. 62. the MDGs, No. 11, UNICEF, New York, World Bank, Partners in Health, Last Mile 21. APR 2015, p. 32. June 2015. Health, the Clinton Foundation, ALMA, 22. UN IGME 2015. 44. APR 2015. the Governments of Ethiopia and Liberia, 23. United Nations Children’s Fund, The State 45. United Nations Educational, Scientific and Strengthening Primary Health Care through of the World’s Children 2012: Children Cultural Organization, EFA Global Monitoring Community Health Workers: Investment case in an urban world, UNICEF, New York, Report 2013/14 − Teaching and Learning: and financing recommendations, New York, February 2012. Achieving quality for all, UNESCO, Paris, July 2015. 24. Save the Children, A Devastating Toll: The pp. 158–159. 68. Ibid. p. 14. impact of three years of war on the health of 46. United Nations Children’s Fund, Ending Child 69. Doherty, Tanya, et al, ‘Assessment of Malawi’s Syria’s children, Save the Children, London, Marriage: Progress and prospects, UNICEF, Success in Child Mortality Reduction through March 2014, p. iv. New York, 2014, p. 6. the Lens of the Catalytic Initiative Integrated 102 THE STATE OF THE WORLD’S CHILDREN 2016
Health Systems Strengthening Programme: 94. United Nations, The Global Strategy For 111. Ibid. Retrospective evaluation’, Journal of Global Women’s, Children’s and Adolescents’ Health 112. The Royal Institute of International Affairs, Health, vol. 5, no. 2, November 2015. (2016–2030): Survive, thrive, transform, Every Shared Responsibilities for Health: A coherent 70. APR 2015, p. 39. Woman Every Child, United Nations, New global framework for health financing, Final 71. World Health Organization, World Malaria York, 2015, p. 9. Report of the Centre on Global Health Report 2015, WHO, December 2015. 95. Ozawa, Sachiko, et al., ‘Return On Investment Security Working Group on Health Financing, 72. World Health Organization, ‘Measles’, Fact From Childhood Immunization In Low- And Chatham House, London, May 2014. Sheet WHO/286, WHO, Geneva, Updated Middle-Income Countries, 2011–20’, Health 113. Martin, Roma, et al., ‘Addressing Inequality in March 2016. Affairs, vol. 35, no. 2, pp. 199–207, South Asia’, South Asia Development Forum, 73. Email communication from UNICEF Malawi, February 2016. World Bank Group, Washington, D.C., 2015. 23 March 2016. 96. Ibid. 114. Greenhill, Romilly, et al., Financing the Future: 74. UNICEF projection, based on UN IGME 2015, 97. African Union Commission, NEPAD Planning How international public finance should fund p. 6. and Coordinating Agency, UN Economic a global social compact to eradicate poverty, 75. UNICEF projection, based on APR 2015, Commission for Africa, and UN World Overseas Development Institute, London, pp. 61–64. Food Programme, The Cost of Hunger in April 2015. 76. UNICEF projection, based on APR 2015, Africa: Social and economic impact of child 115. Save the Children, The Rockefeller Foundation, p. 64. undernutrition in Egypt, Ethiopia, Swaziland UNICEF and the World Health Organization, 77. UNICEF analysis based on UN IGME 2015. and Uganda − Abridged Report, UNECA, Universal Health Coverage: A commitment 78. UNICEF projection, based on APR 2015, Addis Ababa, 2014, p. 4. to close the gap, Save the Children Fund, p. 63. 98. Rollins, Nigel C., et al., ‘Why Invest, and London, September 2013, p. 39. 79. Calculation based on APR 2015, p. 63: What It Will Take to Improve Breastfeeding 116. Lindelow, Magnus, and Edson C. Araujo, Between 2016 and 2030, 2.1 billion children Practices?’, The Lancet, vol. 387, no. 10017, Brazil − Universal Health Coverage for will be born around the world and pp. 491–504, January 2016. ‘Inclusive and Sustainable Development: sub-Saharan Africa will see 620 million births. 99. Stenberg, Karin, et al., ‘Advancing Social Country summary report’, Working Paper 80. UNICEF projection based on APR 2015, and Economic Development by Investing in 91214, The World Bank Group, Washington, p. 63. Women's and Children's Health: A new global D.C., September 2014. 81. United Nations, Department of Economic Investment framework, The Lancet, vol. 383, 117. Health Insurance System Research Office, and Social Affairs, Population Division, World no. 9925, pp. 1333–1354, April 2014. Thailand’s Universal Coverage Scheme: Population Prospects: The 2015 revision, 100. Chopra, Mickey, et al., ‘Ending of Preventable Achievements and challenges − An United Nations, New York, 2015. Deaths from Pneumonia and Diarrhoea: An Independent Assessment of the First 10 82. Alkema, Leontine, et al., ‘Global, Regional, achievable goal’, The Lancet, vol. 381, Years (2001–2010): Synthesis report, Health and National Levels and Trends in Maternal no. 9876, April–May 2013, pp. 1499–1506. Insurance System Research Office, Mortality between 1990 and 2015, with 101. Black, Robert E., et al., ‘Maternal and Child May 2012, pp. 11,19. Scenario-based Projections: A systematic Nutrition: Building momentum for impact, 118. Tangcharoensathien, Viroj, et al., ‘Promoting analysis by the UN Maternal Mortality The Lancet, vol. 382, no. 9890, August 2013. Universal Financial Protection: How the Thai Estimation Inter-Agency Group’, 102. World Health Organization, ‘Achieving the universal coverage scheme was designed to The Lancet, vol. 387, no. 10017, January 2016, Health-Related MDGs. It Takes a Workforce!’, ensure equity’, Health Research Policy and p. 10; World Health Organization, United WHO, Geneva, February 2016. Systems, vol. 11, no. 25, August 2013, p. 12. Nations Children’s Fund, United Nations 103. Campbell, Jim, et al., ‘A Universal Truth: 119. Makaka, Andrew, Sarah Breen and Agnes Population Fund and the World Bank, No health without a workforce − Forum Binagwaho, ‘Universal Health Coverage in Trends in Maternal Mortality: 1990 to 2015 Report’ (Third Global Forum on Human Rwanda: A report of innovations to increase − Estimates by WHO, UNICEF, UNFPA, Resources for Health, Recife, Brazil), Global enrolment in community-based health World Bank Group and the United Nations Health Workforce Alliance and World Health insurance’, The Lancet, vol. 380, Special Population Division, WHO, Geneva, November Organization, Geneva, 2013. Issue, S7, October 2012. 2015, p. 54. 104. John Hopkins University, the Office of the UN 120. GAVI, The Vaccine Alliance, ‘Immunisation 83. Liu, Li, et al., ‘Global, regional, and national Special Envoy for the health-MDGs, the World Leaders Call for Increased Political Support for causes of child mortality in 2000–13, with Bank, Partners in Health, Last Mile Health, the Immunisation in Pakistan’, GAVI, The Vaccine projections to inform post-2015 priorities: an Clinton Foundation, ALMA, the Governments Alliance Secretariat, Geneva, February 2015. updated systematic analysis’, The Lancet, of Ethiopia and Liberia, Strengthening Primary 121. Behrman, Jere. R., Yingmei Cheng and Petra vol. 385, no. 9966, October 2014. Health Care through Community Health E. Todd, ‘Evaluating Preschool Programs 84. UNICEF analysis based on UN IGME 2015. Workers: Investment case and financing When Length of Exposure to the Program 85. APR 2015, pp. 62−70. recommendations, New York, July 2015. Varies: A nonparametric approach’, Review 86. APR 2015, p. 70. 105. World Health Statistics 2015, WHO, p. 116. of Economics and Statistics, vol. 86, no. 1, 87. APR 2015, p. 62. 106. Boozary, Andrew S., et al., ‘The Ebola February 2004, pp. 108−132. 88. Mikkelsen, Lene, et al., ‘A Global Assessment Outbreak, Fragile Health Systems, and Quality 122. Gertler, Paul, et al., ‘Labor Market Returns of Civil Registration and Vital Statistics as a Cure’, The Journal of the American to Early Childhood Stimulation: A 20-year Systems: Monitoring data quality and Medical Association, vol. 312, no. 18, follow up to an experimental intervention in progress’, The Lancet, vol. 386, no. 10001, pp. 1859–1860, November 2014. Jamaica’, Policy Research Working Paper October 2015, pp. 1395–1406. 107. Statistics Indonesia (Badan Pusat Statistik— no. 6529, World Bank, Washington D.C., 89. United Nations Children’s Fund, Every Child’s BPS), National Population and Family Planning July 2013, p. 2. Birth Right: Inequities and trends in birth Board (BKKBN), and Kementerian Kesehatan 123. Heckman, James J., ‘The Economics of registration, UNICEF, New York, 2013. (Kemenkes–MOH), and ICF International. Inequality: The value of early childhood education’, 90. World Health Organization, ‘Working 2013. Indonesia Demographic and Health American Educator, Spring 2011, p. 32. Group on Accountability for Results: Final Survey 2012. Jakarta, Indonesia: BPS, 124. United Nations Educational, Scientific and Paper’, Commission on Information and BKKBN, Kemenkes, and ICF International. Cultural Organization, EFA Global Monitoring Accountability for Women’s and Children’s 108. Liberia Health System Assessment, 2015, p. 28. Report and UNESCO Institute for Statistics, ‘A Health, WHO, May 2011. 109. ‘What Steps Countries Are Taking to Growing Number of Children and Adolescents 91. World Bank/WHO, Global Civil Registration Implement Pro-Poor Universal Health Are Out of School as Aid Fails to Meet and Vital Statistics Scaling up Investment Plan Coverage? – A background document the Mark’, Policy Paper 22, Fact Sheet 31, 2015–2024, World Bank/WHO, May 2014. prepared for The Bellagio Workshop on UNESCO and UIS, Paris and Montreal, 92. Stenberg, Karin, et al., ‘Advancing Social Pro-Poor Universal Health Coverage’, Evans, July 2015. and Economic Development by Investing in David, Naomi Beyeler and Alix Beith, 125. United Nations Children’s Fund, Early Women’s and Children’s Health: A new Global July 2015, p. 11. Childhood Development: A statistical Investment Framework’, The Lancet, vol. 383, 110. World Health Organization, The World Health snapshot – Building better brains and no. 9925, pp. 1333–1354, April 2014. Report − Health Systems Financing: The path sustainable outcomes for children, UNICEF, 93. Ibid. to universal coverage, WHO, Geneva, 2010. New York, September 2014, p. 7. THE STATE OF THE WORLD’S CHILDREN 2016 103
126. United Nations Educational, Scientific and Sustainable Outcomes for Children, UNICEF, Cultural Organization Institute for Statistics, Cultural Organization, EFA Global Monitoring New York, 23 September 2014, p. 7; and EFA Global Monitoring Report 2012: Youth and Report and UNESCO Institute for Statistics, ‘A UNICEF global databases, 2014, based on skills − Putting education to work, UNESCO, Growing Number of Children and Adolescents MICS and DHS, 2009–2012. Paris, March 2012, p. 16. Are Out of School as Aid Fails to Meet the 144. United Nations Children’s Fund, Early 163. Nicolai, Susan, et al., Education Cannot Mark’, Policy Paper 22, Fact Sheet 31, UNESCO Childhood Development: A statistical Wait: Proposing a fund for education in and UIS, Paris and Montreal, July 2015. snapshot – Building better brains and emergencies, Overseas Development 127. Ibid., p. 4. sustainable outcomes for children, UNICEF, Institute, London, May 2016, p. 7. 128. A UNICEF projection based on 2013 New York, 23 September 2014, p. 7. 164. United Nations Educational, Scientific and enrolment data from UNESCO Institute for 145. United Nations Children’s Fund, Progress for Cultural Organization, EFA Global Monitoring Statistics; United Nations Department of Children: Beyond Averages − Learning from Report, ‘Humanitarian Aid for Education: Why Economic and Social Affairs, World Population the MDGs, No. 11, UNICEF, New York, it matters and why more is needed’, Policy Prospects: The 2015 revision, UN DESA, June 2015, p. 53. Paper 21, UNESCO, Paris, June 2015, p. 3. Population Division, New York, 2015. 146. Rose, Pauline, and Benjamin Alcott, ‘How 165. United Nations Children’s Fund Regional 129. United Nations Educational, Scientific and Can Education Systems Become Equitable Office for the Middle East and North Africa, Cultural Organization, EFA Global Monitoring by 2030?’, DFID think pieces – Learning Education under Fire: How conflict in the Report, ‘How Long Will it Take to Achieve and equity, United Kingdom Department for Middle East is depriving children of their Universal Primary and Secondary Education?’, International Development, London, August schooling, UNICEF, Amman, September Technical background note for the Framework 2015, pp. 12−14. 2015, pp. 4, 12. for Action on the post-2015 education agenda, 147. Ibid., p. 14. 166. The Global Coalition to Protect Education UNESCO, Paris, May 2015, p. 3. 148. Schady, Norbert, et al., ‘Wealth Gradients in from Attack, Education under Attack 2014, The 130. Ibid. Early Childhood Cognitive Development in Global Coalition to Protect Education from 131. Ibid. Five Latin American Countries’, Journal of Attack Secretariat, New York, 2014, p. 8. 132. UNESCO Institute for Statistics and United Human Resources, vol. 50, no. 22015, 167. United Nations, Children and Armed Nations Children’s Fund, Fixing the Broken pp. 446−463. Conflict: Report of the Secretary-General, Promise of Education for All: Findings from 149. Oviedo, Maria, Ariel Fiszbein and Federico A/69/926–S/2015/409, United Nations, the Global Initiative on Out-of-School Children, Sucre, ‘Learning For All: An Urgent Challenge New York, 5 June 2015, pp. 2, 39 and 40. UIS, Montreal, 2015, p. 101. in Latin America, Commission For Quality 168. United Nations Office for the Coordination 133. United Nations Children’s Fund, Early Education For All Background Paper’, The of Humanitarian Affairs, 2016 Humanitarian Childhood Development: A statistical Dialogue Leadership for the Americas, Response Plan, Nigeria, OCHA, New York, snapshot – Building better brains and Washington, D.C., July 2015, p. 4. December 2015, p. 5. sustainable outcomes for children, UNICEF, 150. Uwezo Kenya, Are Our Children Learning?: 169. United Nations, Children and Armed New York, September 2014, p. 7. Annual Learning Assessment Report, Uwezo Conflict, Report of the Secretary-General, 134. United Nations Children’s Fund China, What Kenya, Nairobi, 2012, p. 3. A/69/926–S/2015/409, United Nations, New Matters to UNICEF China, UNICEF, Beijing, 151. Uwezo, Uganda, Are Our Children Learning?: York, 5 June 2015, pp. 2, 6, 9. 2014, p. 11. Annual learning assessment report, Uwezo 170. Multiple Indicator Cluster Surveys 2001 and 135. United Nations Children’s Fund, Early Uganda, Kampala, 2012, p. 14. 2010; Demographic Health Surveys 2007 and Childhood Development: A statistical 152. Ibid., p. 3. 2013−2014. snapshot – Building better brains and 153. Organisation for Economic Co-operation and 171. Crawford, Nicholas, et al., Protracted sustainable outcomes for children, UNICEF, Development, PISA 2012 Results in Focus: Displacement: Uncertain paths to self- New York, September 2014, p. 7. What 15-year-olds know and what they can reliance in exile, Overseas Development 136. Dabla-Norris, Era, et al., Causes and do with what they know, OECD, Paris, 2014, Institute, London, September 2015, p. 1. Consequences of Income Inequality: A global pp. 4−5. 172. United Nations Children’s Fund, Unless We perspective, International Monetary Fund, 154. Bos, Maria Soledad, Alejandro J. Ganimian Act Now: The impact of climate change on Washington, D.C., June 2015, p. 17. and Emiliana Vegas, América Latina en PISA children, UNICEF, New York, November 2015, 137. UNESCO World Inequality Database on 2012: ¿Cómo se desempeñan los estudiantes pp. 25, 32. Education (WIDE). pobres y ricos? Washington, D.C., Inter- 173. United Nations Children’s Fund, ‘Cyclone Pam 138. United Nations Children’s Fund, Progress for American Development Bank, 2013, quoted in Humanitarian Situation Report 7’, March 2015. Children: Beyond Averages − Learning from Oviedo, M., Ariel Fiszbein and Federico Sucre, 174. United Nations Educational, Scientific and the MDGs, No. 11, UNICEF, New York, June ‘Learning For All: An Urgent Challenge in Latin Cultural Organization, Pacific Education for All: 2015, p. 19. America’, Commission For Quality Education 2015 review, UNESCO, Paris, 2015, 139. United Nations Educational, Scientific and For All Background Paper, The Dialogue pp. 53, 64. Cultural Organization, EFA Global Monitoring Leadership for the Americas, Washington, 175. United Nations Office for the Coordination Report 2015: 2000–2015 − Achievements D.C., July 2015, p. 4. of Humanitarian Affairs, Financial and challenges, UNESCO, Paris, March 2015, 155. International Labour Organization, Global Tracking Service, , accessed Note: Government of Pakistan’s Academy Geneva, 2015, p.33. 3 June 2016. of Educational Planning and Management, 156. Steer, Liesbet, Hafez Ghanem, Maysa 176. Nicolai, Susan, and Sébastien Hine, Pakistan Education Statistics 2014−2015, Jalbout, et al., Arab Youth: Missing Investment for Education in Emergencies: A AEPAM, Islamabad, February 2016. Page 1 Educational Foundations for a Productive review of evidence, Overseas Development indicates that there are more than 6 million Life?, The Center for Education at the Institute, London, February 2015, p. 10. children of primary school age out of school. Brookings Institution, Washington, D.C., 177. United Nations Division of Economic and 141. Malik, Rabea, and Pauline Rose, Financing February 2014, p. 16. Social Affairs, ‘Youth Population Trends and Education in Pakistan Opportunities for 157. Oviedo, Fiszbein and Sucre, ‘Learning For Sustainable Development’, No. 2015/1, Action, Country Case Study for the Oslo All’, p. 10. UN DESA, New York, May 2015, p. 1. Summit on Education for Development, 2015, 158. Organisation for Economic Co-operation and 178. United Nations Children’s Fund, The p. 5. Development, Equity and Quality in Education Investment Case for Education and Equity, 142. United Nations Educational, Scientific and Supporting Disadvantaged Students and UNICEF, New York, January 2015, p. 13. Cultural Organization, EFA Global Monitoring Schools, OECD, Paris, 2012, p. 80. 179. United Nations Division of Economic and Report 2013/14: Teaching and learning − 159. Organisation for Economic Co-operation and Social Affairs, ‘Youth Population Trends and Achieving quality for all, UNESCO, Paris, 2014, Development, Education at a Glance 2014: Sustainable Development’, No. 2015/1, pp. 5, 19. OECD indicators, OECD, Paris, 2014, p. 9. UN DESA, New York, May 2015, p. 1. 143. United Nations Children’s Fund, Early 160. Ibid., p. 14. 180. United Nations Children’s Fund, The Childhood Development: A statistical 161. Email from UNICEF Tunisia, 4 March 2016. Investment Case for Education and Equity, snapshot – Building Better Brains and 162. United Nations Educational, Scientific and UNICEF, New York, January 2015, pp. 8–9. 104 THE STATE OF THE WORLD’S CHILDREN 2016
181. Montenegro, Claudio E., and Harry Anthony and health, the World Bank, Washington, Brookings Institution, Washington, D.C., Patrinos, ‘Comparable Estimates of Returns D.C., July 2013, pp.10−11. June 2015, p. 70; to Schooling around the World’, Policy 199. Rose, Pauline, and Benjamin Alcott, ‘How 217. United Nations Educational, Scientific and Research Working Paper 7020, The World Can Education Systems Become Equitable by Cultural Organization and UNESCO Institute Bank, Washington, D.C., 2014, p. 16. 2030?’, pp. 13, 23. for Statistics, ‘A Growing Number of Children 182. United Nations Educational, Scientific and 200. United Nations Children’s Fund, The and Adolescents Are Out of School as Aid Cultural Organization, EFA Global Monitoring Investment Case for Education and Equity, Fails to Meet the Mark', Policy Paper 22, Report 2013/14: Teaching and Learning − UNICEF, New York, January 2015, p. 66. Fact Sheet 31, UNESCO and UIS, Paris and Achieving quality for all, UNESCO, Paris, 2014, 201. United Nations Children’s Fund, ‘Advancing Montreal, July 2015. pp. 140–185. WASH in Schools Monitoring’, Working Paper, 218. Crawford, Nicholas, et al., Protracted 183. Ibid., p. 175. UNICEF, New York, 2015, pp. 17, 20. Displacement: Uncertain paths to self- 184. Cunningham, Hugh, and Pier Paolo Viazzo, 202. UNESCO Institute for Statistics, January reliance in exile, Overseas Development eds., Child Labour in Historical Perspective: 2015. Institute, London, September 2015, pp. 2–3. 1800−1985 − Case studies from Europe, 203. Muralidharan, Karthik, ‘Priorities for Primary 219. Nicolai, Susan, et al., Education Cannot Japan and Colombia, UNICEF International Education Policy in India’s 12th Five-year Wait: Proposing a fund for education in Child Development Centre and Istituto degli Plan’, India Policy Forum 2013, vol. 9, National emergencies, Overseas Development Innocenti, Florence, 1996. Council of Applied Economic Research Institute, London, May 2016, pp. 9-10. 185. Hanushek, Eric A., and Ludger Wößmann, and the Brookings Institution, New Delhi, 220. Organisation for Economic Co-operation and Education Quality and Economic Growth, 2013. pp.15−16; and Banerjee, Abhijit, V., et Development, Equity and Quality in Education The World Bank, Washington, D.C., 2007, al., ‘Remedying Education: Evidence from Supporting Disadvantaged Students and p. 1.; and Hanushek, Eric A., and Ludger two randomized experiments in India’, The Schools, OECD, Paris, 2012, p. 15. Wößmann, ‘The Role of Cognitive Skills in Quarterly Journal of Economics, vol. 122, 221. Hanushek, Eric A., and Ludger Wößmann, Economic Development’, Journal of Economic no. 3, pp. 1235−1264. Universal Basic Skills: What countries stand Literature, vol. 46, no. 3, 2008, pp. 607–668. 204. Rose, Pauline, and Benjamin Alcott, ‘How to gain, OECD Publishing, Paris, 2015, p. 12. 186. Hanushek, Eric A., and Ludger Wößmann Can Education Systems Become Equitable by 222. Wales, Joseph, et al., Improvements in Universal Basic Skills: What countries stand 2030?’, p. 23. the Quality of Basic Education: Chile's to gain, OECD Publishing, Paris, 2015, p. 10. 205. United Nations Educational, Scientific and experience, Overseas Development Institute, 187. Hanushek, Eric A., and Ludger Wößmann, Cultural Organization, EFA Global Monitoring London, July 2014, p.8. Education Quality and Economic Growth, Report 2013/14: Teaching and Learning − 223. Ferreira, Francisco H. G., et al., A Global The World Bank, Washington, D.C., 2007, Achieving quality for all, UNESCO, Paris, 2014, Count of the Extreme Poor in 2012: Data p. 1.; and Hanushek, Eric A., and Ludger pp. 186, 223. issues, methodology and initial results, Policy Wößmann, ‘The Role of Cognitive Skills in 206. United Nations Educational, Scientific and Research Working Paper 7432, World Bank, Economic Development’, Journal of Economic Cultural Organization, EFA Global Monitoring Washington, D.C., October 2015. Literature, vol. 46, no. 3, 2008, pp. 607–668. Report 2015: 2000–2015 − Achievements 224. Regional aggregates from the World Bank 188. United Nations Children’s Fund, ‘Bilan and challenges, UNESCO, Paris, March 2015, PovcalNet. de Compétences – Enfants à L’entrée au p. 242. 225. Economic and Social Commission for Primaire au Cap Vert’, UNICEF, Cabo Verde, 207. The World Bank, ‘Government expenditure on Western Asia, The Arab Millennium 2013, p. 46. education as % of GDP (%)’, The World Bank, Development Goals Report: Facing challenges 189. Berlinski, Samuel, Sebastian Galiani and Paul Washington, D.C., February 2016. and looking beyond 2015, ESCWA, August Gertler, ‘The Effect of Pre-primary Education 208. Government of Pakistan Ministry of Finance, 2013, p. 3. on Primary School Performance’, Journal of Pakistan Economic Survey 2014−2015, 226. Economic and Social Commission for Public Economics, vol. 93, no.1–2, February Government of Pakistan, Islamabad, March Western Asia, Conflict in the Syrian Arab 2009, pp. 219–234, section 4.5 and section 6. 2016, p. 171. Note: The World Bank puts Republic: Macroeconomic implications 190. Rose, Pauline, and Benjamin Alcott, ‘How the figure at 2.5 per cent. The World Bank, and obstacles to achieving the Millennium Can Education Systems Become Equitable by ‘Government expenditure on education as % Development Goals, ESCWA, June 2014, 2030?’, August 2015. of GDP (%)’, The World Bank, Washington, p. 27. 191. United Nations Children’s Fund, The D.C., February 2016. 227. Verme, Paolo, et al., The Welfare of Syrian Investment Case for Education and Equity, 209. Steer, Lisbeth, and Katie Smith, Financing Refugees: Evidence from Jordan and UNICEF, New York, January 2015, p. 27. Education: Opportunities for global action, Lebanon, World Bank and United Nations 192. Bangladesh Institute of Development Studies, Center for Universal Education at the Refugee Agency, December 2015, p. xvi. Impact Evaluation Study of Reaching Out- Brookings Institution, Washington, D.C., 228. United Nations, Department of Economic of-School Children (ROSC) Project of the June 2015, p. 23. and Social Affairs, Population Division, World Ministry of Primary and Mass Education, 210. United Nations Children’s Fund, The Population Prospects: The 2015 revision, Bangladesh Institute of Development Studies, Investment Case for Education and Equity, UN DESA, New York, 2015. Dhaka, June 2014, p. 9. UNICEF, New York, January 2015, p. 59. 229. ODI calculations for UNICEF based on data 193. United Nations Children’s Fund, EduTrac: 211. Organisation for Economic Co-operation and from the World Bank and UN DESA. Tracking and monitoring education, UNICEF, Development, Education Policy Outlook Chile, 230. ODI calculations for UNICEF based on data New York, March 2013. OECD, Paris, November 2013, p. 8. from the World Bank. 194. United Nations Children’s Fund, The State 212. United Nations Children’s Fund, The 231. The World BankPovcalNet. of the World’s Children 2015: Reimagine the Investment Case for Education and Equity, 232. ODI calculations for UNICEF based on data future, UNICEF, New York, 2014. UNICEF, New York, January 2015. from The World Bank. 195. United Nations Children’s Fund,’ “It’s about 213. United Nations Children’s Fund, ‘Rapport final 233. The World Bank, Shifting Gears to Accelerate ability” Campaign Results in 80 Per Cent d’évaluation du Programme Appui d'Urgence Shared Prosperity in Latin America and the of Citizens Supporting Inclusive Education’, à l'Éducation Nationale Malgache (AUENM)’, Caribbean, World Bank, Washington, D.C., UNICEF, New York, February 2016; and Internal Evaluation Report, UNICEF, June June 2013, p. 9. Note: Extreme poverty is United Nations Children’s Fund, The State 2015. defined in this case as living on less than of the World’s Children 2013: Children with 214. United Nations Educational, Scientific and US$2.50 a day. Vulnerability to poverty is disabilities, UNICEF, New York, May 2013, p. 13. Cultural Organization, EFA Global Monitoring defined as living on US$4.10 a day or less. 196. United Nations Children’s Fund, UNICEF Report, ‘Pricing the Right to Education: The 234. Stampini, M., et al., ‘Poverty, Vulnerability Annual Report 2014: Montenegro, UNICEF, cost of reaching new targets by 2030’, Policy and the Middle Class in Latin America’, New York, 2014, p. 5. Paper 18, UNESCO, Paris, July 2015, p. 4. Working Paper Series No. 591, Inter-American 197. Rose, Pauline, and Benjamin Alcott, ‘How Figures were in US dollars, in 2012. Development Bank, Washington, D.C., Can Education Systems Become Equitable by 215. Ibid. May 2015. 2030?’, p. 15. 216. Steer, Lisbeth, and Katie Smith, Financing 235. UNICEF Office of Research, ‘Children of the 198. Martin, Gayle, H., and Obert Pimhidzai, Education: Opportunities for global action, Recession: The impact of the economic crisis Service Delivery Indicators Kenya: Education Center for Universal Education at the on child well-being in rich countries’, Innocenti THE STATE OF THE WORLD’S CHILDREN 2016 105
Report Card 12, UNICEF Office of Research, 256. Ibid. 271. Kazinga, Harounan, et al., Seven-Year Florence, September 2014. 257. Internal analysis by UNICEF Social Protection Impacts of Burkina Faso’s BRIGHT Program, 236. Ortiz, Isabel, and Matthew Cummins, eds., A for 2015 Annual Results Report (not yet Millennium Challenge Corporation, Recovery for All: Rethinking socio-economic published). Washington, D.C., February 2016; and policies for children and poor households, 258. Fiszbein, Ariel, Ravi Kanbur and Ruslan Benhassine, Najy, et al., ‘Turning a Shove UNICEF, Division of Policy and Practice, New Yemtsov, Social Protection, Poverty and the into a Nudge?: A ‘labeled cash transfer’ for York, 2012. Post-2015 Agenda, World Bank, Washington, education’, American Economic Journal: 237. UNICEF Office of Research, ‘Children of the D.C., May 2013, p. 12. Economic Policy, vol. 7, no. 3, August 2015, Recession: The impact of the economic crisis 259. Soares, Fabio Veras, et al., Cash Transfer pp. 86–125. on child well-being in rich countries’, Innocenti Programmes in Brazil: Impacts on inequality 272. Ahmed, Akhter, U., ‘Impact of Feeding Report Card 12, UNICEF Office of Research, and poverty, United Nations Development Children in School: Evidence from Florence, September 2014. Programme, June 2006, p. 1. Bangladesh’, International Food Policy 238. Ibid., p. 9. 260. De Neubourg, Chris, Bruno Martarano and Research Institute, Washington, D.C., 239. Alkire, Sabina, et al., Global Multidimensional Marco Sanfilippo, The Impact of Social November 2004, p. 41, mentioned in Sabates- Poverty Index 2015 Summary, Oxford Poverty Protection on Children: A review of the Wheeler, Rachel, and Jennifer Yablonski, & Human Development Initiative, Oxford, literature, UNICEF Office of Research, ‘Social Protection and Child Poverty: June 2015, p. 1. Florence, June 2012, p. 12. Evidence, practice, and gaps’, unpublished 240. de Milliano, Marlous, and Ilze Plavgo, 261. Plagerson, Sophie and Marianne S. Ulriksen, UNICEF background paper for this edition of ‘Analysing Child Poverty and Deprivation Cash Transfer Programmes, Poverty The State of the World’s Children 2016, p. 19. in sub-Saharan Africa’, Office of Research Reduction and Empowerment of Women in 273. UNESCO Institute for Statistics and United Working Paper: WP-2014-19, UNICEF Office South Africa, Working Paper No. 4 / 2015, Nations Children’s Fund, Fixing the Broken of Research, Florence, November 2014, p. 18. International Labour Organization, Gender, Promise of Education for All: Findings from 241. ECLAC-UNICEF, La pobreza infantil en Equality and Diversity Branch, Conditions the Global Initiative on Out-of-School Children, América Latina y el Caribe, CEPAL, Chile, of Work and Equality Department, Geneva, UNESCO-UIS, Montreal, 2015, p. 65. December 2010. 2015, p. 33. 274. Arráiz, Irani, and Sandra Rozo, ‘Same 242. The World Bank, World Development Report: 262. Overseas Development Institute, Doing Cash Bureaucracy, Different Outcomes in Human Conflict, security, and development, World Differently: How cash transfers can transform Capital?: How indigenous and rural non- Bank, Washington, D.C., 2011, p. 62 humanitarian aid − Report of the high level indigenous areas in Panama responded to 243. United Nations Children’s Fund, Unless We Act panel on humanitarian cash transfers, ODI, the CCT’, Inter-American Development Bank, Now: The impact of climate change on children, London, September 2015, p. 18. Office of Evaluation and Oversight, Working UNICEF, New York, November 2015, p. 33. 263. Barakat, Nesreen, et al., A Window of Hope: Paper OVE/WP-0311, May 2011. 244. Fotso, Jean-Christophe, ‘Child health UNICEF child cash grant programme in 275. Alam, Andaleeb, et al., ‘Does Cash for School Inequities in Developing Countries: Jordan − Post-distribution monitoring report Influence Young Women’s Behavior in the Differences across urban and rural areas’, (February−June 2015), UNICEF Jordan Longer Term? Evidence from Pakistan’, Policy International Journal for Equity in Health, Country Office, August 2015, p. 29. Research Working Paper Series 5669, World vol. 5, no. 9, 2006, p. 8. 264. Merttens, Fred, et al., Kenya Hunger Safety Bank, Washington, D.C., May 2011. 245. United Nations Children’s Fund and Informal Net Programme Monitoring and Evaluation 276. International Labour Organization, World Settlements Development Facility, Egypt, Component Impact Evaluation: Impact Social Protection Report 2014/15: Building Multidimensional Child Poverty in Slums and evaluation final report: 2009 to 2012, Oxford economic recovery, inclusive development Unplanned Areas in Egypt, UNICEF Egypt and Policy Management, Oxford, June 2013, and social justice, ILO, Geneva, June 2014, ISDF, Cairo, 2013, p. 1. p. 22. p. 16. 246. United Nations Children’s Fund China, What 265. Handa, Sudhanshu, et al., Livelihood 277. Ahmed, Akhter, U., Impact of Feeding Matters to UNICEF China, UNICEF China, Empowerment against Poverty Impact Children in School: Evidence from 2014, p. 11. Evaluation, Carolina Population Center, Bangladesh, International Food Policy 247. United Nations, Department of Economic University of North Carolina at Chapel Hill, Research Institute, Washington, D.C., and Social Affairs, Population Division, World North Carolina, October 2013. November 2004, p. 41, mentioned in Urbanization Prospects: The 2014 revision, 266. Fiszbein, Ariel, and Norbert Schady, Sabates-Wheeler, Rachel, and Jennifer UN DESA, New York, 2014, p. 2. ‘Conditional Cash Transfers: Reducing Yablonski, ‘Social Protection and Child 248. International Labour Organization, ‘Decent Present and Future Poverty’, A World Bank Poverty: Evidence, practice, and gaps’, Work and the Informal Economy: A policy Policy Research Report 47603, World Bank, unpublished UNICEF background paper for resource guide’, ILO, March 2013, p. 329. Washington, D.C., 2009, p. xi. The State of the World’s Children 2016, 249. Ibid., p. 30. 267. Benhassine, Najy, et al., ‘Turning a Shove p. 19. 250. Jiang, Yang, Mercedes Ekono and Curtis into a Nudge?: A ‘labeled cash transfer’ for 278. World Health Organization, ‘Integrated Health Skinner, ‘Basic Facts About Low-Income education’, American Economic Journal: Services – What and why?’ Technical Brief No. Children: Children under 18 years, 2013’, Fact Economic Policy, vol. 7, no. 3, August 2015, 1, 2008, p. 6. Sheet, National Center for Children in Poverty, pp. 86–125. 279. Refers to countries and areas that are either Mailman School of Public Health, Columbia 268. Guarcello, Lorenzo, Scott Lyon and Furio partially or entirely affected by conflict. University, New York, January 2015, pp. 1−4. Rosati, ‘Child Labour and Out-of-School UNICEF calculations based on UNICEF global 251. UNICEF Regional Office for Central and Children: Evidence from 25 developing databases. Eastern Europe and the Commonwealth of countries’, Background Paper for Fixing the 280. Hutton, G., ‘Global Costs and Benefits Independent States (CEE/CIS), Education Broken Promise of Education for All, UNESCO of Drinking-Water Supply and Sanitation Section, The Right of Roma Children to Institute for Statistics and UNICEF, Montreal, Interventions to Reach the MDG target Education: Position paper, UNICEF Regional 2015, p. 29; International Labour Organization, and Universal Coverage’, World Health Office for CEE/CIS, Geneva, 2011. World Report on Child Labour 2015: Paving Organization, 2012 252. FRA European Union Agency for Fundamental the way to decent work for young people, 281. United Nations Children’s Fund, The Rights, Poverty and Employment: The ILO, Geneva, 2015, pp. 66−67. Investment Case for Education and Equity, situation of Roma in 11 EU Member States, 269. UNESCO Institute for Statistics and United UNICEF, New York, Jan. 2015. European Union Agency for Fundamental Nations Children’s Fund, Fixing the Broken 282. United Nations Children’s Fund and World Rights, Vienna, 2014, p. 12. Promise of Education for All: Findings from Food Programme, ‘Return on Invesmtment 253. Ibid. the Global Initiative on Out-of-School Children, for Emergency Preparedness Study’, Final 254. Ibid., p. 37. UNESCO-UIS, Montreal, 2015, p. 42. Report, Analysis conducted by the Boston 255. Fanjul, Gonzalo, ‘Child poverty and inequality 270. Filmer, Deon, and Norbert Schady, ‘The Consulting Group for UNICEF and WFP, n.p., in rich countries’, Background Paper for The Medium-term Effects of Scholarships in a 2015. State of the World’s Children 2016, UNICEF, Low-Income Country,’ Journal of Human 283. ALS Association, ‘ALS Ice Bucket Challenge 2015, p. 4, citing statistics from Eurostat (not Resources, vol. 49, no. 3, summer 2014, Commitments’, ALS Association, Washington, published). pp. 663−694. D.C., 2016. 106 THE STATE OF THE WORLD’S CHILDREN 2016
Statistical Tables Economic and social statistics on the countries and areas of the world, with particular reference to children’s well-being. Tables 1. Basic indicators 118 2. Nutrition 122 3. Health 126 4. HIV/AIDS 130 5. Education 134 6. Demographic indicators 138 7. Economic indicators 142 8. Women 146 9. Child protection 150 Overview 108 10. The rate of progress 154 General note on the data 108 11. Adolescents 158 Child mortality estimates 109 12. Disparities by residence 162 Under-five mortality rankings 110 13. Disparities by Regional classification 112 household wealth 166 Notes on specific tables 113 14. Early childhood development 170 EXPLANATION OF SYMBOLS The following symbols are common across all tables: – Data are not available. y Data differ from the standard * Data refer to the most recent year definition or refer to only part of available during the period specified x Data refer to years or periods other a country. If they fall within the in the column heading. than those specified in the column noted reference period, such data heading. Such data are not included are included in the calculation of ** Excludes China. in the calculation of regional and regional and global averages. global averages, unless otherwise noted. Sources and years for specific data points are available at . Symbols that appear in specific tables are explained in the footnotes to those tables. THE STATE OF THE WORLD’S CHILDREN 2016 107
Overview This reference guide presents the most recent key statistics on child survival, development and protection for the world’s countries, areas and regions. The statistical tables in this volume support UNICEF’s focus on progress and results towards internationally agreed-upon goals and compacts relating to children’s rights and development. Efforts have been made to maximize the comparability of statistics across countries and time. Nevertheless, data used at the country level may differ in terms of the methods used to collect data or arrive at estimates, and in terms of the populations covered. Furthermore, data presented here are subject to evolving methodologies, revisions of time series data (e.g., immunization, maternal mortality ratios) and changing regional classifications. Also, data comparable from one year to the next are unavailable for some indicators. It is therefore not advisable to compare data from consecutive editions of The State of the World’s Children. The numbers presented in this reference guide are available online at and via the UNICEF global statistical databases at . Please refer to these websites for the latest tables and for any updates or corrigenda subsequent to printing. General note on the data Data presented in the following statistical tables are derived from the UNICEF global databases and are accompanied by definitions, sources and, where necessary, additional footnotes. The tables draw on inter-agency estimates and nationally representative household surveys such as Multiple Indicator Cluster Surveys (MICS) and Demographic and Health Surveys (DHS). In addition, data from administrative sources and other United Nations organizations have been used. Data presented in this year’s statistical tables generally reflect information available as of January 2016. More detailed information on methodology and data sources is available at . This volume includes the latest population estimates and projections from World Population Prospects: The 2015 revision and World Urbanization Prospects: The 2014 revision (United Nations Department of Economic and Social Affairs, Population Division). Data quality is likely to be adversely affected for countries that have recently suffered disasters, especially where basic country infrastructure has been fragmented or where major population movements have occurred. Multiple Indicator Cluster Surveys (MICS): UNICEF assists countries in collecting and analyzing data in order to fill data gaps for monitoring the situation of children and women through its international household survey initiative, the Multiple Indicator Cluster Surveys (MICS). Since 1995, over 280 surveys have been completed in more than 100 countries and areas. MICS are among the largest sources of data for monitoring progress towards internationally agreed-upon development goals for children, including the MDGs. More information is available at . 108 THE STATE OF THE WORLD’S CHILDREN 2016
Child mortality estimates Each year, in The State of the World’s Children, UNICEF reports a series of mortality estimates for children – including the annual neonatal mortality rate, infant mortality rate, the under-five mortality rate (total, male and female) and the number of under-five deaths. These figures represent the best estimates available at the time of printing and are based on the work of the United Nations Inter-agency Group for Child Mortality Estimation (UN IGME), which includes UNICEF, the World Health Organization (WHO), the World Bank and the United Nations Population Division. UN IGME mortality estimates are updated annually through a detailed review of all newly available data points, which often results in adjustments to previously reported estimates. As a result, consecutive editions of The State of the World’s Children should not be used for analysing mortality trends over time. Comparable global and regional under-five mortality estimates for the period 1970–2015 are presented below. Country-specific mortality indicators for 1970–2015, based on the most recent UN IGME estimates, are presented in Table 10 (for the years 1970, 1990, 2000 and 2015) and are available at and . Under-five mortality rate (per 1,000 live births) UNICEF Region 1970 1975 1980 1985 1990 1995 2000 2005 2010 2015 Sub-Saharan Africa 244 219 201 188 180 172 154 127 101 83 Eastern and Southern Africa 213 195 189 175 167 159 140 111 84 67 West and Central Africa 276 246 218 206 198 190 172 145 119 99 Middle East and North Africa 200 164 127 91 71 61 50 42 34 29 South Asia 213 195 171 149 129 111 94 77 64 53 East Asia and the Pacific 116 94 76 64 58 51 42 30 23 18 Latin America and the Caribbean 120 103 85 68 54 42 32 25 24 18 CEE/CIS 97 74 69 56 48 47 37 28 21 17 Least developed countries 242 230 212 192 175 158 138 111 90 73 World 145 129 116 101 91 85 76 63 52 43 Under-five deaths (millions) UNICEF Region 1970 1975 1980 1985 1990 1995 2000 2005 2010 2015 Sub-Saharan Africa 3.2 3.2 3.4 3.6 3.9 4.1 4.1 3.7 3.3 2.9 Eastern and Southern Africa 1. 3 1. 4 1. 6 1. 6 1. 7 1. 8 1. 8 1. 5 1. 3 1. 1 West and Central Africa 1. 7 1. 7 1. 8 1. 9 2.0 2.2 2.2 2.1 1. 9 1. 8 Middle East and North Africa 1. 2 1. 1 1. 0 0.8 0.7 0.5 0.4 0.4 0.3 0.3 South Asia 5.8 5.8 5.5 5.3 4.7 4.1 3.5 2.9 2.4 1. 9 East Asia and the Pacific 5.0 3.5 2.4 2.4 2.5 1. 6 1. 2 0.9 0.7 0.5 Latin America and the Caribbean 1. 2 1. 1 1. 0 0.8 0.6 0.5 0.4 0.3 0.3 0.2 CEE/CIS 0.6 0.5 0.5 0.4 0.4 0.3 0.2 0.1 0.1 0.1 Least developed countries 3.3 3.5 3.6 3.6 3.6 3.6 3.4 3.0 2.5 2.2 World 17. 2 15.6 13.9 13.4 12.7 11.0 9.8 8.3 7. 0 5.9 THE STATE OF THE WORLD’S CHILDREN 2016 109
UNDER-FIVE MORTALITY RANKINGS The following list ranks countries and areas in descending order of their estimated 2015 under-five mortality rate (U5MR), a critical indicator of the well-being of children. Countries and areas are listed alphabetically in the tables on the following pages. HIGHEST UNDER-FIVE MORTALITY RATE Under-5 mortality Under-5 mortality Under-5 mortality rate (2015) rate (2015) rate (2015) Countries and areas Value Rank Countries and areas Value Rank Countries and areas Value Rank Angola 157 1 Malawi 64 33 Micronesia 35 65 Chad 139 2 Zambia 64 33 (Federated States of) Somalia 137 3 Ghana 62 35 Nauru 35 65 Central African Republic 130 4 Swaziland 61 36 Bhutan 33 67 Sierra Leone 120 5 Ethiopia 59 37 Azerbaijan 32 68 Mali 115 6 Papua New Guinea 57 38 Iraq 32 68 Nigeria 109 7 Kiribati 56 39 Dominican Republic 31 70 Benin 100 8 Uganda 55 40 Cambodia 29 71 Democratic Republic 98 9 Timor-Leste 53 41 Guatemala 29 71 of the Congo Gabon 51 42 Morocco 28 73 Niger 96 10 Turkmenistan 51 42 Philippines 28 73 Equatorial Guinea 94 11 Madagascar 50 44 Solomon Islands 28 73 Guinea 94 11 Myanmar 50 44 Vanuatu 28 73 Côte d'Ivoire 93 13 Kenya 49 46 Indonesia 27 77 Guinea-Bissau 93 13 United Republic 49 46 Tuvalu 27 77 South Sudan 93 13 of Tanzania Algeria 26 79 Afghanistan 91 16 India 48 48 Cabo Verde 25 80 Lesotho 90 17 Eritrea 47 49 Democratic People's 25 80 Burkina Faso 89 18 Sao Tome and Principe 47 49 Republic of Korea Cameroon 88 19 Senegal 47 49 Egypt 24 82 Mauritania 85 20 Congo 45 52 Niue 23 83 Burundi 82 21 Namibia 45 52 Ecuador 22 84 Pakistan 81 22 Tajikistan 45 52 Fiji 22 84 Mozambique 79 23 Botswana 44 55 Mongolia 22 84 Togo 78 24 Rwanda 42 56 Nicaragua 22 84 Comoros 74 25 Yemen 42 56 Viet Nam 22 84 Zimbabwe 71 26 South Africa 41 58 Dominica 21 89 Liberia 70 27 Guyana 39 59 Kyrgyzstan 21 89 Sudan 70 27 Uzbekistan 39 59 Paraguay 21 89 Gambia 69 29 Bangladesh 38 61 State of Palestine 21 89 Haiti 69 29 Bolivia (Plurinational 38 61 Suriname 21 89 Lao People's Democratic 67 31 State of) Honduras 20 94 Republic Marshall Islands 36 63 Trinidad and Tobago 20 94 Djibouti 65 32 Nepal 36 63 Jordan 18 96 110 THE STATE OF THE WORLD’S CHILDREN 2016
ABOUT 16,000 CHILDREN UNDER 5 YEARS OLD STILL DIE EVERY DAY. LOWEST UNDER-5 MORTALITY RATE Under-5 mortality Under-5 mortality Under-5 mortality rate (2015) rate (2015) rate (2015) Countries and areas Value Rank Countries and areas Value Rank Countries and areas Value Rank Saint Vincent and 18 96 Thailand 12 125 Greece 5 159 the Grenadines China 11 130 Lithuania 5 159 Samoa 18 96 Romania 11 130 Montenegro 5 159 Belize 17 99 Saint Kitts and Nevis 11 130 Poland 5 159 El Salvador 17 99 Brunei Darussalam 10 133 Australia 4 166 Panama 17 99 Bulgaria 10 133 Austria 4 166 Peru 17 99 Costa Rica 10 133 Belgium 4 166 Tonga 17 99 Croatia 4 166 Russian Federation 10 133 Denmark 4 166 Brazil 16 104 Sri Lanka 10 133 Colombia 16 104 France 4 166 Uruguay 10 133 Germany 4 166 Iran (Islamic Republic of) 16 104 Kuwait 9 139 Jamaica 16 104 Ireland 4 166 Maldives 9 139 Israel 4 166 Palau 16 104 Ukraine 9 139 Republic of Moldova 16 104 Italy 4 166 Antigua and Barbuda 8 142 Monaco 4 166 Saudi Arabia 15 110 Chile 8 142 Netherlands 4 166 Venezuela 15 110 Cook Islands 8 142 Portugal 4 166 (Bolivarian Republic of) Albania 14 112 Latvia 8 142 Spain 4 166 Armenia 14 112 Lebanon 8 142 Switzerland 4 166 Kazakhstan 14 112 Qatar 8 142 United Kingdom 4 166 Malaysia 7 148 Andorra 3 182 Mauritius 14 112 Cyprus 3 182 Saint Lucia 14 112 Serbia 7 148 Czech Republic 3 182 Seychelles 14 112 Slovakia 7 148 Estonia 3 182 Tunisia 14 112 United Arab Emirates 7 148 Japan 3 182 Turkey 14 112 United States 7 148 Norway 3 182 Argentina 13 120 Bahrain 6 153 Republic of Korea 3 182 Barbados 13 120 Cuba 6 153 San Marino 3 182 Libya 13 120 Hungary 6 153 Singapore 3 182 Mexico 13 120 Malta 6 153 Slovenia 3 182 Syrian Arab Republic 13 120 New Zealand 6 153 Sweden 3 182 Bahamas 12 125 The former Yugoslav 6 153 Finland 2 193 Georgia 12 125 Republic of Macedonia Iceland 2 193 Belarus 5 159 Luxembourg 2 193 Grenada 12 125 Bosnia and Herzegovina 5 159 Oman 12 125 Holy See - - Canada 5 159 Liechtenstein - - THE STATE OF THE WORLD’S CHILDREN 2016 111
Regional classification Averages presented at the end of each of the 14 statistical tables are calculated using data from countries and areas as classified below. Sub-Saharan Africa Eastern and Southern Africa; West and Central Africa; Djibouti; Sudan Eastern and Southern Africa Angola; Botswana; Burundi; Comoros; Eritrea; Ethiopia; Kenya; Lesotho; Madagascar; Malawi; Mauritius; Mozambique; Namibia; Rwanda; Seychelles; Somalia; South Africa; South Sudan; Swaziland; Uganda; United Republic of Tanzania; Zambia; Zimbabwe West and Central Africa Benin; Burkina Faso; Cabo Verde; Cameroon; Central African Republic; Chad; Congo; Côte d’Ivoire; Democratic Republic of the Congo; Equatorial Guinea; Gabon; Gambia; Ghana; Guinea; Guinea-Bissau; Liberia; Mali; Mauritania; Niger; Nigeria; Sao Tome and Principe; Senegal; Sierra Leone; Togo Middle East and North Africa Algeria; Bahrain; Djibouti; Egypt; Iran (Islamic Republic of); Iraq; Jordan; Kuwait; Lebanon; Libya; Morocco; Oman; Qatar; Saudi Arabia; State of Palestine; Sudan; Syrian Arab Republic; Tunisia; United Arab Emirates; Yemen South Asia Afghanistan; Bangladesh; Bhutan; India; Maldives; Nepal; Pakistan; Sri Lanka East Asia and Pacific Brunei Darussalam; Cambodia; China; Cook Islands; Democratic People’s Republic of Korea; Fiji; Indonesia; Kiribati; Lao People’s Democratic Republic; Malaysia; Marshall Islands; Micronesia (Federated States of); Mongolia; Myanmar; Nauru; Niue; Palau; Papua New Guinea; Philippines; Republic of Korea; Samoa; Singapore; Solomon Islands; Thailand; Timor-Leste; Tonga; Tuvalu; Vanuatu; Viet Nam Latin America and Caribbean Antigua and Barbuda; Argentina; Bahamas; Barbados; Belize; Bolivia (Plurinational State of); Brazil; Chile; Colombia; Costa Rica; Cuba; Dominica; Dominican Republic; Ecuador; El Salvador; Grenada; Guatemala; Guyana; Haiti; Honduras; Jamaica; Mexico; Nicaragua; Panama; Paraguay; Peru; Saint Kitts and Nevis; Saint Lucia; Saint Vincent and the Grenadines; Suriname; Trinidad and Tobago; Uruguay; Venezuela (Bolivarian Republic of) Central and Eastern Europe and the Commonwealth of Independent States (CEE/CIS) Albania; Armenia; Azerbaijan; Belarus; Bosnia and Herzegovina; Bulgaria; Croatia; Georgia; Kazakhstan; Kyrgyzstan; Montenegro; Republic of Moldova; Romania; Russian Federation; Serbia; Tajikistan; the former Yugoslav Republic of Macedonia; Turkey; Turkmenistan; Ukraine; Uzbekistan Least developed countries/areas [Classified as such by the United Nations High Representative for the Least Developed Countries, Landlocked Developing Countries and Small Island Developing States (UN-OHRLLS)]. 112 THE STATE OF THE WORLD’S CHILDREN 2016
Afghanistan; Angola; Bangladesh; Benin; Bhutan; Burkina Faso; Burundi; Cambodia; Central African Republic; Chad; Comoros; Democratic Republic of the Congo; Djibouti; Equatorial Guinea; Eritrea; Ethiopia; Gambia; Guinea; Guinea-Bissau; Haiti; Kiribati; Lao People’s Democratic Republic; Lesotho; Liberia; Madagascar; Malawi; Mali; Mauritania; Mozambique; Myanmar; Nepal; Niger; Rwanda; Sao Tome and Principe; Senegal; Sierra Leone; Solomon Islands; Somalia; South Sudan; Sudan; Timor-Leste; Togo; Tuvalu; Uganda; United Republic of Tanzania; Vanuatu; Yemen; Zambia Notes on specific tables TABLE 2. NUTRITION Underweight, stunting, wasting and overweight: UNICEF, WHO and the World Bank have continued a process to harmonize anthropometric data used for computation and estimation of regional and global averages and trend analysis. As part of this process, regional and global averages for underweight, stunting, wasting and overweight prevalences are derived from a model described in M. de Onis et al., ‘Methodology for Estimating Regional and Global Trends of Child Malnutrition’ (International Journal of Epidemiology, vol. 33, 2004, pp. 1260–1270). Owing to differences in data sources (i.e., new empirical data are incorporated as made available) and estimation methodology, these regional average prevalence estimates may not be comparable to the averages published in previous editions of The State of the World’s Children. Vitamin A supplementation: Emphasizing the importance for children of receiving two annual doses of vitamin A (spaced 4–6 months apart), this report presents only full coverage of vitamin A supplementation. In the absence of a direct method to measure this indicator, full coverage is reported as the lower coverage estimate from semester 1 January–June and semester 2 July–December, in a given year. The regional and global aggregates only contain the 82 countries indicated as priority countries for national level programmes. Hence the aggregates are published where at least 50 per cent of the population coverage for the priority countries in each region have been met. In other words, East Asia and Pacific estimates are presented despite there being no data for China, because China is not a priority country for a national level programme. Low birthweight: The data have not been updated since November 2014 due to ongoing methodological work to revise the analysis method for estimates from household surveys where a large number of children are not weighed. Iodized salt: The data have not been updated since November 2014 due to an upcoming change in the definition of the of the indicator that will be reported on in future editions of The State of the World’s Children. TABLE 3. HEALTH Water and sanitation: The drinking water and sanitation coverage estimates in this report come from the WHO/UNICEF Joint Monitoring Programme for Water Supply and Sanitation (JMP). Full details of the JMP methodology can be found at and . As the JMP estimates use linear regression applied to data from household sample surveys and censuses, and additional data become available between each issue of estimates, subsequent JMP estimates should not be compared. THE STATE OF THE WORLD’S CHILDREN 2016 113
Immunization: This report presents WHO and UNICEF estimates of national immunization coverage. Since 2000, the estimates are updated once annually in July, following a consultation process wherein countries are provided draft reports for review and comment. As the system incorporates new empirical data, each annual revision supersedes prior data releases, and coverage levels from earlier revisions are not comparable. A more detailed explanation of the process can be found at . Regional averages for the reported antigens are computed as follows: • For BCG, regional averages include only those countries where BCG is included in the national routine immunization schedule. • For DPT, polio, measles, HepB, Hib, PCV and rotavirus vaccines, regional averages include all countries, as these vaccines are universally recommended by WHO. • For protection at birth (PAB) from tetanus, regional averages include only the countries where maternal and neonatal tetanus is endemic. Treatment indicators: Until recently, ‘Proportion of children under 5 with fever who are treated with appropriate antimalarial drugs’ was the standard indicator for monitoring coverage of antimalarial treatment in children under 5. However, it has become increasingly challenging to track trends in this indicator, following a 2010 WHO recommendation that advised universal use of diagnostic testing to confirm malaria infection before applying any treatment. To implement this recommendation, many countries are scaling up the use of diagnostic testing to focus treatment on only those diagnosed with malaria. Given that increasingly higher number of fever cases are not malaria, low levels of antimalarial treatment in febrile children may indicate that antimalarials are being provided only to confirmed cases. For more information on this issue, see the 2013 edition of the Household Survey Indicators for Malaria Control. Given these methodological issues, this indicator is no longer tracked for coverage monitoring and has now been replaced with ‘Care seeking for fever’ in this publication. The indicator ‘Antibiotic treatment for children with symptoms of pneumonia’ has been dropped from this table as well. This indicator refers to antibiotic treatment among children whose caretakers report symptoms that are related to acute respiratory infection. However, these children have not been medically diagnosed with pneumonia, thus leading to substantial validity issues. Studies have shown that high percentage of children with symptoms of acute respiratory infection do not have true pneumonia. Therefore, this indicator is no longer recommended for coverage monitoring. TABLE 4. HIV/AIDS In 2015, the Joint United Nations Programme on HIV/AIDS (UNAIDS) released new global, regional and country-level HIV and AIDS estimates for 2014 that reflect key changes in WHO HIV treatment guidelines for adults and children and for the prevention of mother-to-child transmission of HIV, in addition to improvements in assumptions of the probability of HIV transmission from mother to child and net survival rates for infected children. Furthermore, there are also more reliable data available from population-based surveys, expanded national sentinel surveillance systems and programme service statistics in a number of countries. Based on the refined methodology, UNAIDS has retrospectively generated new estimates of HIV prevalence, the number of people living with HIV and those needing treatment, AIDS-related deaths, new HIV infections and the number of children whose parents have died due to all causes including AIDS for past years. 114 THE STATE OF THE WORLD’S CHILDREN 2016
Only new estimates should be used for trend analysis. The new HIV and AIDS estimates included in this table are also published in the UNAIDS How AIDS Changed Everything, 2015. Overall, the global and regional figures published in The State of the World’s Children are not comparable to estimates previously published. More information on HIV and AIDS estimates, methodology and updates can be found at . TABLE 7. ECONOMIC INDICATORS National monetary child poverty has been added to Table 7 in 2016 to reflect Sustainable Development Goal 1, Target 1.2 that includes an explicit commitment to reduce poverty among children. This indicator measures “the percentage of children aged 0–17 years old living in households that have income or consumption level below the government defined national poverty threshold” . Data come from official government sources such as Statistical Office tabulations, national household survey and poverty reports and from regional databases such as Eurostat. Note that the methodology used to calculate national poverty prevalence varies by country. For instance, some countries using income and others consumption, some applying an absolute poverty line and others a relative poverty threshold. Therefore, national child poverty rates should be used to monitor progress, but should not be used to compare or rank countries. This indicator is the first of three child poverty indicators and will be supplemented with an international ‘extreme child poverty’ measure for Target 1 of SDG Goal 1 and national ‘multi- dimensional’ child poverty for Target 1.2. TABLE 8. WOMEN Maternal mortality ratio (adjusted): The table presents the ‘adjusted’ maternal mortality ratios for the year 2015, as published by the Maternal Mortality Estimation Inter-agency Group (MMEIG), composed of WHO, UNICEF, the United Nations Population Fund (UNFPA), The World Bank, and the United Nations Population Division, together with independent technical experts. To derive these estimates, the inter-agency group used a dual approach: making adjustments to correct misclassification and underreporting in existing estimates of maternal mortality from civil registration systems, and using a model to generate estimates for countries without reliable national-level estimates of maternal mortality. These ‘adjusted’ estimates should not be compared with previous inter-agency estimates. The full report – with complete country and regional estimates for the years 1990, 1995, 2000, 2005, 2010 and 2015, in addition to details on the methodology – can be found at . Post-natal care indicators: The period immediately following delivery or post- natal period is a critical phase in the lives of mothers and newborn babies as most maternal and infant deaths occur during this time. Given the critical importance of essential newborn care and postnatal care for the baby and the mother, household survey programs such as DHS and MICS have recently included indicators to track their coverage. Thus, two standard indicators related to early post-natal care for mothers and babies have been added to this table: Post-natal health check for newborns within 2 days after delivery and post-natal health check for mothers within 2 days after delivery. These two indicators are now part of the Every Newborn Action Plan (ENAP) global monitoring indicators. Even though both DHS and MICS strive at providing comparable results for the same indicator, data collection and reporting method for these indicators differs slightly between the two survey programs. Cross-country coverage results and regional aggregates should be analysed with caution. For the specific source for each data point please review the post-natal care database published on THE STATE OF THE WORLD’S CHILDREN 2016 115
as well as specific country reports available on the respective website of the survey programs (for MICS: see ; for DHS see ). TABLE 9. CHILD PROTECTION Birth registration: Changes in the definition of birth registration were made from the second and third rounds of MICS (MICS2 and MICS3) to the fourth round (MICS4). In order to allow for comparability with later rounds, data from MICS2 and MICS3 on birth registration were recalculated according to the MICS4 indicator definition. Therefore, the recalculated data presented here may differ from estimates included in MICS2 and MICS3 national reports. Child labour: The prevalence rates of child labour presented in the table vary widely across countries due to significant differences in survey methodology, questionnaire content, national definitions and thresholds used to establish child labour prevalence. Only a limited number of countries have produced child labour prevalence data based on international standards and classifications. Data from the fourth round of MICS (MICS4, 2009–2012) included in the table have been recalculated according to the indicator definition used in MICS3 surveys, to ensure cross-country comparability. In this definition, the activities of fetching water or collecting firewood are classified as household chores rather than as an economic activity. Under this approach, a child aged 5–14 would have to be engaged in fetching water or collecting firewood for at least 28 hours per week to be considered as a child labourer. Female genital mutilation/cutting (FGM/C): Data on the prevalence of FGM/C among girls aged 0–14 were recalculated for technical reasons and may differ from that presented in original DHS and MICS country reports. For further details, refer to Female Genital Mutilation/Cutting: A statistical overview and exploration of the dynamics of change, UNICEF, New York, 2013. Regional estimates on the prevalence of FGM/C and attitudes towards the practice are based on available data from only practising countries and therefore reflect the situation among those living in affected countries within the region, and not the region as a whole, as there are some non-practising countries in the region as well. Violent discipline: Estimates used in UNICEF publications and in MICS country reports prior to 2010 were calculated using household weights that did not take into account the last-stage selection of children for the administration of the child discipline module in MICS surveys. (A random selection of one child aged 2–14 is undertaken for the administration of the child discipline module.) In January 2010, it was decided that more accurate estimates are produced by using a household weight that takes the last-stage selection into account. MICS3 data were recalculated using this approach. TABLE 10. THE RATE OF PROGRESS Under-five mortality is used as the principal indicator of progress in child well-being. In 1970, about 17.2 million children under 5 years old were dying every year. In 2015, by comparison, the estimated number of children who died before their fifth birthday stood at 5.9 million – highlighting a significant long-term decline in the global number of under-five deaths. U5MR has several advantages as a gauge of child well-being: • First, U5MR measures an end result of the development process rather than an ‘input’ such as school enrolment level, per capita calorie availability or number of doctors per thousand population – all of which are means to an end. 116 THE STATE OF THE WORLD’S CHILDREN 2016
• Second, U5MR is known to be the result of a wide variety of inputs: for example, antibiotics to treat pneumonia; insecticide-treated mosquito nets to prevent malaria; the nutritional well-being and health knowledge of mothers; the level of immunization and oral rehydration therapy use; the availability of maternal and child health services, including antenatal care; income and food availability in the family; the availability of safe drinking water and basic sanitation; and the overall safety of the child’s environment. • Third, U5MR is less susceptible to the fallacy of the average than, for example, per capita gross national income (GNI). This is because the natural scale does not allow the children of the rich to be one thousand times more likely to survive, even if the human made scale does permit them to have one thousand times as much income. In other words, it is much more difficult for a wealthy minority to affect a nation’s U5MR, and this indicator therefore presents a more accurate, if far from perfect, picture of the health status of the majority of children and of society as a whole. The speed of progress in reducing child mortality can be assessed by calculating its annual rate of reduction (ARR). Unlike the comparison of absolute changes, ARR measures relative changes that reflect differences compared with the starting value. As lower levels of child mortality are reached, the same absolute reduction represents a greater percentage reduction. ARR therefore shows a higher rate of progress for a 10-point absolute reduction, for example, if that reduction happens at a lower level of child mortality versus a higher level over the same time period. A 10-point decrease in U5MR from 100 in 1990 to 90 in 2015 represents a reduction of 10 per cent, corresponding to an ARR of about 0.4 per cent, whereas the same 10-point decrease from 20 to 10 over the same period represents a reduction of 50 per cent, or an ARR of 2.8 per cent. (A negative value for the percentage reduction indicates an increase in U5MR during the period specified.) When used in conjunction with gross domestic product (GDP) growth rates, child mortality indicators and their rates of reduction can therefore give a picture of the progress being made by any country, area or region, over any period of time, towards the satisfaction of some of the most essential human needs. As Table 10 shows, there is no fixed relationship between the ARR of U5MR and the annual rate of growth in per capita GDP. Comparing these two indicators helps shed light on the relationship between economic advances and human development. Finally, the table gives the total fertility rate for each country and area and the corresponding ARR. It is clear that many of the nations that have achieved significant reductions in their U5MR have also achieved significant reductions in fertility. TABLES 12 AND 13. DISPARITIES BY RESIDENCE AND BY HOUSEHOLD WEALTH Stunting: Beginning in 2016, The State of the World’s Children no longer includes the disparities in underweight (weight-for-age) prevalence, and instead provides the breakdown for stunting (height-for-age). This is because stunting has gained precedence as a key global marker of child undernutrition and is now a focus of the SDG agenda, while underweight is no longer among the indicators to be used to track country, regional or global progress on nutrition. Underweight had been the indicator used to track MDG target 1.c. on nutrition of children under the age of 5 years, however, even during the MDG period, UNICEF and other partners had focused on progress in stunting as the marker of success. THE STATE OF THE WORLD’S CHILDREN 2016 117
TABLE 1. BASIC INDICATORS Annual Annual number Life Primary U5MR by Infant mortality Neonatal Total number of under-5 expectancy Total adult school net Under-5 mortality sex rate mortality population of births deaths GNI per at birth literacy rate enrolment Countries Under-5 rate (U5MR) 2015 (under 1) rate (thousands) (thousands) (thousands) capita (US$) (years) (%) ratio (%) mortality and areas rank 1990 2015 male female 1990 2015 2015 2015 2015 2015 2015 2015 2009−2014* 2010−2014* Afghanistan 16 181 91 95 87 123 66 36 32,527 1,081 94 680 61 32 – Albania 112 41 14 15 13 35 13 6 2,897 40 1 4,450 78 97 96 Algeria 79 47 26 27 24 40 22 16 39,667 936 24 5,490 75 73x 99 Andorra 182 9 3 3 3 8 2 1 70 – 0 43,270 x – – – Angola 1 226 157 165 149 134 96 49 25,022 1,128 169 c 53 71 84 Antigua and Barbuda 142 26 8 9 7 24 6 5 92 1 0 13,300 76 99 86 Argentina 120 28 13 14 11 24 11 6 43,417 753 10 13,480 76 98 100 Armenia 112 50 14 16 13 43 13 7 3,018 39 1 4,020 75 100 – Australia 166 9 4 4 3 8 3 2 23,969 318 1 64,540 83 – 97 Austria 166 10 4 4 3 8 3 2 8,545 82 0 49,670 82 – – Azerbaijan 68 95 32 34 29 76 28 18 9,754 193 7 7,590 71 100 95 Bahamas 125 24 12 13 11 20 10 7 388 6 0 20,980 76 – 98 Bahrain 153 23 6 6 6 20 5 1 1,377 20 0 21,060 x 77 95 – Bangladesh 61 144 38 40 35 100 31 23 160,996 3,134 119 1,080 72 60 95 Barbados 120 18 13 14 12 16 12 8 284 3 0 15,310 x 76 – 91 Belarus 159 17 5 5 4 14 3 2 9,496 112 1 7,340 71 100 94 Belgium 166 10 4 5 4 8 3 2 11,299 130 1 47,260 81 – 99 Belize 99 40 17 18 15 32 14 8 359 8 0 4,350 x 70 – 97 Benin 8 180 100 104 95 108 64 32 10,880 388 37 890 60 29x 96 Bhutan 67 134 33 36 30 93 27 18 775 13 0 2,370 70 53x 89 Bolivia (Plurinational State of) 61 124 38 42 35 86 31 20 10,725 253 9 2,870 69 92 88 Bosnia and Herzegovina 159 18 5 6 5 16 5 4 3,810 34 0 4,760 77 98 – Botswana 55 54 44 47 40 42 35 22 2,262 55 2 7,240 65 87 91 Brazil 104 61 16 18 15 51 15 9 207,848 3,016 52 11,530 75 90 – Brunei Darussalam 133 12 10 11 9 9 9 4 423 7 0 37,320 x 79 96 – Bulgaria 133 22 10 12 9 18 9 6 7,150 68 1 7,620 74 98 96 Burkina Faso 18 202 89 94 83 103 61 27 18,106 717 60 700 59 29x 68 Burundi 21 172 82 88 76 104 54 29 11,179 488 37 270 57 87x 96 Cabo Verde 80 63 25 27 22 48 21 12 521 11 0 3,450 74 85 98 Cambodia 71 117 29 32 25 85 25 15 15,578 371 10 1,020 69 74 95 Cameroon 19 138 88 94 82 86 57 26 23,344 847 71 1,350 56 71 95 Canada 159 8 5 5 5 7 4 3 35,940 387 2 51,630 82 – 99 Central African Republic 4 177 130 137 123 115 92 43 4,900 164 21 320 51 37 71 Chad 2 215 139 146 131 116 85 39 14,037 630 83 980 52 38 84 Chile 142 19 8 9 7 16 7 5 17,948 234 2 14,910 82 97 93 China 130 54 11 11 10 42 9 6 1,376,049 16,601 182 7,400 76 95 – Colombia 104 35 16 18 14 29 14 9 48,229 747 12 7,970 74 93 97x Comoros 25 125 74 79 68 88 55 34 788 26 2 790 64 77 85 Congo 52 94 45 49 41 61 33 18 4,620 167 7 2,720 63 79 93 Cook Islands 142 24 8 9 7 21 7 4 21 – 0 – – – 98 Costa Rica 133 17 10 11 9 14 9 6 4,808 70 1 10,120 80 97 96 Côte d'Ivoire 13 153 93 101 84 105 67 38 22,702 838 75 1,450 52 41 75 Croatia 166 13 4 5 4 11 4 3 4,240 40 0 12,980 77 99 98 Cuba 153 13 6 6 5 11 4 2 11,390 115 1 5,880 x 80 100 93 Cyprus 182 11 3 3 3 10 3 2 1,165 13 0 26,370 80 99 97 Czech Republic 182 15 3 4 3 13 3 2 10,543 107 0 18,370 79 – – Democratic People's Republic 80 43 25 28 22 33 20 14 25,155 360 9 a 71 100x 97x of Korea Democratic Republic 9 187 98 105 91 120 75 30 77,267 3,217 305 380 59 75 – of the Congo Denmark 166 9 4 4 3 7 3 3 5,669 59 0 61,310 80 – 99 Djibouti 32 119 65 71 59 93 54 33 888 22 1 b 62 – 65 Dominica 89 17 21 23 20 14 20 16 73 – 0 6,930 – – 97x Dominican Republic 70 60 31 34 28 47 26 22 10,528 216 7 6,040 74 90 86 Ecuador 84 57 22 24 19 44 18 11 16,144 331 7 6,090 76 92 97 Egypt 82 86 24 25 23 63 20 13 91,508 2,488 66 3,050 71 72 100 El Salvador 99 59 17 19 15 46 14 8 6,127 105 2 3,920 73 84 96 Equatorial Guinea 11 190 94 101 88 128 68 33 845 29 3 10,210 58 95 58 Eritrea 49 151 47 51 41 93 34 18 5,228 175 8 480x 64 72 41 Estonia 182 20 3 3 3 17 2 2 1,313 14 0 19,030 77 100 100 Ethiopia 37 205 59 65 54 122 41 28 99,391 3,176 184 550 65 39x 86 Fiji 84 30 22 24 20 25 19 10 892 18 0 4,870 70 – 97 Finland 193 7 2 3 2 6 2 1 5,503 59 0 48,420 81 – 100 France 166 9 4 5 4 7 4 2 64,395 782 3 42,960 82 – 99 118 THE STATE OF THE WORLD’S CHILDREN 2016
TABLE 1. BASIC INDICATORS Annual Annual number Life Primary U5MR by Infant mortality Neonatal Total number of under-5 expectancy Total adult school net Under-5 mortality sex rate mortality population of births deaths GNI per at birth literacy rate enrolment Countries Under-5 rate (U5MR) 2015 (under 1) rate (thousands) (thousands) (thousands) capita (US$) (years) (%) ratio (%) mortality and areas rank 1990 2015 male female 1990 2015 2015 2015 2015 2015 2015 2015 2009−2014* 2010−2014* Gabon 42 93 51 55 46 61 36 23 1,725 51 3 9,720 65 82 – Gambia 29 170 69 74 64 80 48 30 1,991 83 6 500x 60 53 69 Georgia 125 48 12 13 11 41 11 7 4,000 54 1 3,720 75 100 99 Germany 166 9 4 4 3 7 3 2 80,689 685 3 47,640 81 – 100 Ghana 35 127 62 67 56 80 43 28 27,410 884 54 1,590 62 71 89 Greece 159 13 5 5 4 11 4 3 10,955 92 0 22,680 x 81 97 97 Grenada 125 23 12 13 11 18 11 6 107 2 0 7,910 74 – 98 Guatemala 71 81 29 32 26 60 24 13 16,343 438 13 3,430 72 78 89 Guinea 11 238 94 99 88 141 61 31 12,609 460 42 470 59 25 76 Guinea-Bissau 13 229 93 100 85 136 60 40 1,844 68 6 550 55 58 69 Guyana 59 60 39 44 34 47 32 23 767 15 1 3,940 x 66 85 85 Haiti 29 146 69 75 63 101 52 25 10,711 263 18 820 63 49x – Holy See – – – – – – – – 1 – – – – – – Honduras 94 58 20 23 18 45 17 11 8,075 169 3 2,270 73 85 95 Hungary 153 19 6 6 5 17 5 4 9,855 92 1 13,340 75 99 96 Iceland 193 6 2 2 2 5 2 1 329 4 0 46,350 x 83 – 99 India 48 126 48 46 49 88 38 28 1,311,051 25,794 1,201 1,570 68 69 95 Indonesia 77 85 27 30 24 62 23 14 257,564 5,037 147 3,630 69 93 93 Iran (Islamic Republic of) 104 58 16 16 15 45 13 10 79,109 1,350 21 7,120 x 76 84 99 Iraq 68 54 32 35 29 42 27 18 36,423 1,244 39 6,500 70 79 – Ireland 166 9 4 4 3 8 3 2 4,688 68 0 46,550 81 – 99 Israel 166 12 4 4 4 10 3 2 8,064 167 1 35,320 83 – 97 Italy 166 10 4 4 3 8 3 2 59,798 501 2 34,270 83 99 99 Jamaica 104 31 16 18 14 25 14 12 2,793 48 1 5,150 76 88 – Japan 182 6 3 3 3 5 2 1 126,573 1,033 3 42,000 84 – 100 Jordan 96 37 18 19 17 30 15 11 7,595 199 4 5,160 74 93 88 Kazakhstan 112 53 14 16 12 45 13 7 17,625 377 6 11,850 70 100 99 Kenya 46 102 49 53 45 66 36 22 46,050 1,571 74 1,290 62 72x 86 Kiribati 39 96 56 61 51 69 44 24 112 3 0 2,950 66 – 98 Kuwait 139 18 9 9 8 15 7 3 3,892 75 1 49,300 75 96 98 Kyrgyzstan 89 65 21 24 19 54 19 12 5,940 154 4 1,250 71 99 98 Lao People's Democratic 31 162 67 73 61 111 51 30 6,802 179 12 1,660 67 73x 95 Republic Latvia 142 20 8 9 7 17 7 5 1,971 20 0 15,280 74 100 98 Lebanon 142 33 8 9 8 27 7 5 5,851 86 1 10,030 80 90x 89 Lesotho 17 88 90 97 83 71 69 33 2,135 61 6 1,330 50 76 81 Liberia 27 255 70 75 65 170 53 24 4,503 156 11 370 61 43x 38 Libya 120 42 13 15 12 36 11 7 6,278 129 2 7,820 72 90 – Liechtenstein – – – – – – – – 38 – – d – – 98 Lithuania 159 17 5 6 5 13 3 3 2,878 30 0 15,430 73 100 100 Luxembourg 193 9 2 2 2 7 2 1 567 6 0 75,990 82 – 95 Madagascar 44 161 50 54 45 98 36 20 24,235 831 40 440 66 64 – Malawi 33 242 64 68 60 143 43 22 17,215 665 40 250 64 61 98x Malaysia 148 17 7 8 6 14 6 4 30,331 509 4 11,120 75 93 – Maldives 139 94 9 9 8 68 7 5 364 8 0 6,410 77 98x 97x Mali 6 254 115 120 108 131 75 38 17,600 758 83 650 58 31 64 Malta 153 11 6 7 6 10 5 4 419 4 0 21,000 x 81 93 97 Marshall Islands 63 50 36 40 32 40 30 17 53 – 0 4,390 – – 100 Mauritania 20 118 85 96 80 78 65 36 4,068 134 11 1,270 63 46x 75 Mauritius 112 23 14 15 12 20 12 8 1,273 14 0 9,630 75 89 97 Mexico 120 47 13 14 12 37 11 7 127,017 2,346 31 9,870 77 93 97 Micronesia (Federated 65 56 35 38 31 43 29 19 104 2 0 3,200 69 – 87 States of) Monaco 166 8 4 4 3 6 3 2 38 – 0 d – – – Mongolia 84 108 22 27 18 77 19 11 2,959 69 2 4,280 70 98 96 Montenegro 159 17 5 5 4 15 4 3 626 7 0 7,320 76 98 94 Morocco 73 80 28 30 25 63 24 18 34,378 699 20 3,070 74 67 99 Mozambique 23 240 79 83 74 160 57 27 27,978 1,087 82 600 55 51 88 Myanmar 44 110 50 55 45 78 40 26 53,897 944 46 1,270 66 93 95 Namibia 52 74 45 49 41 50 33 16 2,459 72 3 5,630 65 76x 91 Nauru 65 57 35 39 32 44 29 23 10 – 0 – – – 87 Nepal 63 141 36 38 34 98 29 22 28,514 577 20 730 70 60 95 Netherlands 166 8 4 4 3 7 3 2 16,925 177 1 51,890 82 – 99 New Zealand 153 11 6 6 5 9 5 3 4,529 60 0 41,070 82 – 98 THE STATE OF THE WORLD’S CHILDREN 2016 119
TABLE 1. BASIC INDICATORS Annual Annual number Life Primary U5MR by Infant mortality Neonatal Total number of under-5 expectancy Total adult school net Under-5 mortality sex rate mortality population of births deaths GNI per at birth literacy rate enrolment Countries Under-5 rate (U5MR) 2015 (under 1) rate (thousands) (thousands) (thousands) capita (US$) (years) (%) ratio (%) mortality and areas rank 1990 2015 male female 1990 2015 2015 2015 2015 2015 2015 2015 2009−2014* 2010−2014* Nicaragua 84 67 22 25 20 51 19 10 6,082 121 3 1,870 75 78x 98 Niger 10 328 96 100 91 138 57 27 19,899 983 88 410 62 15 62 Nigeria 7 213 109 115 102 126 69 34 182,202 7,133 750 2,970 53 51x 66 Niue 83 14 23 25 20 12 20 13 2 – 0 – – – – Norway 182 9 3 3 2 7 2 2 5,211 61 0 103,630 82 – 100 Oman 125 39 12 13 10 32 10 5 4,491 81 1 16,870 x 77 87 97 Pakistan 22 139 81 85 77 106 66 46 188,925 5,451 432 1,400 66 55 73 Palau 104 36 16 18 15 31 14 9 21 – 0 11,110 – 100 99 Panama 99 31 17 19 15 26 15 10 3,929 75 1 11,130 78 94 97 Papua New Guinea 38 89 57 62 53 65 45 25 7,619 215 12 2,240 63 63 87 Paraguay 89 47 21 23 18 37 18 11 6,639 141 3 4,400 73 94 89 Peru 99 80 17 18 15 56 13 8 31,377 615 10 6,360 75 94 95 Philippines 73 58 28 31 25 41 22 13 100,699 2,349 66 3,500 68 95x 97 Poland 159 17 5 6 5 15 5 3 38,612 387 2 13,690 78 100 97 Portugal 166 15 4 4 3 12 3 2 10,350 83 0 21,360 81 94 99 Qatar 142 21 8 9 7 18 7 4 2,235 26 0 92,200 78 96 97 Republic of Korea 182 7 3 4 3 6 3 2 50,293 457 2 27,090 82 – 96 Republic of Moldova 104 33 16 18 14 27 14 12 4,069 43 1 2,560 72 99 91 Romania 130 38 11 12 10 31 10 6 19,511 179 2 9,520 75 99 91 Russian Federation 133 26 10 11 8 22 8 5 143,457 1,823 19 13,220 70 100 98 Rwanda 56 152 42 45 38 93 31 19 11,610 363 14 700 65 66 96 Saint Kitts and Nevis 130 28 11 11 10 23 8 7 56 – 0 14,920 – – 81 Saint Lucia 112 23 14 16 13 19 13 9 185 3 0 7,260 75 – – Saint Vincent and the 96 25 18 20 17 20 17 12 109 2 0 6,610 73 – 91 Grenadines Samoa 96 31 18 19 16 26 15 10 193 5 0 4,060 74 99 97 San Marino 182 11 3 3 3 10 3 1 32 – 0 d – – 93 Sao Tome and Principe 49 111 47 52 43 71 35 17 190 6 0 1,670 67 70x 96 Saudi Arabia 110 44 15 16 14 36 13 8 31,540 619 9 25,140 x 74 94 96 Senegal 49 140 47 54 44 70 42 21 15,129 567 27 1,050 67 52 73 Serbia 148 28 7 7 6 25 6 4 8,851 90 1 5,820 75 98 99 Seychelles 112 17 14 15 12 14 12 9 96 2 0 14,100 73 94 95 Sierra Leone 5 264 120 127 113 157 87 35 6,453 229 26 700 51 46 99 Singapore 182 8 3 3 3 6 2 1 5,604 50 0 55,150 83 96 – Slovakia 148 18 7 8 7 16 6 4 5,426 57 0 17,750 76 – – Slovenia 182 10 3 3 2 9 2 1 2,068 22 0 23,580 81 100 97 Solomon Islands 73 40 28 31 26 32 24 12 584 17 0 1,830 68 – – Somalia 3 180 137 143 130 108 85 40 10,787 471 61 a 56 – – South Africa 58 60 41 47 37 47 34 11 54,490 1,111 42 6,800 58 93 – South Sudan 13 253 93 98 87 150 60 39 12,340 446 39 970 56 27x 41 Spain 166 11 4 4 4 9 4 3 46,122 413 2 29,440 83 98 100 Sri Lanka 133 21 10 11 9 18 8 5 20,715 323 3 3,460 75 91 97 State of Palestine 89 44 21 23 19 36 18 12 4,668 151 3 3,060 73 95 93 Sudan 27 128 70 75 65 80 48 30 40,235 1,319 89 1,710 64 74 55 Suriname 89 48 21 24 19 41 19 12 543 10 0 9,950 71 95 91 Swaziland 36 75 61 65 56 56 45 14 1,287 38 2 3,550 49 83 79 Sweden 182 7 3 3 3 6 2 2 9,779 119 0 61,610 82 – 100 Switzerland 166 8 4 4 4 7 3 3 8,299 86 0 88,120 x 83 – 99 Syrian Arab Republic 120 37 13 14 12 30 11 7 18,502 438 6 b 70 86 71 Tajikistan 52 108 45 50 40 85 39 21 8,482 256 12 1,080 70 100 97 Thailand 125 37 12 14 11 30 11 7 67,959 715 9 5,780 75 96 96x The former Yugoslav Republic 153 37 6 6 5 33 5 4 2,078 23 0 5,150 76 98 88 of Macedonia Timor-Leste 41 176 53 57 48 132 45 22 1,185 44 3 2,680 69 58 98 Togo 24 146 78 84 72 90 52 27 7,305 256 20 570 60 60 93 Tonga 99 22 17 15 18 19 14 7 106 3 0 4,260 73 99 96 Trinidad and Tobago 94 31 20 22 18 27 18 13 1,360 19 0 20,070 71 99 99 Tunisia 112 57 14 15 13 44 12 8 11,254 202 3 4,230 75 79 100 Turkey 112 75 14 15 12 56 12 7 78,666 1,289 19 10,830 76 93 93 Turkmenistan 42 91 51 59 44 73 44 23 5,374 112 6 8,020 66 100 – Tuvalu 77 57 27 30 25 44 23 18 10 – 0 5,720 – – 96 Uganda 40 187 55 60 49 111 38 19 39,032 1,665 85 670 59 73 94 Ukraine 139 20 9 10 8 17 8 6 44,824 484 4 3,560 71 100 97 THE STATE OF THE WORLD’S CHILDREN 2016 120
TABLE 1. BASIC INDICATORS Annual Annual number Life Primary U5MR by Infant mortality Neonatal Total number of under-5 expectancy Total adult school net Under-5 mortality sex rate mortality population of births deaths GNI per at birth literacy rate enrolment Countries Under-5 rate (U5MR) 2015 (under 1) rate (thousands) (thousands) (thousands) capita (US$) (years) (%) ratio (%) mortality and areas rank 1990 2015 male female 1990 2015 2015 2015 2015 2015 2015 2015 2009−2014* 2010−2014* United Arab Emirates 148 17 7 8 6 14 6 4 9,157 98 1 44,600 77 90x 96 United Kingdom 166 9 4 5 4 8 4 2 64,716 813 3 43,430 81 – 100 United Republic of Tanzania 46 165 49 52 45 100 35 19 53,470 2,064 98 920 66 68 82 United States 148 11 7 7 6 9 6 4 321,774 4,025 25 55,200 79 – 93 Uruguay 133 23 10 11 9 20 9 5 3,432 49 0 16,350 77 98 100 Uzbekistan 59 72 39 44 34 59 34 20 29,893 667 26 2,090 69 100 95 Vanuatu 73 36 28 30 25 29 23 12 265 7 0 3,160 72 84 – Venezuela 110 30 15 17 13 25 13 9 31,108 599 9 12,500 x 74 95 93 (Bolivarian Republic of) Viet Nam 84 51 22 25 19 37 17 11 93,448 1,582 34 1,890 76 94 98 Yemen 56 126 42 46 38 89 34 22 26,832 856 34 1,300 x 64 68 85 Zambia 33 191 64 69 59 113 43 21 16,212 645 39 1,680 61 61x 89 Zimbabwe 26 76 71 76 65 51 47 24 15,603 539 38 840 59 84 89 SUMMARY Sub-Saharan Africa 180 83 89 77 108 56 29 1,001,417 36,812 2,947 1,661 59 60 79 Eastern and 167 67 72 62 103 46 25 480,144 16,694 1,068 1,610 61 67 84 Southern Africa West and Central Africa 198 99 105 92 116 66 32 480,150 18,778 1,789 1,703 57 53 74 Middle East and North Africa 71 29 31 27 53 23 15 455,880 11,039 324 6,561 72 79 90 South Asia 129 53 52 53 92 42 30 1,743,865 36,381 1,870 1,500 68 67 94 East Asia and Pacific 58 18 19 16 44 15 9 2,097,940 29,541 538 6,845 74 95 96 Latin America and Caribbean 54 18 20 16 43 15 9 628,992 10,772 196 9,634 75 92 94 CEE/CIS 48 17 19 15 39 15 9 413,760 6,084 108 9,216 72 99 95 Least developed countries 175 73 78 68 109 51 27 954,158 30,969 2,181 845 64 60 82 orld 91 43 44 41 63 32 19 7,309,846 140,244 5,945 10,647 72 85 91 W For a complete list of countries and areas in the regions, subregions and country categories, see page 112 or visit . It is not advisable to compare data from consecutive editions of The State of the World’s Children. DEFINITIONS OF THE INDICATORS MAIN DATA SOURCES Under-5 mortality rate – Probability of dying between birth and exactly 5 years of age, Under-5, infant and neonatal mortality rates – United Nations Inter-agency Group for Child expressed per 1,000 live births. Mortality Estimation (UNICEF, World Health Organization, United Nations Population Division Infant mortality rate – Probability of dying between birth and exactly 1 year of age, and the World Bank). expressed per 1,000 live births. Total population and births – United Nations Population Division. Neonatal mortality rate – Probability of dying during the first 28 completed days of life, Under-five deaths – United Nations Inter-agency Group for Child Mortality Estimation expressed per 1,000 live births. (UNICEF, World Health Organization, United Nations Population Division and the World Bank). GNI per capita – Gross national income (GNI) is the sum of value added by all resident GNI per capita – The World Bank. producers, plus any product taxes (less subsidies) not included in the valuation of output, plus Life expectancy at birth – United Nations Population Division. net receipts of primary income (compensation of employees and property income) from abroad. Total adult literacy rate and primary school enrolment ratio – UNESCO Institute for Gross national income per capita is GNI divided by midyear population. GNI per capita in US Statistics (UIS). dollars is converted using the World Bank Atlas method. Life expectancy at birth – Number of years newborn children would live if subject to the mortality risks prevailing for the cross section of population at the time of their birth. NOTES Total adult literacy rate – Percentage of population aged 15 years and over who can both a low-income country (GNI per capita is $1,045 or less). read and write with understanding a short simple statement on his/her everyday life. b lower-middle-income country (GNI per capita is $1,046 to $4,125). Primary school net enrolment ratio – Number of children enrolled in primary or secondary c upper-middle-income country (GNI per capita is $4,126 to $12,735). school who are of official primary school age, expressed as a percentage of the total number of d high-income country (GNI per capita is $12,736 or more). children of official primary school age. Because of the inclusion of primary-school-aged – Data not available. children enrolled in secondary school, this indicator can also be referred to as a primary adjusted net enrolment ratio. x Data refer to years or periods other than those specified in the column heading. Such data are not included in the calculation of regional and global averages. * Data refer to the most recent year available during the period specified in the column heading. THE STATE OF THE WORLD’S CHILDREN 2016 121
TABLE 2. NUTRITION Early Exclusive Introduction Minimum Underweight Stunting Wasting Overweight Vitamin A initiation breast- to solid, acceptable Breast- (%) (%) (%) (%) supplemen- Adequately Low of breast- feeding semi-solid or diet 6–23 feeding tation, full iodized salt birthweight feeding <6 months soft foods 6–8 months at age 2 coverageΔ consumption Countries (%) (%) (%) months (%) (%) (%) moderate & severeɵ (%) (%) and areas 2009–2013* 2010–2015* 2010–2015* 2014 2009–2013* Afghanistan – 54 – – – 54x 25 41 10 5 95α 20 Albania – 43x 39x 78x – 31x 6x 23x 9x 23x – 75 Algeria 6x 36 26 28 – 27 3 12 4 12 – 61x Andorra – – – – – – – – – – – – Angola 12x 55x – – – – 16x 29x 8x – 6α 45x Antigua and Barbuda 6 – – – – – – – – – – – Argentina 7 53 33 93 – 29 2x 8x 1x 10x – – Armenia 8 36 35 75 32 23 5 21 4 17 – 97x Australia 6 – – – – – 0x 2x 0x 8x – – Austria 7 – – – – – – – – – – – Azerbaijan 10x 20 12 77 22 16x 5 18 3 13 58α,w 54x Bahamas 12 – – – – – – – – – – – Bahrain 10 – 34x – – – – – – – – – Bangladesh 22x 57 55 42 23 87 33 36 14 1 0α 58 Barbados 12 40 20p – – – 4 8 7 12 – 17 Belarus 5 53 19 64 – 12 1x 5x 2x 10x – 85 Belgium 7 – – – – – – – – – – – Belize 11 62 15 69 – 35 6 19 3 8 – – Benin 15x 47 41 73 16 46 18 34 5 2 99α 86 Bhutan 10 78 51 87 – 61 13 34 6 8 –α –f Bolivia (Plurinational State of) 6x 78 64 83x – 40x 4 18 2 – –α –f Bosnia and Herzegovina 5 42 19 71 – 12 2 9 2 17 – 62x,y Botswana 13x 40x 20x – – 6x 11x 31x 7x 11x 70α 65x Brazil 9 43x 39x 94x – 26x 2x 7x 2x 7x – 96x Brunei Darussalam 12 – – – – – 10x 20x 3x 8x – – Bulgaria 9 – – – – – 2x 9x 3x 14x – 92 Burkina Faso 14 42 50 59 3 80 24 33 11 – 98α 34x,f Burundi 13 74 69 70 9 79 29 58 6 3 69α –f Cabo Verde 6x 73x 60x – – 13x – – – – – 75x Cambodia 11 63 65 82 30 37 24 32 10 2 71α –f Cameroon 11x 31 28 83 – 19 15 32 5 7 96α 85 Canada 6 – – – – – – – – 10x – – Central African Republic 14 44 34 59 – 32 24 41 7 2 34α 65 Chad 20 29 0 46 5 65 29 40 13 3 96α 54 Chile 6 – – – – – 1 2 0 9 – – China – 41x 28x 60x – 9x 3 9 2 7 – 97y Colombia 10 57 43 86 60 33 3 13 1 5 – – Comoros 25x 34 12 81 6 57 17 32 11 11 14α 77x,f Congo 13x 24 33 84 – 11 12 21 8 6 99α 73x,f Cook Islands – – – – – – – – – – – – Costa Rica 7 60 33 86 – 28 1x 6x 1x 8x – – Côte d'Ivoire 17x 31 12 64 5 38 16 30 8 3 99α 30x,f Croatia 5 – 23x – – – – – – – – – Cuba 5 48 33 91 56 24 3x 7x 2x – – 88x Cyprus 12x – – – – – – – – – – – Czech Republic 8 – – – – – 2x 3x 5x 4x – – Democratic People's Republic 6 28 69 66 – 22 15 28 4 – 99α 25 of Korea Democratic Republic 10 52 48 79 8 66 23 43 8 4 99α 59 of the Congo Denmark 5 – – – – – – – – – – – Djibouti 10x 55x 1x 35x – 18x 30 34 22 8 –α 0x Dominica 11 – – – – – – – – – – – Dominican Republic 11x 43 5 81 38 12 4 7 2 8 – –f Ecuador 9 55 40x 74 – 19 6 25 2 8 – – Egypt 13x 27 40 77 23 20 7 22 10 16 –α 78x El Salvador 9 42 47 90 – 57 5 14 2 6 – 62x Equatorial Guinea 13x 21 7 76 11 5 6 26 3 10 –α –f Eritrea 14x 93 69 40x – 73 39 50 15 2 49α 68x Estonia 5 – – – – – – – – – – – Ethiopia 20x 52 52 49 4 82 25 40 9 3 71α 20x,f Fiji 10x 57x 40x – – – 5x 8x 6x 5x – – Finland 4 – – – – – – – – – – – France 7 – – – – – – – – – – – THE STATE OF THE WORLD’S CHILDREN 2016 122
TABLE 2. NUTRITION Early Exclusive Introduction Minimum Underweight Stunting Wasting Overweight Vitamin A initiation breast- to solid, acceptable Breast- (%) (%) (%) (%) supplemen- Adequately Low of breast- feeding semi-solid or diet 6–23 feeding tation, full iodized salt birthweight feeding <6 months soft foods 6–8 months at age 2 coverageΔ consumption Countries (%) (%) (%) months (%) (%) (%) moderate & severeɵ (%) (%) and areas 2009–2013* 2010–2015* 2010–2015* 2014 2009–2013* Gabon 14x 32 6 82 – 4 7 18 3 8 –α –f Gambia 10 52 47 47 8 42 16 25 12 3 27α 22 Georgia 7 69 55x 85x – 17x 1x 11x 2x 20x – 100 Germany 7 – – – – – 1x 1x 1x 4x – – Ghana 11 56 52 73 13 50 11 19 5 3 23α 35 Greece 10 – – – – – – – – – – – Grenada 9 – 39x – – – – – – – – – Guatemala 11 56x 53 – 51 57 13 47 1 5 19α –f Guinea 12x 17 21 43 4 66 19 31 10 4 –α –f Guinea-Bissau 11 34 53 71 – 51 17 28 6 2 98α 12 Guyana 14 49 23 81 30 41 9 12 6 5 – 10 Haiti 23 47 40 87 14 31 12 22 5 4 30α 3x,f Holy See – – – – – – – – – – – – Honduras 10 64 31 70 54 43 7 23 1 5 –α – Hungary 9 – – – – – – – – – – – Iceland 4 – – – – – – – – – – – India 28x 41x 46x 56x – 77x,y 29 39 15 – 61α 71 Indonesia 9x 49 42 91 37 55 20 36 14 12 84α 58 Iran (Islamic Republic of) 8 69 53 76 – 51 4 7 4 – – –f Iraq 13 43 20 36 – 23 9 23 7 12 – 29 Ireland 5 – – – – – – – – – – – Israel 8 – – – – – – – – – – – Italy 7 – – – – – – – – – – – Jamaica 11 65 24 55 – 31 3 6 3 8 – – Japan 10 – – – – – 3 7 2 2 – – Jordan 13x 19 23 92 33 13 3 8 2 5 – –f Kazakhstan 6 68 32 49 – 26 4 13 4 13 –α 85 Kenya 8 62 61 80 22 53 11 26 4 4 28α 93 Kiribati 8 – 69x – – 82x 15x – – – –α – Kuwait 8 – 12x – – 9x 3 6 2 9 – – Kyrgyzstan 6 83 41 85 36 23 3 13 3 7 –α 76x Lao People's Democratic 15 39 40 52 – 40 27 44 6 2 89α –f Republic Latvia 5 – – – – – – – – – – – Lebanon 12 41x 27x – – 11x 4x 17x 7x 17x – 71 Lesotho 11 53x 67 68x 11 30 10 33 3 7 67α 79 Liberia 14x 61 55 46 4 44 15 32 6 3 0α – Libya – – – – – – 6x 21x 7x 22x – – Liechtenstein – – – – – – – – – – – – Lithuania 5 – – – – – – – – – – – Luxembourg 7 – – – – – – – – – – – Madagascar 16 66 42 90 – 83 37x 49x 15x 6x 99α 50 Malawi 14 75 70 89 14 75 17 42 4 5 41α 62 Malaysia 11 – 29x – – – 13x 17x – – – – Maldives 11 64x 48x 91x – 68x 18x 20x 10x 7x –α 44x Mali 18 46x 38x 27x – 56x 28x 39x 15x 5x –α 74x Malta 7 – – – – – – – – – – – Marshall Islands 18x 73x 31x – – 53x – – – – –α – Mauritania 35 56 27 48 – 36 20 22 12 1 89α 7 Mauritius 14x – 21x – – – – – – – – – Mexico 9 39 14 95 – 14 3 14 2 9 –α 91x Micronesia (Federated 11 – 60x – – – – – – – –α – States of) Monaco 6 – – – – – – – – – – – Mongolia 5 71 47 95 – 53 2 11 1 11 79α 70 Montenegro 5 14 17 95 66 9 1 9 3 22 – 71x Morocco 15x 30 28 86x – 15x 3 15 2 11 –α 21x Mozambique 17 69 41 95 11 52 16 43 6 8 99α 25f Myanmar 9 76 24 76 – 65 23 35 8 3 94α 69 Namibia 16x 71 49 80 13 21 13 23 7 4 –α 57x Nauru 27x 76x 67x – – 65x 5x 24x 1x 3x – – Nepal 18 49 57 74 32 87 30 37 11 2 85α 80 Netherlands 6 – – – – – – – – – – – New Zealand 6 – – – – – – – – – – – THE STATE OF THE WORLD’S CHILDREN 2016 123
TABLE 2. NUTRITION Early Exclusive Introduction Minimum Underweight Stunting Wasting Overweight Vitamin A initiation breast- to solid, acceptable Breast- (%) (%) (%) (%) supplemen- Adequately Low of breast- feeding semi-solid or diet 6–23 feeding tation, full iodized salt birthweight feeding <6 months soft foods 6–8 months at age 2 coverageΔ consumption Countries (%) (%) (%) months (%) (%) (%) moderate & severeɵ (%) (%) and areas 2009–2013* 2010–2015* 2010–2015* 2014 2009–2013* Nicaragua 8 68 32 – – 43 6x 23x 2x 6x 4α 97x Niger 27x 53 23 – 6 50 38 43 19 3 95α 19 Nigeria 15 33 17 67 10 35 20 33 8 2 80α 80 Niue – – – – – – – – – – – – Norway 5 – – – – – – – – – – – Oman 10 71 33 90 – 48 10 14 8 4 – –f Pakistan 32x 18 38 66 15 56 32 45 11 5 96α 69 Palau 7 – – – – – – – – – – – Panama 8 47 22 61 – 34 4x 19x 1x – – – Papua New Guinea 11x – 56x – – 72x 28 50 14 14 –α – Paraguay 6 47x 24x – – 14x 3 11 3 12 – 93y Peru 7 55 68 82 – 55y 3 15 1 – – 88 Philippines 21x 50 34x 90x – 41 20 30 8 5 83α 45x Poland 6 – – – – – – – – – – – Portugal 9 – – – – – – – – – – – Qatar 8 34 29 50 – 32 – – – – – – Republic of Korea 4x – – – – – 1 3 1 7 – – Republic of Moldova 6 61 36 62 – 12 2 6 2 5 – 44 Romania 8 12x 16x – – – 4x 13x 4x 8x – 74x Russian Federation 6 – – – – – – – – – – –f Rwanda 7 71 87 79 17 87 9 38 2 8 95α 87x,f Saint Kitts and Nevis 10 – – – – – – – – – – –f Saint Lucia 10 50 – – – – 3 3 4 6 – 46 Saint Vincent and 11 – – – – – – – – – – – the Grenadines Samoa 10 88x 51x – – 74x – – – – – – San Marino 10 – – – – – – – – – – – Sao Tome and Principe 10 38 74 74 – 24 9 17 4 2 –α 65 Saudi Arabia 9 – – – – 30x 5x 9x 12x 6x – – Senegal 19 30 33 63 8 41 13 19 6 1 89α 43 Serbia 6 51 13 97 72 9 2 6 4 14 – 32x Seychelles – – – – – – – – – – – – Sierra Leone 11 54 32 63 7 48 18 38 9 9 8α 63 Singapore 10 – – – – – 3x 4x 4x 3x – – Slovakia 8 – – – – – – – – – – – Slovenia 6 – – – – – – – – – – – Solomon Islands 13x 75x 74x – – 67x 12x 33x 4x 3x – – Somalia – 23x 5x 16x – 27x 23x 26x 15x 3x 30α 4y South Africa – 61x 8x – – 31x 9x 24x 5x – –α – South Sudan – 48 45 21 – 38 28 31 23 6 18α 45 Spain 8 – – – – – – – – – – – Sri Lanka 17x 80x 76x – – 84x 26 15 21 1 72α 92x State of Palestine 9 41 39 90 42 12 1 7 1 8 – 77 Sudan – 69 55 51 – 49 33 38 16 3 99α 10 Suriname 14 45 3 47 – 15 6 9 5 4 – – Swaziland 9 48 64 90 – 8 6 26 2 9 43α 52 Sweden 5 – – – – – – – – – – – Switzerland 7 – – – – – – – – – – – Syrian Arab Republic 10 46 x 43x – – 25x 10x 28x 12x 18x – 79x Tajikistan 10x 50 34 49 20 50 13 27 10 7 99α 39 Thailand 11 46 12 75 – 18 9 16 7 11 – 71 The former Yugoslav Republic 6 21 23 41 – 13 1 5 2 12 – 94x,y of Macedonia Timor-Leste 12x 93 62 97 18 39 38 50 11 2 –α 60x Togo 11 61 58 67 12 61 16 28 7 2 –α 32 Tonga – 79 52 – – 30 2 8 5 17 – – Trinidad and Tobago 12 41x 13x 83x – 22x 4x 5x 5x 5x – 28x Tunisia 7 40 9 27 – 19 2 10 3 14 – 97x Turkey 11x 50 30 – – 34 2 10 2 11 – 69x Turkmenistan 5 60x 11x – – 37x 9x 19x 7x 5x –α 75x,f Tuvalu 6x 15x 35x – – 51x 2x 10x 3x 6x – – Uganda 12 53 63 67 6 46 12 34 4 6 66α 87x,f Ukraine 5 66 20 43 – 22 1x 4x 0x – – 21 United Arab Emirates 6 – 34x – – 29x – – – – – – THE STATE OF THE WORLD’S CHILDREN 2016 124
TABLE 2. NUTRITION Early Exclusive Introduction Minimum Underweight Stunting Wasting Overweight Vitamin A initiation breast- to solid, acceptable Breast- (%) (%) (%) (%) supplemen- Adequately Low of breast- feeding semi-solid or diet 6–23 feeding tation, full iodized salt birthweight feeding <6 months soft foods 6–8 months at age 2 coverageΔ consumption Countries (%) (%) (%) months (%) (%) (%) moderate & severeɵ (%) (%) and areas 2009–2013* 2010–2015* 2010–2015* 2014 2009–2013* United Kingdom 7 – – – – – – – – – – – United Republic of Tanzania 8 51 41 90 – 48 13 35 4 – 88α 56 United States 8 – – – – – 1 2 1 6 – – Uruguay 8 77 – – – – 4 11 1 7 – – Uzbekistan 5x 67x 26x 47x – 38x 4x 20x 5x 13x 99α 53x Vanuatu 10x 85 73 72 – 49 11 29 4 5 – 23x Venezuela 9 – 7x – – – 3x 13x 4x 6x – – (Bolivarian Republic of) Viet Nam 5 27 24 91 59 22 12 19 6 5 94α,w 45 Yemen 32 53 10 69 15 45 16 47 16 2 7α 30x Zambia 11x 66 73 82 11 42 15 40 6 6 –α 64x Zimbabwe 11 59 41 87 13 17 11 28 3 4 32α –f SUMMARY Sub-Saharan Africa 13 49 40 69 9 52 19 36 8 4 74 59 Eastern and Southern Africa 11 59 54 73 10 60 16 36 6 5 62 – West and Central Africa 14 40 29 68 9 46 22 35 10 4 83 65 Middle East and North Africa – 45 35 61 – 33 7 18 8 9 – – South Asia 28 39 46 57 – 75 30 37 15 4 62 69 East Asia and Pacific – 44 31 69 41** 24 5 11 4 6 86 86 Latin America and Caribbean 9 49 32 88 – 28 3 10 1 7 – – CEE/CIS (excluding the Russian 6 54 27 – – 29 2 10 2 14 – – Federation) Least developed countries 14 55 47 66 11 63 – – – – 67 50 World 16** 44 39 66 – 49 14 24 8 5 69 75 For a complete list of countries and areas in the regions, subregions and country categories, see page 112 or visit . It is not advisable to compare data from consecutive editions of The State of the World’s Children. DEFINITIONS OF THE INDICATORS MAIN DATA SOURCES Low birthweight – Percentage of infants weighing less than 2,500 grams at Low birthweight – Demographic and Health Surveys (DHS), Multiple Indicator Cluster Surveys (MICS), other birth. national household surveys, data from routine reporting systems, UNICEF and WHO. Early initiation of breastfeeding – Percentage of infants who are put to the Infant and young child feeding – DHS, MICS, other national household surveys and UNICEF. breast within one hour of birth. Underweight, stunting, wasting and overweight – DHS, MICS, other national household surveys, WHO and Exclusive breastfeeding <6 months – Percentage of children aged 0–5 months UNICEF. who are fed exclusively with breast milk in the 24 hours prior to the survey. Vitamin A supplementation – UNICEF. Introduction of solid, semi-solid or soft foods (6–8 months) – Percentage of Adequately iodized salt consumption – DHS, MICS, other national household surveys and UNICEF. children aged 6–8 months who received solid, semi-solid or soft foods in the 24 hours prior to the survey. NOTES Minimum acceptable diet (6–23 months) – Percentage of breastfed children – Data not available. 6–23 months of age who had at least the minimum dietary diversity and the x Data refer to years or periods other than those specified in the column heading. Such data are not included in the minimum meal frequency during the previous day AND percentage of calculation of regional and global averages, with the exception of 2005–2006 and 2007–2008 data from India, and non-breastfed children 6–23 months of age who received at least 2 milk feedings 2008 data from China. Estimates from data years prior to 2000 are not displayed. and had at least the minimum dietary diversity not including milk feeds and the minimum meal frequency during the previous day. y Data differ from the standard definition or refer to only part of a country. If they fall within the noted reference Breastfeeding at age 2 – Percentage of children aged 20–23 months who period, such data are included in the calculation of regional and global averages. received breast milk in the 24 hours prior to the survey. p Based on small denominators (typically 25–49 unweighted cases). No data based on fewer than 25 unweighted Underweight – Moderate and severe: Percentage of children aged 0–59 months cases are displayed. who are below minus two standard deviations from median weight-for-age of the ɵ Regional averages for underweight (moderate and severe), stunting (moderate and severe), wasting (moderate and World Health Organization (WHO) Child Growth Standards. severe) and overweight (moderate and severe) are estimated using statistical modeling of data from the UNICEF- Stunting – Moderate and severe: Percentage of children aged 0–59 months who WHO-World Bank Joint Global Nutrition Database, 2015 revision. For more information see . Child Growth Standards. r Full coverage with vitamin A supplements is reported as the lower percentage of 2 annual coverage points Wasting – Moderate and severe: Percentage of children aged 0–59 months who (i.e., lower point between semester 1 (January–June) and semester 2 (July–December) of 2014). Data are only are below minus two standard deviations from median weight-for-height of the presented for VAS priority countries; thus aggregates are only based on and representative of these priority countries. WHO Child Growth Standards. w Identifies countries with national vitamin A supplementation programmes targeted towards a reduced age range. Overweight – Moderate and severe: Percentage of children aged 0–59 months Coverage figure is reported as targeted. who are above two standard deviations from median weight-for-height of the α Identifies countries that are designated ‘priority’. Priority countries for national vitamin A supplementation WHO Child Growth Standards. programmes are identified as those having high under-five mortality rates (over 70 per 1,000 live births), and/or Vitamin A supplementation, full coverage – The estimated percentage of evidence of vitamin A deficiency among this age group, and/or a history of vitamin A supplementation programmes. children aged 6–59 months reached with 2 doses of vitamin A supplements f The most recent survey for this country uses an indicator definition that is not in line with the international approximately 4–6 months apart in a given calendar year. standard. If available, a previous data point that conforms to the standard definition is presented instead. Adequately iodized salt consumption – Percentage of households consuming * Data refer to the most recent year available during the period specified in the column heading. adequately iodized salt (15 parts per million or more based on rapid test kits). ** Excludes China. THE STATE OF THE WORLD’S CHILDREN 2016 125
TABLE 3. HEALTH Immunization coverage (%) Pneumonia Diarrhoea Malaria Use of improved Use of improved Care seeking Treatment Care House- drinking water sanitation Newborns for children with oral seeking for Children holds sources (%) facilities (%) protected with rehydration children sleeping with at against symptoms of salts (ORS) with fever under ITNs least one 2015 2015 BCG DTP1β β tetanusλ pneumonia (%) (%) (%) (%) ITN (%) Countries DTP3 polio3 MCV1 HepB3 Hib3 rota PCV3 and areas total urban rural total urban rural 2014 2010–2015* 2010–2015* 2010–2015* Afghanistan 55 78 47 32 45 27 86 82 75 75 66 75 75 0 40 70 61 53 – – – Albania 95 95 95 93 95 90 99 99 98 98 98 98 98 0 99 92 70x 54x 71x – – Algeria 84 84 82 88 90 82 99 99 95 95 95 95 95 0 0 92 66 25 – – – Andorra 100 100 100 100 100 100 – 99 97 97 96 96 97 0 93 – – – – – – Angola 49 75 28 52 89 22 81 99 80 81 85 80 80 18 61 78 – – – 26 35 Antigua and Barbuda 98 – – – – – – 99 99 96 98 99 99 0 0 – – – – – – Argentina 99 99 100 96 96 98 99 98 94 92 95 94 94 0 89 – 94 18 – – – Armenia 100 100 100 89 96 78 99 97 93 95 97 93 93 91 0 – 57 33 54 – – Australia 100 100 100 100 100 100 – 92 92 92 93 91 91 84 91 – – – – – – Austria 100 100 100 100 100 100 – 93 83 83 76 83 83 61 0 – – – – – – Azerbaijan 87 95 78 89 92 87 98 96 94 97 98 94 94 0 64 – 36x 11 – 1x – Bahamas 98 – – 92 – – – 96 96 96 92 96 96 0 96 99 – – – – – Bahrain 100 – – 99 99 99 – 99 99 99 99 99 99 97 98 98 – – – – – Bangladesh 87 87 87 61 58 62 99 97 95 95 89 95 95 0 0 96 42 77 27 – – Barbados 100 – – 96 96 96 – 98 94 95 95 94 94 0 90 – – – – – – Belarus 100 100 99 94 94 95 98 97 97 97 99 97 20 0 0 – 93 45 – – – Belgium 100 100 100 99 99 99 – 99 99 99 96 98 98 86 93 – – – – – – Belize 100 99 100 91 93 88 98 96 95 95 95 95 95 0 0 91 82 23 – – – Benin 78 85 72 20 36 7 88 84 70 72 63 70 70 0 70 93 23 50 44 73 81 Bhutan 100 100 100 50 78 33 99 99 99 98 97 99 99 0 0 83 74 61 – – – Bolivia (Plurinational State of) 90 97 76 50 61 28 99 98 94 95 95 94 94 99 56 87 62 22 – – – Bosnia and Herzegovina 100 100 100 95 99 92 98 92 86 86 89 89 79 0 0 – 87 36 – – – Botswana 96 99 92 63 79 43 98 98 95 96 97 95 96 82 81 92 14x 49x 75x – – Brazil 98 100 87 83 88 52 99 99 93 96 97 96 95 92 93 93 50x – – – – Brunei Darussalam – – – – – – 99 99 99 99 97 99 96 0 0 95 – – – – – Bulgaria 99 100 99 86 87 84 97 90 88 88 93 95 83 0 92 – – – – – – Burkina Faso 82 97 76 20 50 7 98 95 91 91 88 91 91 91 91 89 56 21 61 75 90 Burundi 76 91 74 48 44 49 92 98 95 95 94 95 95 96 95 85 55 38 59 54 63 Cabo Verde 92 94 87 72 82 54 99 99 95 95 93 95 95 0 0 92 – – – – – Cambodia 76 100 69 42 88 30 93 99 97 98 94 97 97 0 0 91 69 34 61 4x 5x Cameroon 76 95 53 46 62 27 82 93 87 86 80 87 87 46 87 85 28 17 33 55 71 Canada 100 100 99 100 100 99 – 98 96 96 95 75 96 0 97 – – – – – – Central African Republic 68 90 54 22 44 7 74 69 47 47 49 47 47 0 47 60 30 16 – 36 47 Chad 51 72 45 12 31 6 59 60 46 54 54 46 46 0 0 60 26 20 36 36 77 Chile 99 100 93 99 100 91 98 96 92 92 94 92 92 0 89 – – – – – – China 95 98 93 76 87 64 99 99 99 99 99 99 0 0 0 – – – – – – Colombia 91 97 74 81 85 68 89 91 90 91 91 90 90 89 89 85 64 54 54 – 3x Comoros 90 93 89 36 48 31 76 83 80 79 80 80 80 0 0 85 38 38 45 41 59 Congo 76 96 40 15 20 6 95 95 90 90 80 90 90 60 69 85 28 28 51 61 66 Cook Islands 100 – – 98 98 98 99 99 99 99 98 99 99 0 0 – – – – – – Costa Rica 98 100 92 95 95 92 80 91 91 91 95 91 91 0 83 – 77 40 – – – Côte d'Ivoire 82 93 69 22 33 10 84 78 67 66 63 67 67 0 2 82 38 17 43 37 67 Croatia 100 100 100 97 98 96 98 98 95 95 94 95 95 0 0 – – – – – – Cuba 95 96 90 93 94 89 99 98 96 99 99 96 96 0 0 – 93 61 93 – – Cyprus 100 100 100 100 100 100 – 99 99 99 86 96 96 0 0 – – – – – – Czech Republic 100 100 100 99 99 99 – 99 99 99 99 99 99 0 0 – – – – – – Democratic People's Republic 100 100 99 82 88 73 98 94 93 99 99 93 93 0 0 93 80x 74x – – – of Korea Democratic Republic 52 81 31 29 29 29 90 81 80 79 77 80 80 0 61 82 42 39 55 56 70 of the Congo Denmark 100 100 100 100 100 100 – 96 94 94 90 0 94 0 93 – – – – – – Djibouti 90 97 65 47 60 5 86 93 78 78 71 78 78 0 78 80 94 94 – 20x 32 Dominica – 96 – – – – 98 99 97 97 94 97 97 0 0 – – – – – – Dominican Republic 85 85 82 84 86 76 99 91 91 90 88 89 87 86 27 90 73 48 65 – – Ecuador 87 93 76 85 87 81 89 84 83 84 85 83 83 81 90 85 – 46 – – – Egypt 99 100 99 95 97 93 96 96 94 94 93 94 94 0 0 86 68 28 68 – – El Salvador 94 97 87 75 82 60 96 96 93 93 94 93 93 96 92 90 80 58x – – – Equatorial Guinea 48 73 31 75 80 71 71 65 24 30 44 24 24 0 0 70 54 40 62 23 38 Eritrea 58 73 53 16 45 7 97 97 94 94 96 94 94 25 0 94 45 43 – 20 71x Estonia 100 100 99 97 98 97 95 95 93 93 93 93 93 32 0 – – – – – – Ethiopia 57 93 49 28 27 28 75 86 77 75 70 77 77 63 76 80 27 26 24 30 47 Fiji 96 100 91 91 93 88 99 99 99 99 94 99 99 99 99 94 – – – – – Finland 100 100 100 98 99 88 – 99 98 98 97 0 98 93 0 – – – – – – THE STATE OF THE WORLD’S CHILDREN 2016 126
TABLE 3. HEALTH Immunization coverage (%) Pneumonia Diarrhoea Malaria Use of improved Use of improved Care seeking Treatment Care House- drinking water sanitation Newborns for children with oral seeking for Children holds sources (%) facilities (%) protected with rehydration children sleeping with at against symptoms of salts (ORS) with fever under ITNs least one 2015 2015 BCG DTP1β β tetanusλ pneumonia (%) (%) (%) (%) ITN (%) Countries DTP3 polio3 MCV1 HepB3 Hib3 rota PCV3 and areas total urban rural total urban rural 2014 2010–2015* 2010–2015* 2010–2015* France 100 100 100 99 99 99 – 99 99 99 90 82 98 0 89 – – – – – – Gabon 93 97 67 42 43 32 91 77 70 68 61 70 70 0 0 85 68 26 67 39 36 Gambia 90 94 84 59 62 55 96 98 96 97 96 96 96 92 96 92 68 59 65 47 69 Georgia 100 100 100 86 95 76 96 99 91 91 92 91 91 69 0 – 74x 40x – – – Germany 100 100 100 99 99 99 – 98 96 95 97 87 94 0 68 – – – – – – Ghana 89 93 84 15 20 9 99 99 98 98 92 98 98 98 98 88 56 49 77 47 68 Greece 100 100 100 99 99 98 – 99 99 99 97 96 99 0 96 – – – – – – Grenada 97 – – 98 98 98 – 97 97 81 94 97 97 0 0 – – – – – – Guatemala 93 98 87 64 78 49 91 89 73 65 67 73 73 54 51 85 50 49 49 – – Guinea 77 93 67 20 34 12 72 60 51 42 52 51 51 0 0 80 37 34 37 26 47 Guinea-Bissau 79 99 60 21 34 8 94 92 80 78 69 80 80 0 0 80 34 19 51 81 90 Guyana 98 98 98 84 88 82 99 98 98 97 99 98 98 95 97 99 84 43 71 7 5 Haiti 58 65 48 28 34 19 76 72 48 55 53 48 48 40 0 81 38 53 40 12 19 Holy See – – – – – – – – – – – – – – – – – – – – – Honduras 91 97 84 83 87 78 86 86 85 85 88 85 85 85 85 94 64 60 62 – – Hungary 100 100 100 98 98 99 99 99 99 99 99 0 99 0 93 – – – – – – Iceland 100 100 100 99 99 100 – 96 90 90 90 0 90 0 90 – – – – – – India 94 97 93 40 63 28 91 90 83 82 83 70 20 0 0 87 77 26x 71x – – Indonesia 87 94 79 61 72 47 93 94 78 79 77 78 21 0 0 85 75 39 74 3x 3x Iran (Islamic Republic of) 96 98 92 90 93 82 99 99 99 99 99 99 0 0 0 95 76 61 – – – Iraq 87 94 70 86 86 84 95 77 64 67 57 62 64 29 0 72 74 23 – – – Ireland 98 98 98 90 89 93 74 98 96 96 93 95 96 0 92 – – – – – – Israel 100 100 100 100 100 100 – 95 94 94 96 97 94 93 93 – – – – – – Italy 100 100 100 100 99 100 – 98 94 94 86 94 94 0 55 – – – – – – Jamaica 94 97 89 82 80 84 90 97 92 94 92 92 92 0 0 80 82 64 – – – Japan 100 100 100 100 100 100 93 99 98 99 98 0 0 0 0 – – – – – – Jordan 97 98 92 99 99 99 95 98 98 98 98 98 98 0 0 90 77 20 69 – – Kazakhstan 93 99 86 98 97 98 95 96 95 95 99 95 95 0 58 – 81 62 – – – Kenya 63 82 57 30 31 30 81 88 81 81 79 81 81 19 81 76 66 54 72 54 59 Kiribati 67 87 51 40 51 31 72 83 75 79 91 75 75 0 57 – 81x 62x 27x – – Kuwait 99 99 99 100 100 100 99 97 95 94 94 96 95 0 94 95 – – – – – Kyrgyzstan 90 97 86 93 89 96 97 96 96 95 96 96 96 0 0 – 60 33 56 – – Lao People's Democratic 76 86 69 71 94 56 82 94 88 88 87 88 88 0 72 90 54 42 – 43 50 Republic Latvia 99 100 98 88 91 82 92 93 92 92 95 92 92 0 87 – – – – – – Lebanon 99 – – 81 81 81 – 84 81 75 79 81 81 0 0 – 74x 44x – – – Lesotho 82 95 77 30 37 28 87 97 96 95 92 96 96 0 0 83 63 53 61 – – Liberia 76 89 63 17 28 6 73 74 50 49 58 50 50 0 45 89 51 60 71 38 55 Libya – – – 97 97 96 99 96 94 94 93 94 94 86 39 – – – – – – Liechtenstein – – – – – – – – – – – – – – – – – – – – – Lithuania 97 100 90 92 97 83 98 97 93 93 93 94 93 0 0 – – – – – – Luxembourg 100 100 100 98 98 99 – 99 99 99 99 94 99 89 95 – – – – – – Madagascar 52 82 35 12 18 9 75 83 73 73 64 73 73 50 72 78 41 15 48 62 68 Malawi 90 96 89 41 47 40 97 97 91 87 85 91 91 83 87 89 68 64 75 66 78 Malaysia 98 100 93 96 96 96 99 99 97 97 94 96 97 0 0 90 – – – – – Maldives 99 100 98 98 97 98 99 99 99 99 99 99 99 0 0 95 22x 57x 84x – – Mali 77 97 64 25 38 16 79 80 77 84 80 77 77 13 84 85 38x 14x 59 27x 85 Malta 100 100 100 100 100 100 – 99 99 99 98 90 99 0 0 – – – – – – Marshall Islands 95 94 98 77 84 56 89 97 78 77 79 79 65 44 29 – – 38x 63x – – Mauritania 58 58 57 40 58 14 98 88 84 84 84 84 84 5 84 80 43 19 – 18 46 Mauritius 100 100 100 93 94 93 97 97 97 98 98 97 97 0 0 95 – – – – – Mexico 96 97 92 85 88 74 96 90 87 87 97 84 87 85 94 88 – 52 – – – Micronesia (Federated 89 95 87 57 85 49 70 98 81 81 91 83 68 33 61 – – – – – – States of) Monaco 100 100 – 100 100 – 89 99 99 99 99 99 99 0 0 – – – – – – Mongolia 64 66 59 60 66 43 99 99 99 99 98 99 99 0 0 – 70 31 – – – Montenegro 100 100 99 96 98 92 91 97 91 91 88 87 91 0 0 – 89x 16x 74 – – Morocco 85 99 65 77 84 66 99 99 99 99 99 99 99 90 80 88 70 22 – – – Mozambique 51 81 37 21 42 10 93 93 78 78 85 78 78 0 73 83 50 55 56 36 51 Myanmar 81 93 74 80 84 77 86 90 75 76 86 75 75 0 0 87 69 61 – 11 – Namibia 91 98 85 34 54 17 97 92 88 88 83 88 88 0 0 85 68 72 63 6 24 Nauru 97 97 – 66 66 – 99 99 95 95 98 95 95 0 0 – 69x 23x 51x – – Nepal 92 91 92 46 56 43 99 94 92 92 88 92 92 0 0 82 50 44 46 – – THE STATE OF THE WORLD’S CHILDREN 2016 127
TABLE 3. HEALTH Immunization coverage (%) Pneumonia Diarrhoea Malaria Use of improved Use of improved Care seeking Treatment Care House- drinking water sanitation Newborns for children with oral seeking for Children holds sources (%) facilities (%) protected with rehydration children sleeping with at against symptoms of salts (ORS) with fever under ITNs least one 2015 2015 BCG DTP1β β tetanusλ pneumonia (%) (%) (%) (%) ITN (%) Countries DTP3 polio3 MCV1 HepB3 Hib3 rota PCV3 and areas total urban rural total urban rural 2014 2010–2015* 2010–2015* 2010–2015* Netherlands 100 100 100 98 97 100 – 98 96 96 96 95 96 0 95 – – – – – – New Zealand 100 100 100 – – – – 93 93 93 93 93 93 0 93 – – – – – – Nicaragua 87 99 69 68 76 56 98 99 98 99 99 98 98 98 98 81 58x 65 – – – Niger 58 100 49 11 38 5 76 89 68 67 72 68 68 19 13 81 59 41 75 96 87 Nigeria 69 81 57 29 33 25 74 75 66 66 51 66 66 0 0 55 35 34 32 17 50 Niue 99 – – 100 100 100 99 99 99 99 99 99 99 0 99 – – – – – – Norway 100 100 100 98 98 98 – 99 93 93 94 0 94 0 91 – – – – – – Oman 93 95 86 97 97 95 99 99 99 99 99 98 99 0 98 98 56 59 – – – Pakistan 91 94 90 64 83 51 85 79 73 72 63 73 73 0 68 75 64 38 65 0x 1 Palau – 97 – 100 100 100 – 99 95 95 83 99 99 99 93 – – – – – – Panama 95 98 89 75 84 58 99 96 80 80 90 80 80 87 48 – 82 52 – – – Papua New Guinea 40 88 33 19 56 13 81 87 62 53 65 62 62 0 0 70 63x – – – – Paraguay 98 100 95 89 95 78 95 98 87 83 90 87 87 85 88 85 – – – – – Peru 87 91 69 76 82 53 94 98 88 79 89 88 88 86 86 85 60 28 60 – – Philippines 92 94 90 74 78 71 87 86 79 84 88 79 79 1 0 87 64 49 50 – – Poland 98 99 97 97 98 97 93 99 99 95 98 96 99 0 0 – – – – – – Portugal 100 100 100 100 100 100 99 99 98 98 98 98 98 0 0 – – – – – – Qatar 100 – – 98 98 98 90 99 99 99 99 99 99 90 93 – – – – – – Republic of Korea – 100 – 100 100 100 99 99 99 99 99 99 97 0 0 – – – – – – Republic of Moldova 88 97 81 76 88 67 97 94 90 92 90 92 89 69 28 – 79 42 – – – Romania 100 100 100 79 92 63 98 98 94 94 89 94 92 0 0 – – – – – – Russian Federation 97 99 91 72 77 59 96 97 97 97 98 97 31 0 0 – – – – – – Rwanda 76 87 72 62 59 63 99 99 99 99 98 99 99 98 99 90 54 28 49 68 81 Saint Kitts and Nevis 98 – – – – – 99 99 97 93 93 98 98 0 0 – – – – – – Saint Lucia 96 100 96 91 85 92 89 99 99 99 99 99 99 0 0 – – – – – – Saint Vincent and 95 – – – – – 96 99 98 97 99 98 98 0 0 – – – – – – the Grenadines Samoa 99 97 99 91 93 91 95 99 91 91 91 91 91 0 0 – 78 63 59 – – San Marino – – – – – – – 82 80 80 57 80 79 0 0 – – – – – – Sao Tome and Principe 97 99 94 35 41 23 95 98 95 95 92 95 95 0 95 – 69 49 66 61 78 Saudi Arabia 97 – – 100 100 100 98 99 98 98 98 98 98 94 98 – – – – – – Senegal 79 93 67 48 65 34 95 94 89 85 80 89 89 0 81 91 42 23 56 43 74 Serbia 99 99 99 96 98 94 98 97 93 93 86 92 94 0 0 – 90 36 – – – Seychelles 96 – – 98 98 98 98 99 99 99 99 99 99 0 0 – – – – – – Sierra Leone 63 85 48 13 23 7 90 88 83 83 78 83 83 53 83 85 72 85 72 49 64 Singapore 100 100 – 100 100 – 99 98 97 97 95 97 0 0 0 – – – – – – Slovakia 100 100 100 99 99 98 – 99 97 97 97 97 97 0 96 – – – – – – Slovenia 100 100 99 99 99 99 – 98 95 95 94 0 95 0 0 – – – – – – Solomon Islands 81 93 77 30 81 15 99 95 88 94 93 88 88 0 0 85 73x 38x 68x 40x 49x Somalia – – – – – – 37 52 42 47 46 42 42 0 0 64 13x 13x – 11x 12x South Africa 93 100 81 66 70 61 77 73 70 71 70 74 70 72 65 80 65x 40x 65x – – South Sudan 59 67 57 7 16 4 46 49 39 44 22 0 0 0 0 – 48 39 57 46 66 Spain 100 100 100 100 100 100 – 99 97 97 96 96 96 0 0 – – – – – – Sri Lanka 96 99 95 95 88 97 99 99 99 99 99 99 99 0 0 95 58x 50x 85x 3x 5x State of Palestine 58 51 81 92 93 90 99 99 99 99 99 99 99 0 97 – 77 32 – – – Sudan – – – – – – 95 99 94 94 86 94 94 86 97 74 48 22 – 30x 25 Suriname 95 98 88 79 88 61 – 91 85 85 85 85 85 0 0 93 76 42 – 43 61 Swaziland 74 94 69 57 63 56 99 99 98 98 86 98 98 0 67 88 60 57 – 2 10 Sweden 100 100 100 99 99 100 26 99 98 98 97 42 98 0 98 – – – – – – Switzerland 100 100 100 100 100 100 – 98 96 96 93 0 95 0 80 – – – – – – Syrian Arab Republic 90 92 87 96 96 95 81 65 43 52 54 71 43 0 0 92 77x 50x – – – Tajikistan 74 93 67 95 94 95 98 98 97 94 98 97 97 0 0 – 63 60 57 1x 2x Thailand 98 98 98 93 90 96 99 99 99 99 99 99 0 0 0 95 83 58 – – – The former Yugoslav Republic 99 100 99 91 97 83 99 98 95 96 93 97 94 0 0 – 93x 62 – – – of Macedonia Timor-Leste 72 95 61 41 69 27 79 81 77 76 74 77 77 0 0 81 71 71 73 41 41 Togo 63 91 44 12 25 3 97 91 87 85 82 87 87 35 34 81 49 19 58 43 65 Tonga 100 100 100 91 98 89 89 86 82 84 67 82 82 0 0 – – – 64 – – Trinidad and Tobago 95 95 95 92 92 92 – 93 92 94 96 92 92 0 95 – 74x – – – – Tunisia 98 100 93 92 97 80 95 98 98 98 98 98 98 0 0 96 60 65 – – – Turkey 100 100 100 95 98 86 95 97 96 96 94 96 96 0 96 90 – – – – – Turkmenistan – – – – – – 99 99 98 98 99 97 97 0 0 – 51x 40x – – – Tuvalu 98 98 97 – 86 – 99 99 90 90 96 90 90 0 0 – – 44x 79x – – THE STATE OF THE WORLD’S CHILDREN 2016 128
TABLE 3. HEALTH Immunization coverage (%) Pneumonia Diarrhoea Malaria Use of improved Use of improved Care seeking Treatment Care House- drinking water sanitation Newborns for children with oral seeking for Children holds sources (%) facilities (%) protected with rehydration children sleeping with at against symptoms of salts (ORS) with fever under ITNs least one 2015 2015 BCG DTP1β β tetanusλ pneumonia (%) (%) (%) (%) ITN (%) Countries DTP3 polio3 MCV1 HepB3 Hib3 rota PCV3 and areas total urban rural total urban rural 2014 2010–2015* 2010–2015* 2010–2015* Uganda 79 96 76 19 29 17 93 89 78 82 82 78 78 0 50 85 79 44 82 74 90 Ukraine 96 96 98 96 97 93 95 90 76 74 79 46 83 0 0 – 92 59 – – – United Arab Emirates 100 100 100 98 98 95 90 94 94 94 94 94 94 56 94 – – – – – – United Kingdom 100 100 100 99 99 100 – 98 95 95 93 0 95 0 93 – – – – – – United Republic of Tanzania 56 77 46 16 31 8 99 99 97 97 99 97 97 97 93 88 71 44 77 72 91 United States 99 99 98 100 100 100 – 98 94 93 91 90 93 69 92 – – – – – – Uruguay 100 100 94 96 97 93 99 99 95 95 96 95 95 0 95 – 91 – – – – Uzbekistan – 98 – 100 100 100 99 99 99 99 99 99 99 52 0 – 68x 28x – – – Vanuatu 94 99 93 58 65 55 73 75 64 65 53 64 64 0 0 75 72 48 57 51 83 Venezuela 93 95 78 94 97 70 95 88 78 79 89 78 78 76 0 75 72x 38x – – – (Bolivarian Republic of) Viet Nam 98 99 97 78 94 70 96 95 95 96 97 95 95 0 0 91 81 51 – 9 10 Yemen – – – – – – 73 94 88 88 75 88 88 72 88 70 34 25 33 – – Zambia 65 86 51 44 56 36 95 96 86 78 85 86 86 73 77 85 70 64 75 41 68 Zimbabwe 77 97 67 37 49 31 99 98 91 92 92 91 91 48 91 75 59 43 47 27 42 SUMMARY Sub-Saharan Africa 68 87 56 30 40 23 83 85 77 77 72 77 77 32 53 76 46 36 51 44 61 Eastern and 66 88 57 33 47 26 84 88 80 80 79 80 79 48 70 82 55 41 57 49 63 Southern Africa West and Central Africa 69 86 55 27 35 20 81 80 73 73 65 73 73 14 33 72 40 34 46 39 63 Middle East and North Africa 93 95 89 91 93 87 94 94 89 90 87 91 75 33 33 84 65 32 – – – South Asia 92 95 91 45 65 35 91 89 83 82 81 73 37 0 10 85 71 52‡ 50‡ – – East Asia and Pacific 94 97 90 76 86 64 96 97 93 94 94 93 23 0 0 87** 73** 46** 66** – – Latin America and Caribbean 95 97 84 83 88 64 95 94 88 88 92 88 88 75 79 88 – 45 – – – CEE/CIS 97 99 93 86 89 81 96 97 95 94 95 92 74 7 28 – – – – – – Least developed countries 69 86 62 38 47 33 87 89 81 81 79 81 81 31 53 83 49 43 51 50 64 World 91 96 84 68 82 51 91 91 86 86 85 82 56 19 31 83** 63** 41‡** 54‡** – – For a complete list of countries and areas in the regions, subregions and country categories, see page 112 or visit . It is not advisable to compare data from consecutive editions of The State of the World’s Children. DEFINITIONS OF THE INDICATORS MAIN DATA SOURCES Use of improved drinking water sources – Percentage of the population using any of the following as their main Use of improved drinking water sources and improved sanitation facilities drinking water source: drinking water supply piped into dwelling, plot, yard or neighbor’s yard; public tap or standpipe; – WHO/UNICEF Joint Monitoring Programme for Water Supply and Sanitation (JMP). tube well or borehole; protected dug well; protected spring; rainwater; bottled water plus one of the previous sources as Immunization – UNICEF and WHO. their secondary source. Use of improved sanitation facilities – Percentage of the population using any of the following sanitation facilities, Care seeking for children with symptoms of pneumonia – Demographic and not shared with other households: flush or pour-flush latrine connected to a piped sewerage system, septic tank or pit Health Surveys (DHS), Multiple Indicator Cluster Surveys (MICS) and other latrine; ventilated improved pit latrine; pit latrine with a slab; composting toilet. national household surveys. EPI – Expanded Programme on Immunization: The first diseases targeted by the EPI were diphtheria, pertussis Diarrhoea treatment with oral rehydration salts (ORS) – DHS, MICS and (whooping cough) and tetanus (DPT); measles; poliomyelitis; and tuberculosis (TB). Additional vaccines have been added other national household surveys. to the original six recommended in 1974 and include vaccines to protect against hepatitis B (HepB), and Haemophilus Malaria treatment – DHS, MICS, Malaria Indicator Surveys (MIS) and other influenzae type b (Hib). Pneumococcal conjugate vaccine (PCV) and rotavirus vaccine, also recommended by the WHO, national household surveys. are increasingly being added to national schedules. BCG – Percentage of live births who received bacille Calmette-Guérin (vaccine against tuberculosis). NOTES DTP1 – Percentage of surviving infants who received their first dose of diphtheria, pertussis and tetanus vaccine. DTP3 – Percentage of surviving infants who received three doses of diphtheria, pertussis and tetanus vaccine. − Data not available. Polio3 – Percentage of surviving infants who received three doses of the polio vaccine. x Data refer to years or periods other than those specified in the column MCV1 – Percentage of surviving infants who received the first dose of the measles-containing vaccine. heading. Such data are not included in the calculation of regional and global HepB3 – Percentage of surviving infants who received three doses of hepatitis B vaccine. averages. Estimates from data years prior to 2000 are not displayed. Hib3 – Percentage of surviving infants who received three doses of Haemophilus influenzae type b vaccine. β Coverage for DPT1 should be at least as high as DPT3. Discrepancies where rota – Percentage of surviving infants who received the last dose of rotavirus vaccine as recommended. DPT1 coverage is less than DPT3 reflect deficiencies in the data collection and reporting process. UNICEF and WHO are working with national and PCV3 – Percentage of surviving infants who received three doses of pneumococcal conjugate vaccine. territorial systems to eliminate these discrepancies. Newborns protected against tetanus – Percentage of newborns protected at birth against tetanus. λ WHO and UNICEF have employed a model to calculate the percentage of Care seeking for children with symptoms of pneumonia – Percentage of children under age 5 with symptoms of births that can be considered as protected against tetanus because pregnant pneumonia (cough and fast or difficult breathing due to a problem in the chest) in the two weeks preceding the survey women were given two doses or more of tetanus toxoid (TT) vaccine. The for whom advice or treatment was sought from a health facility or provider. model aims to improve the accuracy of this indicator by capturing or includ- Diarrhoea treatment with oral rehydration salts (ORS) – Percentage of children under age 5 who had diarrhoea in ing other potential scenarios where women might be protected (e.g., women the two weeks preceding the survey and who received oral rehydration salts (ORS packets or pre-packaged ORS fluids). who receive doses of TT in supplemental immunization activities). A fuller Care seeking for children with fever – Percentage of children under age 5 with fever for whom advice or treatment explanation of the methodology can be found at . was sought from a health facility or provider. Excludes drug vendor, stores, shops and traditional healer. In some * Data refer to the most recent year available during the period specified in countries, particularly non-malaria endemic countries, pharmacies have also been excluded from the calculation. Children sleeping under ITNs – Percentage of children under age 5 who slept under an insecticide-treated mosquito the column heading. net the night prior to the survey. ** Excludes China. Households with at least one ITN – Percentage of households with at least one insecticide-treated mosquito net. ‡ Excludes India. THE STATE OF THE WORLD’S CHILDREN 2016 129
TABLE 4. HIV/AIDS Mother-to- child Paediatric transmission infections Prevention among young people (aged 15–24) HIV testing Orphans Women Children Condom use Young people who Children Children Adult HIV People of all ages living with living HIV prevalence Comprehensive among were tested for HIV orphaned orphaned due Orphan preva- living with HIV HIV with HIV among knowledge of young people with in the last 12 months by AIDS to all causes school lence (%) (thousands) (thousands) (thousands) young people (%) HIV (%) multiple partners and received results (thousands) (thousands) attendance Countries 2014 2014 2014 2014 2014 2010–2014* (%) 2010–2014* (%) 2010–2014* 2014 2014 ratio (%) and areas estimate estimate low high estimate estimate total male female male female male female male female estimate estimate 2010–2014* Afghanistan <0.1 7 4 13 3 <0.5 <0.1 <0.1 <0.1 – 2 – – – – – – – Albania – – – – – – – – – 22x 36x 55 x – 1x 0x – – – Algeria <0.1 11 3 26 5 – <0.1 <0.1 <0.1 – 9 – – – 2 – – – Andorra – – – – – – – – – – – – – – – – – – Angola 2.4 300 220 430 160 32 0.8 0.6 1.1 32x 25x – – – – 120 1,300 85x Antigua and Barbuda – – – – – – – – – 53 46 – – – – – – – Argentina 0.5 130 78 170 38 – 0.2 0.2 0.1 – 40 – – – – – – – Armenia 0.2 4 3 6 <1 – 0.1 0.2 <0.1 9 16 86 – 0 3 – – – Australia – – – – – – – – – – – – – – – – – – Austria – – – – – – – – – – – – – – – – – – Azerbaijan 0.1 8 6 12 3 <0.2 <0.1 0.1 <0.1 5x 5x 29 x – – – – – – Bahamas – – – – – – – – – – – – – – – – – – Bahrain – – – – – – – – – – – – – – – – – – Bangladesh <0.1 9 8 10 3 <0.5 <0.1 <0.1 <0.1 – 9 – – – – – – 88 Barbados – – – – – – – – – – 68 – – – 24 – – – Belarus 0.5 29 24 36 10 – 0.2 0.1 0.2 51 56 73 64 p 19 24 – – – Belgium – – – – – – – – – – – – – – – – – – Belize 1.2 3 2 8 1 <0.2 0.4 0.3 0.4 – 43 – 26 x,p – 25 – – 92 Benin 1.1 78 68 90 41 8 0.3 0.2 0.4 31 22 44 35 5 14 28 440 78 Bhutan – – – – – – – – – – 21 – – – 8 – – – Bolivia 0.3 18 13 29 5 <1 0.2 0.2 0.1 28x 22x 41 x – 2x – – – – (Plurinational State of) Bosnia and Herzegovina – – – – – – – – – 47 48 67 – 1 0 – – – Botswana 25.2 390 370 410 210 16 7.2 5.7 8.9 – – – – – – 67 100 – Brazil – – – – – – – – – – – – – – – – – – Brunei Darussalam – – – – – – – – – – – – – – – – – – Bulgaria – – – – – – – – – – – – – – – – – – Burkina Faso 0.9 110 92 130 57 13 0.5 0.4 0.5 36 31 75 65 7 12 75 830 101 Burundi 1.1 85 72 110 42 14 0.4 0.3 0.4 47 45 – – 11 18 77 580 82 Cabo Verde 1.1 3 3 4 <1 – 0.5 0.8 0.3 – – – – – – – – – Cambodia 0.6 75 47 140 36 6 0.2 0.1 0.2 46 38 – – 7 12 – – 88 Cameroon 4.8 660 610 790 350 58 1.7 1.2 2.1 41 32 67 47 13 21 310 1,200 86 Canada – – – – – – – – – – – – – – – – – – Central African Republic 4.3 140 120 150 70 15 1.7 1.4 2.0 25 17 47 34 13 19 91 300 88 Chad 2.5 210 170 270 110 29 0.8 0.6 1.0 – 10 – 57 p – 4 130 970 117 Chile 0.3 39 32 47 4 – 0.1 0.2 <0.1 – – – – – – – – – China – – – – – – – – – – – – – – – – – – Colombia 0.4 120 96 160 38 2 0.2 0.2 0.1 – 24 – 39 – 11 – – – Comoros – – – – – – – – – 24 19 52 – 4 3 – – 108 Congo 2.8 81 72 88 43 11 1.2 0.9 1.4 28 14 51 45 6 12 46 210 100 Cook Islands – – – – – – – – – – – – – – – – – – Costa Rica 0.3 9 6 12 2 <0.2 0.1 0.1 <0.1 – 33 – 55 – 14 – – – Côte d'Ivoire 3.5 460 420 510 250 42 1.1 0.9 1.4 25 16 57 34 8 14 230 1,200 66 Croatia – – – – – – – – – – – – – – – – – – Cuba 0.3 17 15 21 4 – 0.2 0.2 <0.1 59 61 – 70 25 27 – – – Cyprus – – – – – – – – – – – – – – – – – – Czech Republic – – – – – – – – – – – – – – – – – – Democratic People's – – – – – – – – – – 8x – – – – – – – Republic of Korea Democratic Republic 1.0 450 400 490 230 59 0.4 0.3 0.5 25 19 22 11 4 7 290 4,000 80 of the Congo Denmark 0.2 6 4 8 2 – <0.1 <0.1 <0.1 – – – – – – – – – Djibouti 1.6 10 8 14 5 1 0.6 0.5 0.8 – 18x – – – – 6 32 – Dominica – – – – – – – – – 48 56 – – – – – – – Dominican Republic 1.0 69 52 100 31 3 0.4 0.4 0.4 41 45 57 40 10 16 – – 97 Ecuador 0.3 33 25 46 8 – 0.1 0.2 <0.1 – – – – – – – – – Egypt <0.1 9 6 14 2 <0.5 <0.1 <0.1 <0.1 – 4y – – – – – – – El Salvador 0.5 21 13 29 7 <1 0.2 0.2 0.2 – 31 – – – – – – – Equatorial Guinea 6.2 32 29 34 16 3 1.9 1.3 2.5 18 19 36 19 16 35 6 43 – Eritrea 0.7 16 12 24 9 2 0.3 0.2 0.3 34 25 – – – – 11 140 – Estonia – – – – – – – – – – – – – – – – – – Ethiopia 1.2 730 600 970 390 110 0.5 0.5 0.6 34 24 47 – 20 21 450 3,500 90 Fiji 0.1 <1 <0.5 1 <0.5 – <0.1 <0.1 <0.1 – – – – – – – – – Finland – – – – – – – – – – – – – – – – – – France – – – – – – – – – – – – – – – – – – THE STATE OF THE WORLD’S CHILDREN 2016 130
TABLE 4. HIV/AIDS Mother-to- child Paediatric transmission infections Prevention among young people (aged 15–24) HIV testing Orphans Women Children Condom use Young people who Children Children Adult HIV People of all ages living with living HIV prevalence Comprehensive among were tested for HIV orphaned orphaned due Orphan preva- living with HIV HIV with HIV among knowledge of young people with in the last 12 months by AIDS to all causes school lence (%) (thousands) (thousands) (thousands) young people (%) HIV (%) multiple partners and received results (thousands) (thousands) attendance Countries 2014 2014 2014 2014 2014 2010–2014* (%) 2010–2014* (%) 2010–2014* 2014 2014 ratio (%) and areas estimate estimate low high estimate estimate total male female male female male female male female estimate estimate 2010–2014* Gabon 3.9 48 41 55 29 4 0.9 0.6 1.3 36 30 77 56 12 30 18 68 101 Gambia 1.8 20 16 25 11 2 0.5 0.4 0.7 32 26 51 p – 4 10 10 87 90 Georgia 0.3 7 5 8 1 – 0.2 0.3 <0.1 – – – – – 5 – – – Germany – – – – – – – – – – – – – – – – – – Ghana 1.5 250 190 330 140 21 0.5 0.4 0.6 27 20 34 15 3 10 120 950 94 Greece – – – – – – – – – – – – – – – – – – Grenada – – – – – – – – – 60 65 – – – – – – – Guatemala 0.5 49 34 69 18 3 0.2 0.2 0.2 24x 22x 74 x 27 x,p – – – – – Guinea 1.6 120 100 140 65 – 0.6 0.4 0.7 34 23 54 37 3 5 – – 71 Guinea-Bissau 3.7 42 38 47 22 5 1.2 0.8 1.5 – 15 – 50 – 7 13 120 108 Guyana 1.8 10 7 15 5 <0.5 0.9 0.7 1.2 47x 54x 76 x – 18x 29x – – – Haiti 1.9 140 130 160 79 8 0.7 0.5 0.8 28 35 62 52 9 17 64 300 96 Holy See – – – – – – – – – – – – – – – – – – Honduras 0.4 23 19 27 9 2 0.2 0.2 0.2 35 33 59 38 7 13 – – 91 Hungary – – – – – – – – – – – – – – – – – – Iceland – – – – – – – – – – – – – – – – – – India 0.3 2,100 1,600 2,800 760 130 – – – 36x 20x 32 x 17 x,p 1x 1x 530 29,600 72x Indonesia 0.5 660 600 720 230 19 0.4 0.4 0.4 10y 11y – – – – – – – Iran (Islamic Republic of) 0.1 74 51 110 9 <1 <0.1 <0.1 <0.1 – 20y – – – – – – – Iraq – – – – – – – – – – 4 – – – 0 – – 94 Ireland 0.3 8 6 10 2 – 0.1 0.1 <0.1 – – – – – – – – – Israel – – – – – – – – – – – – – – – – – – Italy – – – – – – – – – – – – – – – – – – Jamaica 1.6 29 25 38 11 <1 0.7 0.8 0.6 36y 43y 76 49 49 69 – – – Japan – – – – – – – – – – – – – – – – – – Jordan – – – – – – – – – – 9 – – – – – – 80 Kazakhstan 0.2 20 18 25 7 – <0.1 <0.1 <0.1 34 36 76 74 15 21 – – – Kenya 5.3 1,400 1,200 1,600 700 160 2.8 2.2 3.5 64 57 69 38 39 50 650 2,000 99 Kiribati – – – – – – – – – 49x 44x 30 x 2 x,p – – – – 82x Kuwait – – – – – – – – – – – – – – – – – – Kyrgyzstan 0.3 9 7 12 4 <0.5 <0.1 <0.1 <0.1 24 20 76 – 1 12 – – – Lao People's Democratic 0.3 11 10 12 5 <1 0.1 0.1 0.2 28 24 – – 2 2 – – 80 Republic Latvia – – – – – – – – – – – – – – – – – – Lebanon <0.1 2 <0.2 4 <0.2 – <0.1 <0.1 <0.1 – – – – – – – – – Lesotho 23.4 310 290 340 170 19 8.0 5.9 10.2 29x 39x 60 x 45 x 17x 40x 74 120 98x Liberia 1.2 33 29 38 17 4 0.3 0.3 0.4 29 36 32 26 6 18 25 190 75 Libya – – – – – – – – – – – – – – – – – – Liechtenstein – – – – – – – – – – – – – – – – – – Lithuania – – – – – – – – – – – – – – – – – – Luxembourg – – – – – – – – – – – – – – – – – – Madagascar 0.3 39 34 45 16 5 0.1 0.2 0.1 26 23 7 9 2 3 – – 74x Malawi 10.0 1,100 990 1,100 560 130 3.2 2.4 4.1 51 44 53 38 34 42 530 990 96 Malaysia 0.5 100 91 110 20 <1 <0.1 0.1 <0.1 – – – – – – – – – Maldives – – – – – – – – – – 35x,y – – – – – – – Mali 1.4 130 110 170 68 18 0.6 0.5 0.7 33 24 38 8 p 4 6 59 810 81 Malta – – – – – – – – – – – – – – – – – – Marshall Islands – – – – – – – – – 39x 27x 23 x,p 9 x,p – – – – – Mauritania 0.7 16 13 20 8 2 0.3 0.2 0.4 – 6 – – – – – – 100p Mauritius 0.9 8 7 9 2 – 0.2 0.2 0.2 – – – – – – – – – Mexico 0.2 190 140 270 40 3 <0.1 0.1 <0.1 – – – – – – – – – Micronesia (Federated – – – – – – – – – – – – – – – – – – States of) Monaco – – – – – – – – – – – – – – – – – – Mongolia – – – – – – – – – 21 23 69 – 13 17 – – 102 Montenegro – – – – – – – – – 37 48 65 – 1 0 – – – Morocco 0.1 29 20 37 9 <1 <0.1 <0.1 <0.1 – – – – – – – – – Mozambique 10.6 1,500 1,300 2,100 830 160 4.5 2.4 6.6 52 30 41 38 11 26 610 1,800 91 Myanmar 0.7 210 190 230 70 11 0.3 0.4 0.3 – 32 – – – – – – – Namibia 16.0 260 240 280 130 16 4.0 2.9 5.0 51 62 79 68 26 43 53 100 102 Nauru – – – – – – – – – 10x 13x 17 x,p 8 x,p 4x 4x – – – Nepal 0.2 39 35 43 13 2 <0.1 <0.1 <0.1 – 36 45 – – 3 – – – Netherlands – – – – – – – – – – – – – – – – – – New Zealand – – – – – – – – – – – – – – – – – – THE STATE OF THE WORLD’S CHILDREN 2016 131
TABLE 4. HIV/AIDS Mother-to- child Paediatric transmission infections Prevention among young people (aged 15–24) HIV testing Orphans Women Children Condom use Young people who Children Children Adult HIV People of all ages living with living HIV prevalence Comprehensive among were tested for HIV orphaned orphaned due Orphan preva- living with HIV HIV with HIV among knowledge of young people with in the last 12 months by AIDS to all causes school lence (%) (thousands) (thousands) (thousands) young people (%) HIV (%) multiple partners and received results (thousands) (thousands) attendance Countries 2014 2014 2014 2014 2014 2010–2014* (%) 2010–2014* (%) 2010–2014* 2014 2014 ratio (%) and areas estimate estimate low high estimate estimate total male female male female male female male female estimate estimate 2010–2014* Nicaragua 0.3 10 8 15 3 <0.5 0.1 0.2 <0.1 – – – – – – – – – Niger 0.5 52 46 59 25 – 0.1 <0.1 0.2 25 14 42 x,p – 2 7 – – 109 Nigeria 3.2 3,400 3,100 3,700 1,700 380 1.0 0.7 1.3 34 24 51 41 5 8 1,600 9,900 123 Niue – – – – – – – – – – – – – – – – – – Norway 0.2 6 4 9 2 – <0.1 <0.1 <0.1 – – – – – – – – – Oman 0.2 2 2 3 <1 – <0.1 <0.1 <0.1 – – – – – – – – 101 Pakistan <0.1 94 58 180 26 2 <0.1 <0.1 <0.1 5y 4y – – – – – – 79p Palau – – – – – – – – – – – – – – – – – – Panama 0.6 17 13 24 4 <0.5 0.2 0.2 0.1 – 37 – – – – – – – Papua New Guinea 0.7 37 34 41 19 4 0.2 0.2 0.2 – – – – – – 13 300 – Paraguay 0.4 17 12 32 6 <0.5 0.3 0.3 0.2 – – – 51 x – – – – – Peru 0.4 72 61 100 21 2 0.1 0.1 0.1 – 22x – 34 – – – – 100 Philippines <0.1 36 21 100 4 <0.5 <0.1 <0.1 <0.1 – 21x – – – 0 – – – Poland <0.1 – – – – – <0.1 <0.1 <0.1 – – – – – – – – – Portugal – – – – – – – – – – – – – – – – – – Qatar – – – – – – – – – 25 16 – – – – – – – Republic of Korea – – – – – – – – – – – – – – – – – – Republic of Moldova 0.6 18 15 21 8 <0.2 0.2 0.1 0.3 28 36 68 49 9 17 – – – Romania – – – – – – – – – – – – – – – – – – Russian Federation – – – – – – – – – – – – – – – – – – Rwanda 2.8 210 190 230 120 22 1.2 1.0 1.3 47 53 58 p 29 p 32 37 85 500 91 Saint Kitts and Nevis – – – – – – – – – 50 53 – – – – – – – Saint Lucia – – – – – – – – – – 62 – 42 p – 22 – – – Saint Vincent and – – – – – – – – – – – – – – – – – – the Grenadines Samoa – – – – – – – – – 6x 3x – – 1x 0x – – – San Marino – – – – – – – – – – – – – – – – – – Sao Tome and Principe 0.8 1 <1 2 <0.5 – 0.2 0.2 0.2 43 42 59 x – 14x 29x – – – Saudi Arabia – – – – – – – – – – – – – – – – – – Senegal 0.5 44 37 53 17 4 0.1 0.1 <0.1 31 29 49 – 7 13 – – 97 Serbia – – – – – – – – – 48 54 63 65 2 2 – – – Seychelles – – – – – – – – – – – – – – – – – – Sierra Leone 1.4 54 47 61 29 4 0.3 0.2 0.4 30 29 21 6 5 14 19 310 81 Singapore – – – – – – – – – – – – – – – – – – Slovakia <0.1 – – – – – <0.1 <0.1 <0.1 – – – – – – – – – Slovenia <0.1 <1 <1 1 <0.1 – <0.1 <0.1 <0.1 – – – – – – – – – Solomon Islands – – – – – – – – – 35x 29x 39 x 18 x – – – – – Somalia 0.5 35 27 45 15 5 0.2 0.2 0.2 – 4x – – – – 27 630 78x South Africa 18.9 6,800 6,500 7,500 3,900 340 6.1 4.0 8.1 23 25 – – – – 2,300 2,800 98x South Sudan 2.7 190 130 270 100 19 1.0 0.7 1.3 – 10 – 7 – – 91 570 78 Spain – – – – – – – – – – – – – – – – – – Sri Lanka <0.1 3 2 6 1 <0.1 <0.1 <0.1 <0.1 – – – – – – – – – State of Palestine – – – – – – – – – – 6 – – – – – – – Sudan 0.2 53 41 69 23 4 0.1 0.1 0.2 – 9 – – – 0 – – 82 Suriname 1.0 4 3 4 2 – 0.4 0.3 0.5 – 42 – 39 – 21 – – – Swaziland 27.7 210 210 220 120 19 11.3 7.2 15.5 51 49 85 69 23 37 56 87 100 Sweden 0.2 – – – – – <0.1 <0.1 <0.1 – – – – – – – – – Switzerland – – – – – – – – – – – – – – – – – – Syrian Arab Republic <0.1 <1 <0.1 2 <0.2 – <0.1 <0.1 <0.1 – 7x – – – – – – – Tajikistan 0.4 16 12 21 6 1 0.1 0.1 0.1 – 9 – – – 5 – – 81 Thailand 1.1 450 400 490 190 7 0.3 0.3 0.2 – 56 – – – 10 – – 94p The former Yugoslav – – – – – – – – – – 27x – – – – – – – Republic of Macedonia Timor-Leste – – – – – – – – – 20 12 – – – – – – 75 Togo 2.4 110 95 140 60 12 0.7 0.5 0.8 32 23 63 59 p 9 16 54 330 97 Tonga – – – – – – – – – 14 12 – – 1 2 – – – Trinidad and Tobago – – – – – – – – – – 54x – 67 x – – – – – Tunisia <0.1 3 2 4 <1 – <0.1 <0.1 <0.1 – 20 – – – 0 – – – Turkey – – – – – – – – – – – – – – – – – – Turkmenistan – – – – – – – – – – 5x – – – – – – – Tuvalu – – – – – – – – – 61x 39x – – 8x 4x – – – Uganda 7.3 1,500 1,400 1,800 770 150 3.0 2.3 3.7 39 39 31 24 24 40 650 1,900 87 Ukraine – – – – – – – – – 46 50 84 67 12 13 – – – United Arab Emirates – – – – – – – – – – – – – – – – – – THE STATE OF THE WORLD’S CHILDREN 2016 132
TABLE 4. HIV/AIDS Mother-to- child Paediatric transmission infections Prevention among young people (aged 15–24) HIV testing Orphans Women Children Condom use Young people who Children Children Adult HIV People of all ages living with living HIV prevalence Comprehensive among were tested for HIV orphaned orphaned due Orphan preva- living with HIV HIV with HIV among knowledge of young people with in the last 12 months by AIDS to all causes school lence (%) (thousands) (thousands) (thousands) young people (%) HIV (%) multiple partners and received results (thousands) (thousands) attendance Countries 2014 2014 2014 2014 2014 2010–2014* (%) 2010–2014* (%) 2010–2014* 2014 2014 ratio (%) and areas estimate estimate low high estimate estimate total male female male female male female male female estimate estimate 2010–2014* United Kingdom – – – – – – – – – – – – – – – – – – United Republic of 5.3 1,500 1,300 1,900 800 140 1.8 1.4 2.1 47 40 41 34 21 29 810 2,600 95 Tanzania United States – – – – – – – – – – – – – – – – – – Uruguay 0.7 14 12 17 2 – 0.3 0.4 0.1 – 35 – – – – – – – Uzbekistan 0.2 32 26 40 13 – <0.1 <0.1 <0.1 – 31x – – – – – – – Vanuatu – – – – – – – – – – 15x – – – – – – – Venezuela 0.6 110 43 180 36 3 0.2 0.2 0.2 – – – – – – – – – (Bolivarian Republic of) Viet Nam 0.5 250 220 280 77 5 0.3 0.3 0.2 – 49 – – – 9 – – – Yemen <0.1 7 5 11 2 <0.5 <0.1 <0.1 <0.1 – 2x,y – – – – – – – Zambia 12.4 1,200 1,100 1,200 540 100 3.7 3.3 4.2 47 42 40 34 29 43 380 950 86 Zimbabwe 16.7 1,600 1,500 1,600 830 150 5.9 4.8 7.0 52 56 65 43 32 46 570 810 94 SUMMARY Sub-Saharan Africa 4.7 25,800 24,000 28,700 13,800 2,300 1.6 1.2 2.0 36 28 46 33 13 18 11,000 46,600 96 Eastern and 7.3 19,200 10,300 1,600 2.5 1.8 3.2 41 35 45 31 23 30 7,600 21,700 91 Southern Africa 18,100 21,900 West and Central Africa 2.3 6,600 5,900 7,500 3,400 730 0.8 0.6 0.9 31 22 46 33 6 10 3,400 24,700 101 Middle East and 0.1 220 130 300 66 11 <0.1 <0.1 <0.1 – 9 – – – – 71 6,500 – North Africa South Asia 0.2 2,200 950 3,700 800 140 <0.1 <0.1 <0.1 – 8‡ – – – – 580 37,800 83‡ East Asia and Pacific 0.2 2,700 2,400 3,000 900 62 0.1 0.1 0.1 – 27** – – – – 770 23,000 – Latin America and 0.5 2,000 1,700 2,300 670 46 0.2 0.2 0.2 – – – – – – 550 10,200 – Caribbean CEE/CIS 0.6 1,500 1,300 1,800 610 17 0.2 0.1 0.2 – – – – – – 250 7,700 – Least developed 1.9 10,900 9,900 5,600 1,100 0.8 0.6 1.0 36 23 40 – 14 17 5,200 35,500 89 countries 13,100 World 0.8 36,900 34,300 41,400 17,400 2,600 0.3 0.3 0.4 – 23 ‡** – – – – 13,300 140,000 – For a complete list of countries and areas in the regions, subregions and country categories, see page 112 or visit . It is not advisable to compare data from consecutive editions of The State of the World’s Children. DEFINITIONS OF THE INDICATORS MAIN DATA SOURCES Adult HIV prevalence – Estimated percentage of adults (aged 15–49) living Estimated adult HIV prevalence – UNAIDS 2014 HIV and AIDS estimates, based on 2015 Spectrum modelling, with HIV as of 2014. July 2015. People of all ages living with HIV – Estimated number of people (all ages) Estimated number of people living with HIV – UNAIDS 2014 HIV and AIDS estimates, based on 2015 Spectrum modelling, July 2015. living with HIV as of 2014. Estimated number of women living with HIV – UNAIDS 2014 HIV and AIDS estimates, based on 2015 Spectrum modelling, Women living with HIV – Estimated number of women (aged 15+) living July 2015. with HIV as of 2014. Estimated number of children living with HIV – UNAIDS 2014 HIV and AIDS estimates, based on 2015 Spectrum modelling, Children living with HIV – Estimated number of children (aged 0–14) living July 2015. with HIV as of 2014. HIV prevalence among young people – UNAIDS 2014 HIV and AIDS estimates, based on 2015 Spectrum modelling, July 2015. HIV prevalence among young people – Estimated percentage of young Comprehensive knowledge of HIV – AIDS Indicator Surveys (AIS), Demographic and Health Surveys (DHS), Multiple Indicator Cluster men and women (aged 15–24) living with HIV as of 2014. Surveys (MICS) and other national household surveys; DHS STATcompiler, . Comprehensive knowledge of HIV – Percentage of young men and Condom use among young people with multiple partners – AIS, DHS, MICS and other national household surveys; DHS women (aged 15–24) with comprehensive, correct knowledge of HIV. STATcompiler, . Comprehensive, correct knowledge about HIV and AIDS is defined as correctly Tested for HIV in the last 12 months and received results – AIS, DHS, MICS and other national household surveys; DHS identifying the two major ways of preventing the sexual transmission of HIV STATcompiler, . (using condoms and limiting sex to one faithful, uninfected partner), rejecting the two most common local misconceptions about HIV transmission and Children orphaned by AIDS – UNAIDS 2014 HIV and AIDS estimates, based on 2015 Spectrum modelling, July 2015. knowing that a healthy-looking person can transmit HIV. Children orphaned by all causes – UNAIDS 2014 HIV and AIDS estimates, based on 2015 Spectrum modelling, Condom use among young people with multiple partners– Among July 2015. young men and women (aged 15–24) who reported having had more than one Orphan school attendance ratio – AIS, DHS, MICS and other national household surveys; DHS STATcompiler, sexual partner in the last 12 months, the percentage who reported the use of www.statcompiler.com. a condom the last time they had sex with any partner. Tested for HIV in the last 12 months and received results – Percentage NOTES − Data not available. of young men and women (aged 15–24) who were tested for HIV in the last 12 months and received the result of the most recent test. x Data refer to years or periods other than those specified in the column heading. Such data are not included in the calculation of – Estimated number of children (aged 0–17) Children orphaned by AIDS regional and global averages. Estimates from years prior to 2006 are not displayed. who have lost one or both parents to AIDS as of 2014. y Data differ from the standard definition or refer to only part of a country. If they fall within the noted reference period, such data Children orphaned due to all causes – Estimated number of children are included in the calculation of regional and global averages. (aged 0–17) who have lost one or both parents due to any cause as of 2014. p Based on small denominators (typically 25–49 unweighted cases). No data based on fewer than 25 unweighted cases are Orphan school attendance ratio – Percentage of children (aged 10–14) displayed. who have lost both biological parents and who are currently attending school * Data refer to the most recent year available during the period specified in the column heading. as a percentage of the non-orphaned children of the same age who live with at least one parent who are attending school. ** Excludes China. ‡ Excludes India. THE STATE OF THE WORLD’S CHILDREN 2016 133
TABLE 5. EDUCATION Pre-primary school participation Primary school participation Secondary school participation Youth (15–24 Mobile phones / Gross Out-of-school Survival rate to years) literacy Internet users per Gross enrolment enrolment Net enrolment Net attendance children of pri- last primary Net enrolment Net attendance rate (%) 100 population ratio (%) ratio (%) ratio (%) ratio (%) mary school age grade (%) ratio (%) ratio (%) 2009–2014* 2010– 2009– Countries 2014 2010–2014* 2010–2014* 2010–2014* 2009–2014* 2010–2014* 2014* 2014* 2010–2014* 2009–2014* and areas mobile internet rate number admin. survey male female phones users male female male female male female male female (%) (000) data data male female male female Afghanistan 62 32 75 6 – – 131 92 – – 62y 46y – – – 84 62 35 47y 27y Albania 99 99 105 60 90 87 114 111 – – 92 93 4 7 99 100 86 85 78 79 Algeria 94x 89x 93 18 79 79 122 115 – – 98 97 1 36 93 98x – – 77 81 Andorra – – 83 96 – – – – – – – – – – 71 – – – – – Angola 79 67 63 21 64 94 157 100 95 73 77 75 16 624 32x 83x 14 11 21 17 Antigua and Barbuda – – 132 64 78 72 101 93 87 85 – – 14 1 – – 78 81 – – Argentina 99 99 159 65 71 72 111 110 – – 98 99 0 6 95 97 – – 82 85 Armenia 100 100 116 46 46 60 96x 111x – – 100 99 – – 90 100x 82x 97x 92 93 Australia – – 131 85 110 108 107 106 97 98 – – 3 51 – – 86 88 – – Austria – – 152 81 102 101 103 102 – – – – – – 99 – – – – – Azerbaijan 100 100 111 61 23 24 107 105 96 94 69y 67y 5 23 97 100x 89 87 87y 85y Bahamas – – 82 77 – – 107 109 – – – – 2 1 89x – 80 86 – – Bahrain 99 98 173 91 55 55 – – – – 86x 87x – – 98 99x – – 77x 85x Bangladesh 79 83 80 10 32 32 109 115 93 97 71 76 5 907 66x 96x 50 55 40 52 Barbados – – 129 77 83 86 93 94 91 92 100 99 9 2 93 – 99 100 93 91 Belarus 100 100 123 59 107 103 99 99 94 94 93 90 6 22 98 100 99 100 96 98 Belgium – – 114 85 119 118 105 105 99 99 – – 1 6 97 – 94 95 – – Belize – – 51 39 50 51 114 109 98 95 94 95 3 2 95 97 67 71 50 61 Benin 55x 31x 100 5 20 21 131 120 – – 77 73 4 70 53 88x 50 34 50 38 Bhutan 80x 68x 82 34 16 18 101 103 88 90 96 95 11 11 79 94 59 67 54 56 Bolivia (Plurinational State of) 99 99 96 39 64 63 99 96 88 87 97x 97x 12 169 97 96x 75 76 78x 75x Bosnia and Herzegovina 100 100 91 61 – – – – – – 97 95 – – 87 100 – – 93 95 Botswana 96 99 167 19 18 18 110 107 91 92 86x,y 88x,y 9 27 94 – 59 67 36x 44x Brazil 97 98 139 58 – – – – – – 97 97 – – – 88x – – 76 78 Brunei Darussalam 99 100 110 69 73 74 107 108 – – – – – – 96 – 87 88 – – Bulgaria 98 98 138 55 83 83 99 99 96 97 – – 4 10 98 – 89 87 – – Burkina Faso 47x 33x 72 9 4 4 89 85 70 66 54 50 32 957 69 89x 23 20 22 17 Burundi 90x 88x 30 1 7 7 127 128 95 97 85 84 4 69 53 82x 25 25 20 14 Cabo Verde 98 98 122 40 70 70 116 110 98 98 – – 2 1 91 – 65 74 – – Cambodia 88 86 133 9 18 18 120 113 96 94 84y 86y 5 97 47 92x 40x 37x 46 45 Cameroon 85 76 76 11 34 35 120 107 100 90 87 84 5 193 70 93 46 40 55 50 Canada – – 81 87 73 73 99 100 – – – – 1 11 – – – – – – Central African Republic 49 27 25 4 6 6 107 80 79 62 78 68 29 207 47 81 18 9 23 15 Chad 54 46 40 3 1 1 115 88 95 74 55 48 16 357 51 89 – – 22 12 Chile 99 100 133 72 125 121 102 98 93 92 90y 92y 7 110 99 – 87 90 80y 84y China 100 100 92 49 117 118 109 109 – – 97y 97y – – – – – – 87y 88y Colombia 98 99 113 53 55 55 130x 129x 97x 97x 95 96 3x 129x 83 95 74x 80x 76 83 Comoros 87 87 51 7 22 24 108 102 88 83 85 85 15 17 – 19x 42 45 51 56 Congo 86 77 108 7 14 14 107 115 89 97 96 97 7 47 – 96 – – 67 67 Cook Islands – – – – 75 81 108 104 – – – – 2 0.03 77 – 82 85 – – Costa Rica 99 99 144 49 79 79 111 110 96 96 96 96 4 16 90 93 76 80 69 74 Côte d'Ivoire 58 39 106 15 7 7 96 84 80 71 72 66 25 879 74 90x – – 32 23 Croatia 100 100 104 69 63 62 96 96 97 100 – – 2 3 99 – 94 96 – – Cuba 100 100 22 30 98 99 100 96 93 94 – – 7 53 96 – 88 91 – – Cyprus 100 100 96 69 77 77 99 100 97 98 – – 3 2 91 – 94 96 – – Czech Republic – – 130 80 106 103 99 99 – – – – – – 99 – – – – – Democratic People's Republic 100x 100x 11 0 84x 85x 100x 100x 97x 97x 99 99 3x 47x – 100 98x 99x 98 98 of Korea Democratic Republic 91 77 53 3 4 4 112 102 – – 88 85 – – 55 75 – – 54 41 of the Congo Denmark – – 126 96 99 96 102 101 98 99 – – 1 6 98 – 89 92 – – Djibouti – – 32 11 5 4 73 63 69 60 71y 68y 35 33 84 92x 29x 21x 45x 37x Dominica – – 127 63 88 82 118 118 96x 99x – – 3x 0.2 x 85 – 76 82 – – Dominican Republic 96 98 79 50 43 45 105 96 86 85 95 96 14 179 79 90 61 70 66 79 Ecuador 98 99 104 43 185 189 113 113 96 98 97y 97y 3 63 89 – 81 84 81y 83y Egypt 91 84 114 32 25 24 106 105 – – 97 97 0 12 96x 99x 77 77 81 79 El Salvador 96 96 144 30 68 70 118 112 96 96 91y 91y 4 30 84 – 69 70 – – Equatorial Guinea 98 99 66 19 68 68 85 84 58 58 61x 60x 42 46 72 – – – 23x 22x Eritrea 94 90 6 1 15 15 55 47 43 38 57y 56y 59 405 78 – 31 26 23x 21x Estonia 100 100 161 84 90 87 101 100 100 99 – – 0 0.3 97 – 92 93 – – Ethiopia 63x 47x 32 3 31 30 104 96 89 84 64y 67y 14 2,124 37 84x – – 13y 18y Fiji – – 99 42 17x 19x 105 106 96 98 – – 3 3 97 – 79 88 – – THE STATE OF THE WORLD’S CHILDREN 2016 134
TABLE 5. EDUCATION Pre-primary school participation Primary school participation Secondary school participation Youth (15–24 Mobile phones / Gross Out-of-school Survival rate to years) literacy Internet users per Gross enrolment enrolment Net enrolment Net attendance children of pri- last primary Net enrolment Net attendance rate (%) 100 population ratio (%) ratio (%) ratio (%) ratio (%) mary school age grade (%) ratio (%) ratio (%) 2009–2014* 2010– 2009– Countries 2014 2010–2014* 2010–2014* 2010–2014* 2009–2014* 2010–2014* 2014* 2014* 2010–2014* 2009–2014* and areas mobile internet rate number admin. survey male female phones users male female male female male female male female (%) (000) data data male female male female Finland – – 140 92 81 81 101 101 99 100 – – 0 1 99 – 94 94 – – France – – 101 84 108 108 106 105 99 100 – – 1 26 – – 99 100 – – Gabon 87 89 171 10 36 38 144 140 – – 94 96 – – – – – – 48 57 Gambia 74 67 120 16 33 35 84 88 66 72 61 64 31 99 77 95 – – 34 34 Georgia 100 100 125 49 – – 116 118 – – 95 96 1 2 99 98x 92 92 85 88 Germany – – 120 86 110 109 103 103 – – – – 0 4 96 – – – – – Ghana 88 83 115 19 114 117 107 106 89 89 70 70 11 413 84 100 55 54 38 37 Greece 99 99 110 63 77 76 99 98 98 97 – – 3 18 91 – 96 95 – – Grenada – – 110 37 95 93 105 101 98 98 – – 2 0.2 – – 80 81 – – Guatemala 95 92 107 23 65 66 106 102 89 89 – – 11 258 72 – 48 45 – – Guinea 38 22 72 2 15 15 95 84 80 72 63 53 24 449 53 96x 38 25 38 25 Guinea-Bissau 80 71 63 3 6 7 118 110 71 68 62 62 31 76 – 73 – – 27 20 Guyana 92 94 71 37 95 93 87 84 86 84 97 97 15 17 92 96 82 83 81 88 Haiti 74x 70x 65 11 78 84 176 175 – – 83 84 – – – 88 – – 33 39 Holy See – – – – – – – – – – – – – – – – – – – – Honduras 94 96 94 19 47 48 110 108 95 95 91y 92y 5 54 75 84 46 53 46 55 Hungary 99 99 118 76 87 86 101 99 96 96 – – 4 15 98 – 93 92 – – Iceland – – 111 98 98 97 98 99 98 99 – – 1 0.4 98 – 88 88 – – India 90 82 74 18 54 57 105 117 92 99 85x 82x 5 6,402 – 95x 61 62 59x 49x Indonesia 99 99 129 17 51 58 106 106 93 94 98 99 7 1,900 82 – 76 74 72 75 Iran (Islamic Republic of) 98 98 88 39 43 42 107 112 – – 96 97 1 45 82 97 80 81 – – Iraq 83 81 95 11 – – – – – – 93 87 – – – 96 – – 53 45 Ireland – – 105 80 107 110 103 103 99 100 – – 1 4 – – – – – – Israel – – 121 71 113 112 104 105 97 98 – – 3 22 99 – 97 99 – – Italy 100 100 154 62 101 99 102 101 100 99 – – 1 15 99 – 95 95 – – Jamaica 94 99 107 41 102 108 – – – – 97 99 – – 95 99 70 77 91 92 Japan – – 120 91 – – 102 101 100 100 – – 0 3 100 – 99 100 – – Jordan 99 99 148 44 33 31 89 88 88 87 98 98 12 119 98 – 83 88 74 77 Kazakhstan 100 100 172 55 57 57 111 111 99 100 99 99 1 5 99 100 95 97 96 96 Kenya 83x 82x 74 43 75 73 111 112 84 88 84 87 14 956 – 96 57 56 57 61 Kiribati – – 17 12 – – 111 115 – – 83 87 2 0.3 – – – – 54 65 Kuwait 99 99 218 79 82 80 103 105 97 99 – – 2 4 96 – 81 85 – – Kyrgyzstan 100 100 134 28 25 25 108 107 98 98 99 99 2 8 99 100 80 80 85 86 Lao People's Democratic 89x 79x 67 14 30 31 119 113 96 94 85 85 5 36 78 95 52 50 45 45 Republic Latvia 100 100 117 76 93 92 103 102 98 99 – – 2 2 92 – 89 91 – – Lebanon 98x 99x 88 75 87 82 102 93 92 86 98 98 11 54 93 93x 65 65 77 85 Lesotho 74 92 85 11 30 32 108 106 79 82 92 96 19 66 67 84x 27 42 34 47 Liberia 63x 37x 73 5 – – 100 92 39 37 42 43 62 442 68x 76x 18 15 27 24 Libya 100 100 161 18 – – – – – – – – – – – – – – – – Liechtenstein – – 109 95 102 97 103 105 – – – – 2 0.03 79x – 97 87 – – Lithuania 100 100 147 72 85 84 101 101 100 100 – – 0 0.3 97 – 94 94 – – Luxembourg – – 149 95 93 94 96 97 94 96 – – 5 2 85 – 84 87 – – Madagascar 66 64 41 4 13 14 147 147 – – 68y 71y – – 40 89 31 32 27 28 Malawi 74 70 33 6 – – 145 148 – – 93 94 2x 48x 49 88 33 33 32 34 Malaysia 98 98 149 68 – – – – – – – – – – – – – – – – Maldives 99x 99x 189 49 – – 104x 101x 97x 96x 94 95 3x 2x 82 99 – – 63 70 Mali 56 34 149 7 4 4 81 73 67 60 60 55 36 1,030 62 94 39 30 36 23 Malta 98 99 127 73 112 119 100 95 99 94 – – 3 1 97 – 85 76 – – Marshall Islands – – 29 17 46 49 106 105 – – – – 0 0.02 83x – – – – – Mauritania 66x 48x 94 11 3 4 95 101 73 77 60 62 25 151 64 78 23 20 26 22 Mauritius 98 99 132 41 101 104 102 104 96 98 – – 3 4 98 – – – – – Mexico 98 98 82 44 101 104 105 104 97 98 97x 97x 3 357 95 – 66 69 – – Micronesia – – – 30 – – 98 97 86 88 – – 13 2 – – – – – – (Federated States of) Monaco – – 88 92 – – – – – – – – – – – – – – – – Mongolia 98 99 105 27 85 86 103 101 96 95 95 97 4 10 – 99 85 88 91 96 Montenegro 99 99 163 61 57 54 95 93 94 93 98 98 6 3 80 100x – – 94 95 Morocco 89 74 132 57 65 53 119 113 99 99 91x 88x 1 37 89 – 59 53 39x 36x Mozambique 80 57 70 6 – – 109 100 90 85 76 76 12 678 31 60x 18 18 25 23 Myanmar 96 96 54 2 23 24 101 98 98 91 90 91 5 284 75x 93 48 49 58 59 Namibia 83x 91x 114 15 21 22 113 110 89 92 92 93 9 36 91 89x 48 60 55 65 THE STATE OF THE WORLD’S CHILDREN 2016 135
TABLE 5. EDUCATION Pre-primary school participation Primary school participation Secondary school participation Youth (15–24 Mobile phones / Gross Out-of-school Survival rate to years) literacy Internet users per Gross enrolment enrolment Net enrolment Net attendance children of pri- last primary Net enrolment Net attendance rate (%) 100 population ratio (%) ratio (%) ratio (%) ratio (%) mary school age grade (%) ratio (%) ratio (%) 2009–2014* 2010– 2009– Countries 2014 2010–2014* 2010–2014* 2010–2014* 2009–2014* 2010–2014* 2014* 2014* 2010–2014* 2009–2014* and areas mobile internet rate number admin. survey male female phones users male female male female male female male female (%) (000) data data male female male female Nauru – – – – 85 96 110 100 89 84 97y 98y 13 0.2 – – 70 75 65y 72y Nepal 90 80 82 15 88 84 130 141 95 94 76 76 5 174 70 – 58 62 62 62 Netherlands – – 116 93 94 95 107 106 99 99 – – 1 11 – – 92 93 – – New Zealand – – 112 86 97 99 98 99 98 99 – – 2 6 – – 96 97 – – Nicaragua 85x 89x 115 18 57 59 124 123 97 100 71y 70y 2 12 – 56x 45 53 38x 48x Niger 35 15 44 2 7 7 76 65 66 57 55 46 38 1,233 64 92 19 13 21 13 Nigeria 76x 58x 78 43 13 13 88 81 71 60 70 66 34 8,735 79x 97 – – 56 49 Niue – – – 92 113 125 127 125 – – 100 100 – – – – – – – – Norway – – 116 96 99 99 100 100 100 100 – – 0 1 99 – 95 95 – – Oman 97 98 158 70 53 55 106 115 97 97 97 98 3 6 99 99 87 90 91 92 Pakistan 80 62 73 14 74 66 101 86 79 67 67 60 27 5,612 80 – 46 36 45 38 Palau 100 100 91 – 71 77 116 112 – – – – 1 0.01 – – 90 99 – – Panama 98 97 158 45 71 72 107 104 97 96 97 97 3 14 93 – 75 81 77 84 Papua New Guinea 67 77 45 9 102x 99x 120 109 90 84 – – 13 160 – – – – – – Paraguay 99 99 106 43 38 38 108 104 89 89 87x 89x 11 85 84 – 67 66 81x 80x Peru 99 99 104 40 87 88 101 101 95 96 92y 93y 5 162 91 87 77 79 80y 82y Philippines 97x 98x 111 40 53x 56x 117 117 95 99 88x 89x 3 402 76x 90x 62 74 55x 70x Poland 100 100 149 67 78 77 101 101 97 97 – – 3 62 99 – 91 93 – – Portugal 99 99 112 65 92 89 112 108 99 99 – – 1 7 – – 92 94 – – Qatar 96 98 146 91 58 58 104 99 99 95 96 97 3 3 98 100 100 89 94 93 Republic of Korea – – 116 84 92 92 99 99 97 96 – – 4 101 100 – 97 96 – – Republic of Moldova 100 100 108 47 83 81 94 94 91 91 99 98 9 14 95 100x 77 78 84 88 Romania 99 99 106 54 92 93 96 95 92 91 – – 9 72 94 – 87 87 – – Russian Federation 100 100 155 71 92 91 100 101 97 98 – – 2 141 97 – – – – – Rwanda 77 78 64 11 14 15 136 139 95 97 87y 89y 4 68 35 76x – – 21y 25y Saint Kitts and Nevis – – 119 65 97 92 83 84 80 83 – – 19 1 93 – 81 85 – – Saint Lucia – – 103 51 63 67 – – – – 100 99 – – 90 100 80 81 91 92 Saint Vincent and the – – 105 56 68 70 106 103 92 91 – – 9 1 69 – 84 87 – – Grenadines Samoa 99 99 56 21 35 39 106 106 97 98 88y 89y 3 1 90 – 75 84 51y 70y San Marino – – 119 – 106 108 94 93 93 93 – – 7 0.1 96 – – – – – Sao Tome and Principe 83x 77x 65 24 – – 114 109 96 95 94 94 4 1 80 92 44 51 55 65 Saudi Arabia 99 99 180 64 14 18 109 108 98 95 – – 4 121 99 – 97 79 – – Senegal 74 59 99 18 14 16 78 84 70 76 63 66 27 634 61 90 – – 39 37 Serbia 99 99 122 54 59 59 101 101 98 99 99 99 1 4 98 100 91 93 92 95 Seychelles 99 99 162 54 93 93 104 105 94 95 – – 5 0.5 – – 74 75 – – Sierra Leone 73 56 77 2 9 10 130 130 100 99 74 78 1 7 48 93 40 35 48 42 Singapore 100 100 147 82 – – – – – – – – – – 99x – – – – – Slovakia – – 117 80 93 91 103 101 – – – – – – 98 – – – – – Slovenia 100 100 112 72 95 93 99 99 97 98 – – 3 3 100 – 95 95 – – Solomon Islands – – 66 9 98 98 116 112 – – 63x,y 69x,y – – 71 – 42 42 29x,y 30x,y Somalia – – 51 2 – – – – – – 24x 19x – – – 88x – – 7x 4x South Africa 98 99 149 49 77 78 102 97 – – 97 97 – – – – – – 88 88 South Sudan 44x 30x 25 16 6 6 101 67 47 34 26 21 59 1,022 – 71 – – 10 6 Spain 100 100 108 76 99 99 105 106 99 100 – – 0 14 97 – 96 97 – – Sri Lanka 98 99 103 26 95 95 102 100 98 96 – – 3 47 98 100x 84 87 – – State of Palestine 99 99 72 54 50 51 95 95 93 93 99 99 7 33 98 100 77 84 85 94 Sudan 91 86 72 25 38 36 73 65 53 56 72 68 45 2,713 80 90 – – 46 45 Suriname 98 99 171 40 92 96 122 118 91 92 95 96 9 5 86 96 44 50 53 66 Swaziland 92 95 72 27 25 26 118 108 79 78 96 97 21 45 75 93 31 38 42 52 Sweden – – 128 93 95 95 117 124 100 100 – – 0 2 100 – 95 94 – – Switzerland – – 137 87 99 99 103 103 99 100 – – 1 4 – – 82 80 – – Syrian Arab Republic 97 95 64 28 6 6 81 79 72 70 97x 96x 29 563 93 100x 47 46 64x 65x Tajikistan 100 100 95 17 11 10 98 97 97 97 98 97 3 19 99 100x 88 79 92 82 Thailand 97 97 144 35 117 116 99 97 97x 96x 96 96 4x 202x – 100 77 82 75 83 The former Yugoslav Republic 99 98 106 68 28 29 86 85 89 88 98 98 12 15 – 100 – – 90 88 of Macedonia Timor-Leste 80 79 119 1 17 17 138 136 96 99 71 73 2 4 81 91 48 56 43 48 Togo 87 73 65 6 15 15 129 121 96 90 90 87 7 79 53 90 – – 52 41 Tonga 99 100 64 40 36 35 110 110 95 97 93y 93y 4 1 – – 74 79 82y 84y Trinidad and Tobago 100 100 147 65 – – 108 104 99 98 98x 98x 1 2 89x 98x – – 84x 90x THE STATE OF THE WORLD’S CHILDREN 2016 136
TABLE 5. EDUCATION Pre-primary school participation Primary school participation Secondary school participation Youth (15–24 Mobile phones / Gross Out-of-school Survival rate to years) literacy Internet users per Gross enrolment enrolment Net enrolment Net attendance children of pri- last primary Net enrolment Net attendance rate (%) 100 population ratio (%) ratio (%) ratio (%) ratio (%) mary school age grade (%) ratio (%) ratio (%) 2009–2014* 2010– 2009– Countries 2014 2010–2014* 2010–2014* 2010–2014* 2009–2014* 2010–2014* 2014* 2014* 2010–2014* 2009–2014* and areas mobile internet rate number admin. survey male female phones users male female male female male female male female (%) (000) data data male female male female Tunisia 98 96 128 46 40 43 113 109 – – 98 98 0 4 94 97 – – 69 77 Turkey 99 97 95 51 28 27 107 107 94 93 94x,y 92x,y 7 357 90 95x 90 86 75x 64x Turkmenistan 100 100 136 12 64 62 90 89 – – 99x 99x – – – – – – 95x 95x Tuvalu – – 38 – 93 93 101 102 95 98 97x,y 99x,y 4 0.1 – – 62 78 35x 47x Uganda 90 85 52 18 11 11 109 111 92 95 86 87 6 477 25 72x 24 22 20 21 Ukraine 100 100 144 43 105 103 103 105 96 98 100 100 3 56 99 100 88 89 93 93 United Arab Emirates 94x 97x 178 90 92 92 106 107 96 96 – – 4 15 92 – – – – – United Kingdom – – 124 92 80 76 109 109 – – – – 0 7 – – 94 95 – – United Republic of Tanzania 76 73 63 5 32 33 86 87 81 82 75y 78y 18 1,715 67 91x – – 26 25 United States – – 110 87 71 71 100 99 93 93 – – 7 1,774 – – 87 89 – – Uruguay 98 99 161 61 89 89 114 110 – – 97 98 0 0.5 95x – 68 76 72 78 Uzbekistan 100 100 78 44 25 25 98 96 96 94 95x 95x 5 101 98 100x – – 91x 90x Vanuatu 95 95 60 19 64 64 125 122 – – 76y 78y – – 71x 88x 51 53 22y 26y Venezuela 97 98 99 57 73 73 102 100 93 93 91x 93x 7 243 87 82x 71 79 – – (Bolivarian Republic of) Viet Nam 97 97 147 48 83 80 110 109 – – 98 98 2 127 90 99 – – 89 92 Yemen 97 80 68 23 1 1 106 89 92 78 80 72 15 583 69 73x 50 33 81 58 Zambia 70x 58x 67 17 – – 103 104 88 90 86 88 11 325 55 87x – – 47 43 Zimbabwe 90 92 81 20 27 27 103 102 88 90 93 94 11 283 – 91 43 43 46 50 SUMMARY Sub-Saharan Africa 76 66 71 19 18 19 103 96 81 76 75 74 21 32,960 57 91 36 32 40 36 Eastern and Southern Africa 79 72 64 17 21 22 108 102 85 84 78 79 16 11,826 47 – 34 33 32 33 West and Central Africa 73 57 78 21 15 15 100 91 78 70 72 68 26 18,403 67 91 37 30 46 38 Middle East and North Africa 94 90 107 37 28 28 108 102 91 88 91 89 10 4,852 83 – 70 66 71 67 South Asia 87 79 75 17 55 56 111 112 94 94 81 77 6 10,259 63 94 55 48 56 48 East Asia and Pacific 99 99 101 43 69 70 118 117 96 96 96 97 4 6,500 92 – 77 78 82 84 Latin America and Caribbean 98 98 115 50 76 77 106 103 93 94 95 96 6 4,020 83 90 73 78 75 78 CEE/CIS 100 100 128 56 61 60 101 101 95 95 – – 5 954 95 – 89 88 – – Least developed countries 77 69 64 9 15 15 109 101 84 80 73 73 18 24,360 54 – 36 33 37 36 orld 93 89 97 40 54 54 109 107 92 90 85 83 9 59,204 75 93** 67 65 62 58 W For a complete list of countries and areas in the regions, subregions and country categories, see page 112 or visit . It is not advisable to compare data from consecutive editions of The State of the World’s Children. DEFINITIONS OF THE INDICATORS MAIN DATA SOURCES Youth literacy rate – Number of literate persons aged 15–24 years, expressed as a percentage of the total population in that group. Youth literacy – UNESCO Institute for Statistics (UIS). Mobile phones – The number of active subscriptions to a public mobile telephone service, including the number of prepaid SIM Mobile phone and Internet use – International Telecommunications Union, cards active during the past three months. Geneva. Internet users – The estimated number of Internet users out of the total population. This includes those using the Internet from any Pre-primary, primary and secondary enrolment and rate and number of device (including mobile phones) in the last 12 months. out-of-school children – UIS. Estimates based on administrative data from Pre-primary school gross enrolment ratio – Number of children enrolled in pre-primary school, regardless of age, expressed as a national Education Management Information Systems (EMIS) with UN population percentage of the total number of children of official pre-primary school age. estimates. Primary school gross enrolment ratio – Number of children enrolled in primary school, regardless of age, expressed as a percentage of the total number of children of official primary school age. Primary and secondary school attendance – Demographic and Health Surveys Primary school net enrolment ratio – Number of children enrolled in primary or secondary school who are of official primary (DHS), Multiple Indicator Cluster Surveys (MICS) and other national household school age, expressed as a percentage of the total number of children of official primary school age. Because of the inclusion of surveys. primary-school-aged children enrolled in secondary school, this indicator can also be referred to as a primary adjusted net enrolment Survival rate to last primary grade – Administrative data: UIS; survey data: DHS, ratio. MICS and other national household surveys. Primary school net attendance ratio – Number of children attending primary or secondary school who are of official primary school age, expressed as a percentage of the total number of children of official primary school age. Because of the inclusion of primary-school-aged children attending secondary school, this indicator can also be referred to as a primary adjusted net attendance ratio. NOTES Rate of out-of-school children of primary school age – Number of children of official primary school age who are not enrolled in – Data not available. primary or secondary school, expressed as a percentage of the population of official primary school age. x Data refer to years or periods other than those specified in the column heading. Out-of-school children of primary school age – Children in the official primary school age range who are not enrolled in either Such data are not included in the calculation of regional and global averages, primary or secondary schools. Children enrolled in pre-primary education are excluded and considered out of school. with the exception of 2005–2006 data from India and 2006 survival rate data from Survival rate to last primary grade – Percentage of children entering the first grade of primary school who eventually reach the Brazil. Estimates from data years prior to 2000 are not displayed. last grade of primary school. Secondary school net enrolment ratio – Number of children enrolled in secondary school who are of official secondary school age, y Data differ from the standard definition or refer to only part of a country. If they expressed as a percentage of the total number of children of official secondary school age. Secondary net enrolment ratio does not fall within the noted reference period, such data are included in the calculation of include secondary-school-aged children enrolled in tertiary education owing to challenges in age reporting and recording at that level. regional and global averages. Secondary school net attendance ratio – Number of children attending secondary or tertiary school who are of official secondary * Data refer to the most recent year available during the period specified in the school age, expressed as a percentage of the total number of children of official secondary school age. Because of the inclusion of column heading. secondary-school-aged children attending tertiary school, this indicator can also be referred to as a secondary adjusted net ** Excludes China. attendance ratio. All data refer to official International Standard Classifications of Education (ISCED) for the primary and secondary education levels and thus may not directly correspond to a country-specific school system. THE STATE OF THE WORLD’S CHILDREN 2016 137
TABLE 6. DEMOGRAPHIC INDICATORS Population (thousands) Total Urbanized Average annual Population fertility population growth rate of urban Countries 2015 annual growth rate (%) Crude death rate Crude birth rate Life expectancy rate (%) population (%) and areas total under 18 under 5 1990–2015 2015–2030α 1970 1990 2015 1970 1990 2015 1970 1990 2015 2015 2015 1990–2015 2015–2030α Afghanistan 32,527 16,716 4,950 4.0 2.0 28 16 8 52 49 33 37 50 61 4.7 27 5.5 3.7 Albania 2,897 687 185 -0.5 0.1 8 6 7 32 25 14 67 72 78 1.8 57 1.5 1.4 Algeria 39,667 13,067 4,590 1.7 1.3 17 6 5 47 32 24 50 67 75 2.8 71 3.0 1.8 Andorra 70 12 3 1.0 0.1 – – – – – – – – – – 85 1.2 0.2 Angola 25,022 13,598 4,718 3.2 3.0 27 23 13 53 53 45 37 41 53 6.0 44 5.3 4.2 Antigua and Barbuda 92 27 7 1.6 0.9 7 7 6 30 19 16 66 71 76 2.1 24 0.0 0.2 Argentina 43,417 13,006 3,718 1.1 0.9 9 8 8 23 22 17 66 72 76 2.3 92 1.2 0.8 Armenia 3,018 654 207 -0.6 -0.1 6 8 9 23 22 13 70 68 75 1.5 63 -1.0 0.0 Australia 23,969 5,354 1,546 1.4 1.1 9 7 7 20 15 13 71 77 83 1.9 89 1.5 1.3 Austria 8,545 1,481 404 0.4 0.2 13 11 9 16 11 10 70 75 82 1.5 66 0.5 0.6 Azerbaijan 9,754 2,538 930 1.2 0.6 9 8 7 29 27 20 65 65 71 2.3 55 1.2 1.2 Bahamas 388 99 29 1.7 0.9 6 5 6 26 24 15 66 71 76 1.9 83 1.8 1.1 Bahrain 1,377 347 109 4.1 1.2 7 3 2 38 29 14 63 72 77 2.0 89 4.1 1.4 Bangladesh 160,996 57,168 15,331 1.7 1.0 19 10 5 48 35 19 48 58 72 2.1 34 3.8 2.8 Barbados 284 66 17 0.4 0.1 10 10 11 22 16 12 66 71 76 1.8 31 0.3 0.6 Belarus 9,496 1,774 586 -0.3 -0.4 9 11 14 16 14 12 71 71 71 1.6 77 0.2 -0.2 Belgium 11,299 2,280 653 0.5 0.4 12 11 10 14 12 12 71 76 81 1.8 98 0.5 0.3 Belize 359 140 39 2.6 1.8 8 5 6 42 36 23 66 71 70 2.5 44 2.2 2.0 Benin 10,880 5,312 1,708 3.1 2.4 24 14 9 47 46 36 42 54 60 4.7 44 4.1 3.4 Bhutan 775 252 66 1.5 0.9 26 13 6 49 38 17 37 52 70 2.0 39 4.9 2.4 Bolivia (Plurinational State of) 10,725 4,138 1,186 1.8 1.4 20 13 7 42 35 24 46 55 69 2.9 69 2.8 1.9 Bosnia and Herzegovina 3,810 643 172 -0.7 -0.4 7 8 11 24 15 9 66 71 77 1.3 40 -0.6 0.6 Botswana 2,262 856 266 2.0 1.5 13 7 8 46 35 25 55 63 65 2.8 57 2.8 1.4 Brazil 207,848 58,433 15,032 1.3 0.6 10 7 6 35 24 15 59 65 75 1.8 86 1.8 0.8 Brunei Darussalam 423 119 34 2.0 1.1 6 4 3 36 32 16 67 73 79 1.9 77 2.7 1.3 Bulgaria 7,150 1,199 337 -0.8 -0.8 9 13 15 16 12 9 71 71 74 1.6 74 -0.4 -0.5 Burkina Faso 18,106 9,475 3,144 2.9 2.7 25 17 9 47 47 40 39 49 59 5.4 30 5.9 4.7 Burundi 11,179 5,685 2,062 2.8 2.9 21 18 11 47 50 43 44 48 57 5.9 12 5.2 5.2 Cabo Verde 521 186 54 1.7 1.1 14 8 5 42 40 21 54 66 74 2.3 66 3.1 1.6 Cambodia 15,578 5,850 1,772 2.2 1.3 20 13 6 43 42 24 42 54 69 2.6 21 3.3 2.7 Cameroon 23,344 11,472 3,738 2.6 2.3 19 14 11 45 45 36 46 54 56 4.6 54 3.9 3.2 Canada 35,940 6,961 1,942 1.0 0.8 7 7 7 17 14 11 72 77 82 1.6 82 1.3 1.0 Central African Republic 4,900 2,242 708 2.0 1.9 23 17 14 43 41 33 42 49 51 4.2 40 2.3 2.8 Chad 14,037 7,671 2,632 3.4 3.0 23 19 14 47 51 45 41 47 52 6.1 22 3.6 4.0 Chile 17,948 4,398 1,170 1.2 0.8 10 6 5 30 22 13 63 73 82 1.7 90 1.5 0.8 China 1,376,049 282,260 83,186 0.7 0.2 11 7 7 37 23 12 59 69 76 1.6 56 3.7 1.7 Colombia 48,229 14,144 3,738 1.4 0.7 9 6 6 38 26 15 61 68 74 1.9 76 2.0 1.3 Comoros 788 368 119 2.6 2.1 19 11 7 46 43 33 46 57 64 4.4 28 2.6 2.8 Congo 4,620 2,259 759 2.6 2.6 14 12 8 43 38 36 53 55 63 4.8 65 3.4 3.0 Cook Islands 21 7 2 0.7 0.5 – – – – – – – – – – 75 1.7 0.7 Costa Rica 4,808 1,308 350 1.8 0.8 7 4 5 33 27 15 66 76 80 1.8 77 3.7 1.6 Côte d'Ivoire 22,702 11,193 3,667 2.5 2.3 21 14 13 53 43 37 44 52 52 4.9 54 3.5 3.1 Croatia 4,240 775 207 -0.5 -0.4 11 11 13 15 11 9 68 72 77 1.5 59 -0.1 0.2 Cuba 11,390 2,269 588 0.3 -0.1 7 7 8 29 17 10 70 75 80 1.6 77 0.4 -0.1 Cyprus 1,165 236 66 1.7 0.7 7 7 7 19 19 11 73 77 80 1.4 67 1.7 0.8 Czech Republic 10,543 1,846 538 0.1 -0.1 12 12 10 16 12 10 70 72 79 1.5 73 0.1 0.3 Democratic People's Republic 25,155 6,486 1,747 0.9 0.4 10 6 9 37 21 14 60 70 71 2.0 61 1.0 0.8 of Korea Democratic Republic 77,267 40,639 13,876 3.2 3.0 20 17 10 47 48 42 44 49 59 5.9 42 4.2 3.6 of the Congo Denmark 5,669 1,167 295 0.4 0.4 10 12 10 15 12 10 73 75 80 1.7 88 0.5 0.6 Djibouti 888 344 102 1.6 1.1 15 11 9 45 40 25 49 57 62 3.1 77 1.8 1.3 Dominica 73 22 6 0.1 0.3 – – – – – – – – – – 70 0.5 0.7 Dominican Republic 10,528 3,744 1,062 1.5 0.9 11 6 6 42 30 21 58 68 74 2.5 79 3.0 1.6 Ecuador 16,144 5,588 1,610 1.8 1.3 12 6 5 41 30 20 58 69 76 2.5 64 2.5 1.7 Egypt 91,508 35,095 12,116 1.9 1.6 16 9 6 40 33 27 52 65 71 3.3 43 1.6 1.8 El Salvador 6,127 2,039 520 0.6 0.3 13 8 7 43 31 17 55 64 73 1.9 67 2.0 1.0 Equatorial Guinea 845 383 128 3.2 2.5 25 19 11 39 47 35 40 48 58 4.7 40 3.6 3.0 Eritrea 5,228 2,562 815 2.0 2.2 22 15 6 47 43 33 41 48 64 4.2 23 4.3 4.4 Estonia 1,313 243 72 -0.7 -0.4 11 13 12 15 14 11 70 69 77 1.6 68 -1.0 -0.3 Ethiopia 99,391 48,448 14,602 2.9 2.2 21 18 7 48 48 32 43 47 65 4.3 19 4.6 4.3 Fiji 892 302 88 0.8 0.3 8 6 7 34 29 20 60 66 70 2.5 54 1.8 1.0 Finland 5,503 1,077 304 0.4 0.2 10 10 10 14 13 11 70 75 81 1.8 84 0.6 0.4 France 64,395 14,211 3,927 0.5 0.4 11 9 9 17 13 12 72 77 82 2.0 80 0.8 0.7 Gabon 1,725 748 239 2.4 2.0 20 11 8 37 37 30 47 61 65 3.8 87 3.4 2.2 THE STATE OF THE WORLD’S CHILDREN 2016 138
TABLE 6. DEMOGRAPHIC INDICATORS Population (thousands) Total Urbanized Average annual Population fertility population growth rate of urban Countries 2015 annual growth rate (%) Crude death rate Crude birth rate Life expectancy rate (%) population (%) and areas total under 18 under 5 1990–2015 2015–2030α 1970 1990 2015 1970 1990 2015 1970 1990 2015 2015 2015 1990–2015 2015–2030α Gambia 1,991 1,051 366 3.1 3.0 26 14 9 50 47 42 38 52 60 5.7 60 4.8 3.6 Georgia 4,000 832 275 -1.2 -0.2 10 9 12 19 17 13 67 70 75 1.8 54 -1.1 -0.1 Germany 80,689 12,769 3,384 0.1 -0.1 12 12 11 14 10 9 71 75 81 1.4 75 0.2 0.0 Ghana 27,410 12,330 4,056 2.5 2.0 16 11 9 47 39 32 49 57 62 4.1 54 4.0 2.8 Greece 10,955 1,899 533 0.3 -0.3 10 9 11 17 10 8 71 77 81 1.3 78 0.7 0.3 Grenada 107 34 10 0.4 0.3 9 9 7 28 28 19 64 69 74 2.1 36 0.7 0.4 Guatemala 16,343 7,085 2,089 2.3 1.8 15 9 5 44 38 27 52 62 72 3.2 52 3.3 3.0 Guinea 12,609 6,196 2,046 2.9 2.5 27 17 10 45 47 36 37 50 59 4.9 37 4.0 3.6 Guinea-Bissau 1,844 871 289 2.2 2.1 22 18 12 43 45 37 42 49 55 4.8 49 4.5 3.3 Guyana 767 279 67 0.3 0.5 9 9 8 35 33 19 62 63 66 2.5 29 0.3 1.1 Haiti 10,711 4,294 1,238 1.6 1.1 18 13 9 39 37 25 47 55 63 3.0 59 4.5 2.3 Holy See 1 0 0 0.2 0.0 – – – – – – – – – – 100 0.2 0.0 Honduras 8,075 3,109 816 2.0 1.2 15 7 5 47 38 21 53 67 73 2.3 55 3.4 2.6 Hungary 9,855 1,724 463 -0.2 -0.4 11 14 13 15 12 9 70 69 75 1.4 71 0.1 0.2 Iceland 329 80 23 1.0 0.7 7 7 6 21 17 13 74 78 83 1.9 94 1.3 0.9 India 1,311,051 451,990 123,711 1.6 1.0 17 11 7 39 31 20 48 58 68 2.4 33 2.6 2.2 Indonesia 257,564 85,276 24,864 1.4 0.9 13 8 7 40 26 20 55 63 69 2.4 54 3.7 2.0 Iran (Islamic Republic of) 79,109 21,847 6,855 1.4 0.7 16 7 5 42 33 17 51 64 76 1.7 73 2.4 1.5 Iraq 36,423 17,270 5,727 2.9 2.6 12 7 5 46 38 34 58 66 70 4.5 69 2.8 2.6 Ireland 4,688 1,187 353 1.1 0.7 11 9 6 22 14 14 71 75 81 2.0 63 1.6 1.3 Israel 8,064 2,626 832 2.3 1.4 7 6 5 26 22 21 72 76 83 3.0 92 2.3 1.4 Italy 59,798 9,870 2,570 0.2 -0.1 10 10 10 17 10 8 71 77 83 1.5 69 0.4 0.3 Jamaica 2,793 821 204 0.6 0.2 8 7 7 36 26 17 68 72 76 2.0 55 1.1 0.9 Japan 126,573 19,827 5,269 0.1 -0.3 7 7 10 19 10 8 72 79 84 1.4 93 0.9 -0.1 Jordan 7,595 3,160 980 3.3 1.2 10 5 4 51 34 27 60 70 74 3.4 84 3.8 1.5 Kazakhstan 17,625 5,356 1,948 0.3 0.9 9 9 9 25 24 21 63 67 70 2.6 53 -0.1 1.0 Kenya 46,050 22,234 7,166 2.7 2.3 15 10 8 51 42 34 52 59 62 4.3 26 4.5 4.0 Kiribati 112 46 15 1.8 1.5 13 10 7 35 37 29 54 60 66 3.7 44 2.5 1.9 Kuwait 3,892 997 348 2.5 1.7 6 3 3 49 21 20 66 72 75 2.1 98 2.2 2.0 Kyrgyzstan 5,940 2,170 780 1.2 1.2 11 8 6 31 31 26 60 66 71 3.1 36 0.8 2.0 Lao People's Democratic 6,802 2,813 839 1.9 1.5 18 14 7 43 43 26 46 54 67 2.9 39 5.7 3.3 Republic Latvia 1,971 339 95 -1.2 -0.6 11 13 15 14 14 10 70 69 74 1.5 67 -1.2 -0.5 Lebanon 5,851 1,733 461 3.1 -0.7 8 7 5 32 25 15 66 70 80 1.7 88 2.7 0.3 Lesotho 2,135 921 278 1.2 1.0 17 10 15 43 35 28 49 59 50 3.1 27 3.8 2.6 Liberia 4,503 2,203 701 3.0 2.4 24 18 9 49 45 35 39 47 61 4.6 50 2.6 3.2 Libya 6,278 2,187 649 1.4 1.1 13 5 5 51 29 20 56 69 72 2.4 79 1.7 1.4 Liechtenstein 38 7 2 1.1 0.6 – – – – – – – – – – 14 0.4 1.1 Lithuania 2,878 508 152 -1.0 -0.5 9 11 16 17 15 10 71 71 73 1.6 67 -0.9 -0.2 Luxembourg 567 113 32 1.6 1.2 12 10 7 13 12 11 70 75 82 1.6 90 1.8 1.3 Madagascar 24,235 11,776 3,770 3.0 2.6 21 15 7 48 45 34 45 51 66 4.4 35 4.6 4.2 Malawi 17,215 8,949 2,954 2.4 2.9 25 20 7 54 50 39 41 44 64 5.0 16 3.8 4.2 Malaysia 30,331 9,080 2,477 2.0 1.2 7 5 5 33 28 17 64 71 75 1.9 75 3.7 1.8 Maldives 364 119 37 2.0 1.2 21 9 4 50 41 21 44 61 77 2.1 46 4.3 2.7 Mali 17,600 9,526 3,271 2.9 2.9 32 20 10 50 49 43 32 46 58 6.1 40 5.0 4.7 Malta 419 76 19 0.7 0.1 8 7 9 16 16 9 71 76 81 1.5 95 0.8 0.2 Marshall Islands 53 19 5 0.5 0.3 – – – – – – – – – – 73 0.9 0.9 Mauritania 4,068 1,890 601 2.8 2.2 16 11 8 46 41 33 49 58 63 4.5 60 4.3 2.9 Mauritius 1,273 304 71 0.7 0.2 7 6 8 29 21 11 63 69 75 1.5 40 0.3 0.2 Mexico 127,017 42,245 11,617 1.6 1.0 10 5 5 44 29 18 61 71 77 2.2 79 1.9 1.2 Micronesia (Federated States of) 104 43 12 0.3 0.8 9 7 6 41 34 24 62 66 69 3.2 22 -0.2 1.5 Monaco 38 7 2 1.0 0.4 – – – – – – – – – – 100 1.1 0.9 Mongolia 2,959 968 338 1.2 1.2 15 10 6 44 32 23 55 60 70 2.6 72 2.1 1.7 Montenegro 626 142 37 0.1 -0.1 7 7 10 22 16 11 70 75 76 1.7 64 1.2 0.2 Morocco 34,378 11,121 3,421 1.3 1.0 14 7 6 43 29 20 53 65 74 2.5 60 2.2 1.7 Mozambique 27,978 14,589 4,816 3.0 2.6 25 21 11 48 46 39 39 43 55 5.3 32 3.8 3.5 Myanmar 53,897 17,885 4,565 1.0 0.7 15 10 8 40 27 17 51 59 66 2.2 34 2.3 2.0 Namibia 2,459 1,063 338 2.2 1.9 15 9 7 43 38 29 53 61 65 3.5 47 4.2 3.1 Nauru 10 4 1 0.4 0.3 – – – – – – – – – – 100 0.4 0.5 Nepal 28,514 11,316 2,807 1.7 1.0 23 13 6 43 39 20 41 54 70 2.2 19 4.8 2.9 Netherlands 16,925 3,390 885 0.5 0.3 8 9 9 17 13 10 74 77 82 1.8 90 1.6 0.5 New Zealand 4,529 1,097 309 1.1 0.8 8 8 7 22 17 13 71 75 82 2.0 86 1.3 0.9 Nicaragua 6,082 2,189 606 1.5 1.0 13 7 5 46 36 20 54 64 75 2.2 59 2.1 1.7 Niger 19,899 11,332 4,145 3.7 3.9 28 23 9 56 55 49 36 44 62 7.6 19 4.4 5.7 THE STATE OF THE WORLD’S CHILDREN 2016 139
TABLE 6. DEMOGRAPHIC INDICATORS Population (thousands) Total Urbanized Average annual Population fertility population growth rate of urban Countries 2015 annual growth rate (%) Crude death rate Crude birth rate Life expectancy rate (%) population (%) and areas total under 18 under 5 1990–2015 2015–2030α 1970 1990 2015 1970 1990 2015 1970 1990 2015 2015 2015 1990–2015 2015–2030α Nigeria 182,202 91,855 31,109 2.6 2.4 23 18 13 46 44 39 41 46 53 5.6 48 4.5 4.0 Niue 2 1 0 -1.5 0.2 – – – – – – – – – – 43 -1.1 0.2 Norway 5,211 1,129 315 0.8 0.9 10 11 8 16 14 12 74 76 82 1.8 80 1.2 1.1 Oman 4,491 1,051 385 3.6 1.0 16 5 3 48 38 19 50 67 77 2.7 78 4.0 1.6 Pakistan 188,925 77,779 24,664 2.3 1.7 15 11 7 43 40 29 53 60 66 3.6 39 3.1 2.6 Palau 21 8 2 1.4 1.0 – – – – – – – – – – 87 2.3 1.4 Panama 3,929 1,275 368 1.9 1.3 8 5 5 38 26 19 66 73 78 2.4 67 2.7 1.8 Papua New Guinea 7,619 3,330 996 2.4 1.9 17 10 8 44 35 28 46 56 63 3.7 13 1.9 2.8 Paraguay 6,639 2,412 674 1.8 1.1 7 6 6 37 34 21 65 68 73 2.5 60 2.8 1.9 Peru 31,377 10,417 3,020 1.5 1.1 14 7 6 42 30 20 53 66 75 2.4 79 2.0 1.4 Philippines 100,699 38,277 11,255 1.9 1.4 9 7 7 39 33 23 61 65 68 2.9 44 1.6 1.8 Poland 38,612 6,911 1,994 0.0 -0.2 8 10 10 17 15 10 70 71 78 1.3 61 0.0 0.1 Portugal 10,350 1,782 439 0.2 -0.3 11 10 10 21 11 8 67 74 81 1.3 63 1.4 0.6 Qatar 2,235 406 132 6.2 1.5 5 2 1 36 23 12 68 75 78 2.0 99 6.7 1.1 Republic of Korea 50,293 8,925 2,287 0.6 0.3 9 6 6 32 16 9 61 72 82 1.3 82 1.0 0.5 Republic of Moldova 4,069 777 223 -0.3 -0.4 10 10 11 20 19 11 65 68 72 1.2 45 -1.1 -0.2 Romania 19,511 3,670 924 -0.7 -0.7 10 11 13 21 14 9 68 70 75 1.5 55 -0.2 0.1 Russian Federation 143,457 27,684 9,166 -0.1 -0.2 9 12 14 15 14 13 69 68 70 1.7 74 -0.1 -0.2 Rwanda 11,610 5,532 1,695 1.9 2.0 20 33 7 50 48 31 44 33 65 3.8 29 8.9 4.8 Saint Kitts and Nevis 56 17 5 1.2 0.8 – – – – – – – – – – 32 0.9 1.5 Saint Lucia 185 52 14 1.2 0.6 9 6 7 39 28 15 63 71 75 1.9 19 -0.7 1.1 Saint Vincent and the Grenadines 109 33 9 0.1 0.2 9 7 7 40 25 16 65 70 73 2.0 51 0.9 0.7 Samoa 193 85 24 0.7 0.6 11 7 5 41 33 25 55 65 74 4.0 19 0.3 0.5 San Marino 32 6 1 1.1 0.3 – – – – – – – – – – 94 1.3 0.3 Sao Tome and Principe 190 94 30 2.1 2.0 13 10 7 41 40 34 56 62 67 4.5 65 3.8 2.7 Saudi Arabia 31,540 10,560 3,161 2.6 1.4 15 5 3 47 36 20 53 69 74 2.7 83 2.8 1.4 Senegal 15,129 7,596 2,601 2.8 2.7 25 11 6 50 44 38 39 57 67 5.0 44 3.2 3.5 Serbia 8,851 1,774 451 -0.3 -0.4 9 10 13 19 15 10 68 71 75 1.6 56 0.3 -0.2 Seychelles 96 27 8 1.2 0.3 9 7 8 35 23 17 66 71 73 2.3 54 1.6 0.9 Sierra Leone 6,453 3,166 1,004 2.0 1.9 29 27 13 46 46 35 35 37 51 4.5 40 2.5 2.7 Singapore 5,604 1,081 269 2.5 0.9 5 4 5 23 18 9 68 76 83 1.2 100 2.5 1.1 Slovakia 5,426 984 283 0.1 -0.1 9 10 10 18 15 11 70 71 76 1.4 54 -0.1 0.1 Slovenia 2,068 361 111 0.1 0.0 10 10 10 17 11 10 69 73 81 1.6 50 0.1 0.3 Solomon Islands 584 269 82 2.5 1.7 13 11 6 45 40 29 54 57 68 3.9 22 4.5 3.4 Somalia 10,787 5,787 1,971 2.1 2.8 23 20 12 46 48 43 41 45 56 6.4 40 3.4 4.0 South Africa 54,490 19,084 5,370 1.6 0.6 14 8 12 38 29 20 53 62 58 2.3 65 2.4 1.2 South Sudan 12,340 6,028 1,956 3.0 2.4 28 21 11 51 47 36 36 44 56 4.9 19 4.4 3.9 Spain 46,122 8,119 2,144 0.7 0.0 9 8 9 20 10 9 72 77 83 1.3 80 1.0 0.4 Sri Lanka 20,715 6,051 1,643 0.7 0.3 8 6 7 31 21 16 64 70 75 2.1 18 0.8 1.4 State of Palestine 4,668 2,200 703 3.2 2.5 13 5 4 50 46 32 56 68 73 4.1 75 3.5 2.6 Sudan 40,235 18,954 5,952 2.8 2.3 15 12 8 47 42 33 52 56 64 4.3 34 3.4 3.1 Suriname 543 175 48 1.1 0.7 9 7 7 37 28 18 63 67 71 2.3 66 1.2 0.7 Swaziland 1,287 569 173 1.6 1.1 18 10 14 49 43 29 48 59 49 3.2 21 1.3 1.6 Sweden 9,779 1,977 590 0.5 0.6 10 11 9 14 14 12 74 78 82 1.9 86 0.6 0.8 Switzerland 8,299 1,479 423 0.9 0.7 9 9 8 16 12 10 73 78 83 1.5 74 0.9 1.1 Syrian Arab Republic 18,502 8,206 2,192 1.6 2.9 11 5 6 46 36 23 59 70 70 2.9 58 3.0 2.7 Tajikistan 8,482 3,475 1,176 1.9 1.8 12 10 6 41 40 30 60 63 70 3.5 27 1.3 2.7 Thailand 67,959 14,656 3,799 0.7 0.0 10 6 8 38 19 11 59 70 75 1.5 50 2.9 1.6 The former Yugoslav Republic 2,078 433 115 0.2 0.0 7 7 9 25 18 11 66 71 76 1.5 57 0.1 0.3 of Macedonia Timor-Leste 1,185 581 204 1.9 1.9 23 16 7 42 43 37 40 48 69 5.6 33 3.6 3.4 Togo 7,305 3,553 1,160 2.6 2.4 19 12 9 48 43 35 47 56 60 4.5 40 3.9 3.4 Tonga 106 46 13 0.4 0.9 7 6 6 36 31 24 65 70 73 3.7 24 0.6 1.5 Trinidad and Tobago 1,360 334 96 0.4 0.1 7 8 10 27 21 14 65 68 71 1.8 8 0.3 -0.4 Tunisia 11,254 3,115 982 1.3 0.8 16 6 7 41 26 18 51 69 75 2.1 67 1.9 1.1 Turkey 78,666 24,240 6,821 1.5 0.7 15 8 6 40 26 16 52 64 76 2.1 73 2.3 1.3 Turkmenistan 5,374 1,791 528 1.5 0.9 12 9 8 37 35 21 58 63 66 2.3 50 1.9 1.7 Tuvalu 10 4 1 0.4 0.5 – – – – – – – – – – 60 1.9 1.6 Uganda 39,032 21,473 7,278 3.2 3.1 17 19 9 49 50 43 49 45 59 5.7 16 4.8 5.1 Ukraine 44,824 7,897 2,461 -0.5 -0.6 9 13 15 15 12 11 71 70 71 1.5 70 -0.4 -0.4 United Arab Emirates 9,157 1,510 491 6.5 1.2 7 3 2 37 26 11 62 71 77 1.8 86 7.0 1.9 United Kingdom 64,716 13,715 4,058 0.5 0.5 12 11 9 15 14 13 72 76 81 1.9 83 0.7 0.7 United Republic of Tanzania 53,470 27,611 9,398 3.0 2.9 18 15 7 48 44 39 47 50 66 5.1 32 4.9 4.7 THE STATE OF THE WORLD’S CHILDREN 2016 140
TABLE 6. DEMOGRAPHIC INDICATORS Population (thousands) Total Urbanized Average annual Population fertility population growth rate of urban Countries 2015 annual growth rate (%) Crude death rate Crude birth rate Life expectancy rate (%) population (%) and areas total under 18 under 5 1990–2015 2015–2030α 1970 1990 2015 1970 1990 2015 1970 1990 2015 2015 2015 1990–2015 2015–2030α United States 321,774 73,169 19,701 1.0 0.7 10 9 8 17 16 12 71 75 79 1.9 82 1.3 0.9 Uruguay 3,432 889 241 0.4 0.3 10 10 9 21 18 14 69 73 77 2.0 95 0.7 0.4 Uzbekistan 29,893 10,081 3,195 1.5 0.9 10 7 7 33 34 22 63 67 69 2.4 36 1.1 1.7 Vanuatu 265 113 35 2.4 1.9 14 8 5 42 36 26 52 63 72 3.3 26 3.7 3.0 Venezuela 31,108 10,418 2,960 1.8 1.1 7 5 6 37 29 19 65 70 74 2.3 89 2.1 1.2 (Bolivarian Republic of) Viet Nam 93,448 25,578 7,741 1.3 0.8 12 6 6 36 29 17 60 71 76 2.0 34 3.2 2.2 Yemen 26,832 12,629 3,925 3.2 2.0 25 12 7 53 52 32 41 58 64 4.0 35 5.1 3.4 Zambia 16,212 8,535 2,851 2.8 3.0 17 19 9 50 46 40 49 44 61 5.3 41 2.9 4.3 Zimbabwe 15,603 7,504 2,505 1.6 2.1 13 9 9 48 37 35 55 60 59 3.9 32 1.9 2.3 SUMMARY Sub-Saharan Africa 1,001,417 496,043 163,267 2.7 2.5 21 16 10 47 44 37 44 50 59 4.9 37 4.0 3.6 Eastern and Southern Africa 480,144 233,503 75,181 2.6 2.4 19 16 9 47 43 35 46 50 61 4.5 31 3.7 3.6 West and Central Africa 480,150 243,243 82,032 2.8 2.6 22 17 11 47 45 39 42 49 57 5.4 44 4.2 3.7 Middle East and North Africa 455,880 165,800 53,283 2.1 1.6 15 8 5 44 34 24 53 65 72 2.9 60 2.7 1.9 South Asia 1,743,865 621,390 173,210 1.7 1.1 17 11 7 40 33 21 48 58 68 2.5 32 2.8 2.3 East Asia and Pacific 2,097,940 504,114 146,650 0.9 0.4 11 7 7 37 24 14 58 68 74 1.8 54 3.3 1.7 Latin America and Caribbean 628,992 195,496 53,155 1.4 0.9 10 7 6 37 27 17 60 68 75 2.1 79 1.9 1.1 CEE/CIS 413,760 98,592 30,726 0.2 0.1 10 11 11 20 18 15 66 68 72 1.9 65 0.3 0.4 Least developed countries 954,158 444,297 139,575 2.5 2.2 21 15 8 47 42 32 44 52 64 4.1 31 4.0 3.6 World 7,309,846 2,262,157 668,970 1.3 1.0 13 9 8 33 26 19 59 65 72 2.5 54 2.2 1.6 For a complete list of countries and areas in the regions, subregions and country categories, see page 112 or visit . It is not advisable to compare data from consecutive editions of The State of the World’s Children. DEFINITIONS OF THE INDICATORS MAIN DATA SOURCES Crude death rate – Annual number of deaths per 1,000 population. Population – United Nations Population Division. Growth rates calculated by UNICEF Crude birth rate – Annual number of births per 1,000 population. based on data from United Nations Population Division. Life expectancy– Number of years newborn children would live if subject to the mortality Crude death and birth rates – United Nations Population Division. risks prevailing for the cross section of population at the time of their birth. Life expectancy – United Nations Population Division. Total fertility rate – Number of children who would be born per woman if she lived to the Total fertility rate – United Nations Population Division. end of her childbearing years and bore children at each age in accordance with prevailing age-specific fertility rates. NOTES Urbanized population – Percentage of population living in urban areas as defined − Data not available. according to the national definition used in the most recent population census. α Based on medium-fertility variant projections. THE STATE OF THE WORLD’S CHILDREN 2016 141
TABLE 7. ECONOMIC INDICATORS Population Debt Average below National ODA service annual international monetary ODA inflow as a % of GNI per capita (US$) GDP per capita rate of poverty line child Public spending as a inflow in as a % of exports of Share of Countries average annual inflation of US$1.90 poverty % of GDP (2009–2013*) millions recipient goods and household income US$ PPP US$ growth rate (%) (%) per day (%) (%) allocated to: US$ GNI services (%, 2009–2013*) and areas 2014 2014 1970–1990 1990–2014 1990–2014 2009–2013* 2010–2014* health education military 2014 2014 2013 poorest 40% richest 20% Afghanistan 680 2,000 e – 5.6 x 8x – – 2 5 1 4,823 23 0 – – Albania 4,450 10,180 -0.6 x 5.7 11 1 – 3 – 1 280 2 6 22 38 Algeria 5,490 13,880 1.8 1.7 11 – – 5 – 5 158 0 1 – – Andorra 43,270 x – -1.3 1.2 x 4x – – 6 2 – – – – – – Angola c 6,340 x – -0.4 x – 30x – 2 3 4 231 – 7 15x 49x Antigua and Barbuda 13,300 21,370 7.9 x 1.2 3 – – 3 3 – 2 0 – – – Argentina 13,480 – -0.8 2.3 11 2 – 5 5 1 49 0 – 15 47 Armenia 4,020 8,450 – 6.2 37 2 37 2 2 4 265 2 32 21 40 Australia 64,540 42,760 1.6 2.0 3 – – 6 5 2 – – – 19 42 Austria 49,670 45,930 2.5 1.6 2 – – 8 6 1 – – – 21 38 Azerbaijan 7,590 16,910 – 6.4 40 0x 5 1 2 5 215 0 6 30x 30x Bahamas 20,980 22,290 1.9 0.1 3 – – 3 – – – – – – – Bahrain 21,060 x 37,680 x -1.0 x 0.1 5 – – 3 3 4 – – – – – Bangladesh 1,080 3,330 0.7 3.6 6 44 – 1 2 1 2,418 1 3 21 41 Barbados 15,310 x 15,190 x 1.4 x 1.2 3 – – 4 6 – – – – – – Belarus 7,340 17,610 – 5.0 94 0 9 4 5 1 120 0 6 24 36 Belgium 47,260 43,220 2.2 1.4 2 – – 8 6 1 – – – 23 36 Belize 4,350 x 7,590 x 3.1 1.7 1 – – 4 7 1 36 – 12 – – Benin 890 2,020 0.4 1.1 5 53 – 2 5 1 600 6 – 16 51 Bhutan 2,370 7,280 7.0 x 5.3 6 2 – 3 6 – 130 7 11 18 46 Bolivia (Plurinational State of) 2,870 6,290 -1.0 2.0 7 8 – 4 6 1 672 2 4 12 52 Bosnia and Herzegovina 4,760 10,010 – 7.4 x 5x 0x – 7 – 1 632 3 10 20x 41x Botswana 7,240 16,030 8.1 2.7 9 18 26y 4 9 3 100 1 2 9 65 Brazil 11,530 15,590 2.2 1.8 39 5 – 5 6 1 912 0 28 11 57 Brunei Darussalam 37,320 x 72,190 x -2.2 x -0.4 5 – – 2 3 2 – – – – – Bulgaria 7,620 16,260 3.4 x 3.5 30 2 28 4 4 1 – – 13 18 43 Burkina Faso 700 1,600 1.4 2.9 3 55 – 4 4 1 1,120 9 – 17 47 Burundi 270 770 1.2 -1.5 14 78x 55y 4 5 2 502 16 8 21x 43x Cabo Verde 3,450 6,200 3.5 x 6.3 1 18x – 3 5 1 230 13 4 14x 53x Cambodia 1,020 3,080 – 5.9 x 4x 6 – 1 3 2 799 5 1 22 40 Cameroon 1,350 2,950 3.4 0.6 4 29x – 2 3 1 852 3 3 15x 49x Canada 51,630 43,360 2.0 1.6 2 – – 8 5 1 – – – 20 41 Central African Republic 320 600 -1.3 -0.6 3 66x – 2 1 3 610 35 – 10x 61x Chad 980 2,070 -0.9 3.3 6 38 – 2 2 5 388 3 – 15 49 Chile 14,910 21,580 1.5 3.3 6 1 23 3 5 2 241 0 – 13 57 China 7,400 13,170 6.6 9.2 5 11 – 3 – 2 -960 0 1 14 47 Colombia 7,970 12,910 1.9 2.1 12 6 – 5 5 3 1,221 0 13 11 58 Comoros 790 1,430 -0.2 x -0.2 3 14x – 2 – – 74 12 – 11x 61x Congo 2,720 5,200 3.3 0.6 8 29 54x 1 6 2 106 1 – 16 46 Cook Islands – – – – – – – – – – – – – – – Costa Rica 10,120 14,420 0.8 2.9 11 2 – 7 7 – 54 0 20 12 54 Côte d'Ivoire 1,450 3,130 -1.7 -0.5 5 29x – 2 – 2 922 3 9 15x 49x Croatia 12,980 20,500 – 2.6 x 4x 1 21 6 4 2 – – – 20 39 Cuba 5,880 x 18,630 x 3.9 3.3 x 4x – – 10 13 3 262 – – – – Cyprus 26,370 29,800 5.9 x 1.5 3 – – 4 7 2 – – – 20 43 Czech Republic 18,370 28,020 – 2.5 5 0 – 6 4 1 – – – 24 36 Democratic People's Republic a – – – – – – – – – 153 – – – – of Korea Democratic Republic of the Congo 380 650 -2.1 -1.9 165 77 – 2 2 1 2,398 8 3 16 48 Denmark 61,310 46,210 2.0 1.2 2 – – 9 9 1 – – – 23 38 Djibouti b – – 0.4 3 18 – 5 4 – 163 – 8 14 50 Dominica 6,930 10,480 5.2 x 2.0 3 – – 4 – – 16 3 8 – – Dominican Republic 6,040 12,600 2.1 3.7 10 2 – 3 4 1 167 0 12 14 53 Ecuador 6,090 11,190 1.7 1.5 5 4 – 3 4 3 160 0 10 13 53 Egypt 3,050 10,260 4.1 2.6 8 – 29 2 – 2 3,532 1 5 22x 40x El Salvador 3,920 8,000 -1.9 2.2 4 3 44 4 3 1 98 0 10 15 50 Equatorial Guinea 10,210 17,660 -2.4 x 19.0 7 – – 4 – 4 1 0 – – – Eritrea 480x 1,400 x,e – -0.2 x 13x – – 1 – – 83 – – – – Estonia 19,030 26,330 – 4.7 x 6x 1 – 5 5 2 – – – 20 41 Ethiopia 550 1,500 – 3.8 8 34 – 3 5 1 3,585 6 – 21 42 Fiji 4,870 8,410 0.6 1.1 4 4x – 3 4 2 92 2 2 16x 50x Finland 48,420 39,940 2.9 2.1 2 – – 7 7 1 – – – 23 37 France 42,960 39,610 2.2 1.2 2 – – 9 6 2 – – – 20 41 THE STATE OF THE WORLD’S CHILDREN 2016 142
TABLE 7. ECONOMIC INDICATORS Population Debt Average below National ODA service annual international monetary ODA inflow as a % of GNI per capita (US$) GDP per capita rate of poverty line child Public spending as a inflow in as a % of exports of Share of Countries average annual inflation of US$1.90 poverty % of GDP (2009–2013*) millions recipient goods and household income US$ PPP US$ growth rate (%) (%) per day (%) (%) allocated to: US$ GNI services (%, 2009–2013*) and areas 2014 2014 1970–1990 1990–2014 1990–2014 2009–2013* 2010–2014* health education military 2014 2014 2013 poorest 40% richest 20% Gabon 9,720 17,200 0.6 -0.7 6 8x – 2 – 1 111 1 – 16x 49x Gambia 500x 1,600 x 0.7 0.3 x 6x 45x – 4 4 1 100 – – 14x 53x Georgia 3,720 7,510 3.1 3.3 52 12 27y 2 2 3 563 3 13 16 46 Germany 47,640 46,850 2.3 1.3 1 – – 9 5 1 – – – 22 39 Ghana 1,590 3,900 -2.0 2.9 25 25x – 4 8 1 1,126 3 5 15x 49x Greece 22,680 x 25,660 x 1.3 1.4 4 – – 7 – 3 – – – 17 42 Grenada 7,910 11,720 4.2 x 2.4 4 – – 3 – – 39 5 14 – – Guatemala 3,430 7,250 0.1 1.3 6 12 68 2 3 0 277 0 16 12 57 Guinea 470 1,130 – 0.6 11 35 – 2 4 3 561 9 4 20 42 Guinea-Bissau 550 1,380 0.8 -0.9 14 67 – 2 – 2 109 11 – 13 57 Guyana 3,940 x 6,940 x,e -1.5 2.9 x 10x – – 4 3 1 159 5 2 – – Haiti 820 1,730 – -0.6 x 12x 54 – 1 – – 1,084 12 0 8 64 Holy See – – – – – – – – – – – – – – – Honduras 2,270 4,570 0.8 1.7 11 19 – 4 6 1 604 3 10 10 58 Hungary 13,340 23,630 – 2.5 x 9x 0 – 5 5 1 – – – 21 39 Iceland 46,350 x 41,090 x 3.2 2.1 5 – – 7 7 0 – – – 23 36 India 1,570 5,630 2.0 5.0 6 21 – 1 4 3 2,984 0 7 20 44 Indonesia 3,630 10,190 4.5 2.9 14 16 17x 1 4 1 -388 0 19 19 44 Iran (Islamic Republic of) 7,120 x 16,590 x -4.3 2.4 21 0 – 3 4 2 81 – – 18 45 Iraq 6,500 15,030 4.2 3.7 30 – – 3 – 3 1,370 1 – 22 39 Ireland 46,550 42,270 2.8 3.8 3 – – 6 6 1 – – – 20 41 Israel 35,320 32,830 1.9 2.4 4 – – 4 6 6 – – – 14 47 Italy 34,270 34,700 2.8 0.6 3 – – 7 4 2 – – – 19 42 Jamaica 5,150 8,640 -1.3 0.4 14 2x – 3 6 1 92 1 14 15x 52x Japan 42,000 37,920 3.4 0.7 -1 – – 8 4 1 – – – 20x 40x Jordan 5,160 11,910 2.5 x 2.6 4 0 19 5 – 4 2,699 8 4 20 42 Kazakhstan 11,850 21,710 – 4.3 45 0 – 3 3 1 88 0 34 24 36 Kenya 1,290 2,940 1.2 0.8 10 34x – 2 6 2 2,665 4 5 13x 54x Kiribati 2,950 3,340 e -5.0 1.0 3 14x – 8 – – 79 26 – 18x 44x Kuwait 49,300 79,850 -6.7 x 0.0 x 6x – – 2 – 3 – – – – – Kyrgyzstan 1,250 3,220 – 1.1 30 3 46y 4 7 3 624 9 7 24 37 Lao People's Democratic Republic 1,660 5,060 – 4.9 18 30 – 1 3 0 472 4 11 18 46 Latvia 15,280 22,690 – 5.7 x 6x 1 – 4 5 1 – – – 19 42 Lebanon 10,030 17,590 e – 2.1 6 – – 4 3 4 820 2 12 – – Lesotho 1,330 3,150 3.0 2.7 8 60 – 9 – 2 104 4 3 10 58 Liberia 370 700 -4.1 2.4 4 69x – 3 3 1 744 44 0 18x 44x Libya 7,820 16,000 e – -1.4 x 11x – – 3 – 4 210 0 – – – Liechtenstein d – 2.2 2.9 x 1x – – – 3 – – – – – – Lithuania 15,430 25,490 – 5.8 x 3x 1 – 5 5 3 – – – 19 42 Luxembourg 75,990 65,040 2.6 2.2 3 – – 6 – 0 – – – 19 42 Madagascar 440 1,400 -2.4 -0.3 12 82 – 3 2 1 583 6 2 17 48 Malawi 250 790 0.0 1.4 24 71 – 4 8 2 930 23 – 15 52 Malaysia 11,120 24,770 4.0 3.2 4 0 – 2 6 2 12 0 4 13 51 Maldives 6,410 10,920 – 4.1 x 6x 6 – 6 6 – 25 1 2 18 44 Mali 650 1,510 1.4 1.5 5 49 – 2 4 1 1,234 11 2 20 41 Malta 21,000 x 27,020 x 6.0 2.2 x 3x – – 6 7 1 – – – – – Marshall Islands 4,390 4,700 e – 0.7 2 – – 14 – – 56 24 – – – Mauritania 1,270 3,710 -1.1 1.2 9 11x – 2 4 3 257 5 5 17x 44x Mauritius 9,630 18,150 3.1 x 3.6 6 1 – 2 4 0 49 0 41 19 44 Mexico 9,870 16,640 1.7 1.1 10 3 54 3 5 1 807 0 8 14 54 Micronesia (Federated States of) 3,200 3,590 e – 0.6 2 50x – 11 – – 116 34 – 7x 64x Monaco d – 1.5 1.7 x 2x – – 4 1 – – – – – – Mongolia 4,280 11,120 – 4.1 23 0 – 4 5 1 315 3 24 20 42 Montenegro 7,320 14,530 – 2.8 x 6x 2 13y 4 – 1 102 2 16 20 41 Morocco 3,070 7,290 2.6 2.8 2 3x 11x 2 6 4 2,247 2 13 17x 48x Mozambique 600 1,120 -1.1 x 5.1 13 69x – 3 7 1 2,103 13 2 15x 51x Myanmar 1,270 – 1.4 11.8 x 15x – – 0 – 4 1,380 2 1 – – Namibia 5,630 9,810 -2.1 x 2.2 8 23 34y 5 8 4 227 2 – 9 66 Nauru – – – – – – – – – – – – – – – Nepal 730 2,410 1.2 2.6 8 15 – 3 4 2 880 4 3 20 41 Netherlands 51,890 48,260 1.5 1.7 2 – – 10 6 1 – – – 23 37 New Zealand 41,070 34,970 1.5 x 1.7 2 – – 8 7 1 – – – – – THE STATE OF THE WORLD’S CHILDREN 2016 143
TABLE 7. ECONOMIC INDICATORS Population Debt Average below National ODA service annual international monetary ODA inflow as a % of GNI per capita (US$) GDP per capita rate of poverty line child Public spending as a inflow in as a % of exports of Share of Countries average annual inflation of US$1.90 poverty % of GDP (2009–2013*) millions recipient goods and household income US$ PPP US$ growth rate (%) (%) per day (%) (%) allocated to: US$ GNI services (%, 2009–2013*) and areas 2014 2014 1970–1990 1990–2014 1990–2014 2009–2013* 2010–2014* health education military 2014 2014 2013 poorest 40% richest 20% Nicaragua 1,870 4,790 -3.7 2.1 16 11 – 4 4 1 430 4 11 14 51 Niger 410 910 -1.9 0.0 4 50 63x 2 5 1 918 12 – 22 41 Nigeria 2,970 5,710 -2.3 3.4 19 54 – 1 – 0 2,476 0 – 15 49 Niue – – – – – – – – – – – – – – – Norway 103,630 66,330 3.3 1.6 4 – – 8 7 1 – – – 24 35 Oman 16,870 x 33,690 x 3.2 0.6 6 – – 2 4 9 – – – – – Pakistan 1,400 5,090 2.7 1.7 11 8 – 1 2 3 3,612 1 9 23 40 Palau 11,110 14,280 e – -0.4 x 4x – – 8 – – 23 10 – – – Panama 11,130 19,930 0.2 3.8 3 3 – 5 3 – -196 0 6 11 56 Papua New Guinea 2,240 2,790 e -1.0 0.9 7 39 – 4 – 1 577 3 – 14 49 Paraguay 4,400 8,470 3.8 0.9 10 2 – 4 5 1 60 0 12 13 53 Peru 6,360 11,440 -0.5 3.4 8 4 – 3 3 1 325 0 13 14 50 Philippines 3,500 8,450 0.6 2.3 6 13 – 2 3 1 676 0 6 15 50 Poland 13,690 23,930 – 4.2 8 0 – 5 5 2 – – – 20 41 Portugal 21,360 28,010 2.5 1.2 3 – – 7 5 2 – – – 19 43 Qatar 92,200 134,420 – 1.5 x 8x – – 2 – 1 – – – – – Republic of Korea 27,090 34,620 7.5 4.3 3 – – 4 5 3 – – – – – Republic of Moldova 2,560 5,500 1.8 x 0.8 32 0 13y 5 8 0 517 6 12 23 38 Romania 9,520 19,020 – 3.4 36 0 32 4 3 1 – – 27 23 36 Russian Federation 13,220 24,710 – 2.5 43 0 – 3 – 4 – – – 16 48 Rwanda 700 1,630 1.1 3.3 9 60 47y 7 5 1 1,034 13 3 13 58 Saint Kitts and Nevis 14,920 22,600 6.5 x 1.8 3 – – 2 – – – – – – – Saint Lucia 7,260 10,540 5.1 x 1.2 3 – – 5 5 – 18 1 5 – – Saint Vincent and the Grenadines 6,610 10,730 3.3 2.9 2 – – 4 5 – 9 1 14 – – Samoa 4,060 5,610 e – 2.5 5 1x – 7 – – 93 12 4 16x 50x San Marino d – 1.8 3.4 x 3x – – 5 2 – – – – – – Sao Tome and Principe 1,670 3,140 – 3.0 x 14x 34 – 3 9 – 39 12 7 21 40 Saudi Arabia 25,140 x 51,320 x -2.1 1.4 5 – – 2 – 9 – – – – – Senegal 1,050 2,300 -0.6 1.1 3 38 49 2 6 2 1,107 7 – 17 47 Serbia 5,820 12,150 – 3.7 x 20x 0 30 6 4 2 371 1 33 22 38 Seychelles 14,100 24,780 2.9 2.1 7 0x – 3 4 1 10 1 – 16x 49x Sierra Leone 700 1,770 -0.6 1.4 18 52 – 2 3 1 911 21 1 20 42 Singapore 55,150 80,270 5.9 3.5 1 – – 2 3 3 – – – – – Slovakia 17,750 26,820 – 4.2 x 4x 0 – 6 4 1 – – – 23 35 Slovenia 23,580 29,920 – 2.5 x 4x 0 – 7 6 1 – – – 24 35 Solomon Islands 1,830 2,020 e – -0.4 7 46x – 7 10 – 199 18 7 14x 52x Somalia a – -0.8 – – – – – – 0 1,109 21 – – – South Africa 6,800 12,700 0.1 1.2 8 17 56 4 6 1 1,070 0 7 7 69 South Sudan 970 1,800 e – – – – – 1 – 7 1,964 17 – – – Spain 29,440 33,080 1.9 1.5 3 – – 7 4 1 – – – 18 42 Sri Lanka 3,460 10,370 3.0 4.4 10 2 – 1 2 2 488 1 7 18 47 State of Palestine 3,060 5,000 – 1.8 x 3x 0 – – – – 2,487 18 – 20 43 Sudan 1,710 3,920 -0.1 3.5 24 15 – 2 2 – 872 1 4 19 42 Suriname 9,950 17,040 -2.3 x 2.2 37 – – 3 – – 13 0 – – – Swaziland 3,550 7,880 3.1 1.0 9 42 – 5 8 2 86 2 1 12 57 Sweden 61,610 46,750 1.8 2.0 2 – – 8 6 1 – – – 23 36 Switzerland 88,120 x 57,960 x 1.7 x 1.0 1 – – 8 5 1 – – – 21 40 Syrian Arab Republic b – 2.1 1.8 x 7x – – 2 5 – 4,198 – – 19x 44x Tajikistan 1,080 2,660 – 0.9 59 5 – 2 4 1 356 4 8 21 39 Thailand 5,780 14,870 4.8 3.1 3 0 – 4 5 1 351 0 4 17 46 The former Yugoslav Republic 5,150 12,800 – 1.8 18 1x 32 4 – 1 211 2 17 15x 50x of Macedonia Timor-Leste 2,680 5,080 e – 3.4 x 5x 47x – 1 9 2 247 8 – 22x 41x Togo 570 1,290 -0.5 0.1 4 54 – 4 4 2 208 5 – 14 52 Tonga 4,260 5,270 e – 1.3 6 1 – 4 – – 80 18 – 18 45 Trinidad and Tobago 20,070 31,970 -0.5 5.1 5 – – 3 – 1 – – – – – Tunisia 4,230 11,020 2.5 3.0 4 2 – 4 6 2 921 2 10 18 43 Turkey 10,830 18,980 1.9 2.5 37 0 33 4 – 2 3,442 0 26 16 47 Turkmenistan 8,020 14,520 e – 3.5 74 – – 1 3 – 34 0 – – – Tuvalu 5,720 5,410 e – 1.6 4 – – 20 – – 34 63 – – – Uganda 670 1,720 – 3.6 8 33 22 4 2 1 1,633 6 1 16 49 Ukraine 3,560 8,560 – 1.0 54 0 – 4 7 2 1,404 1 34 25 35 United Arab Emirates 44,600 67,720 -4.3 x -2.9 5 – – 2 – 6 – – – – – THE STATE OF THE WORLD’S CHILDREN 2016 144
TABLE 7. ECONOMIC INDICATORS Population Debt Average below National ODA service annual international monetary ODA inflow as a % of GNI per capita (US$) GDP per capita rate of poverty line child Public spending as a inflow in as a % of exports of Share of Countries average annual inflation of US$1.90 poverty % of GDP (2009–2013*) millions recipient goods and household income US$ PPP US$ growth rate (%) (%) per day (%) (%) allocated to: US$ GNI services (%, 2009–2013*) and areas 2014 2014 1970–1990 1990–2014 1990–2014 2009–2013* 2010–2014* health education military 2014 2014 2013 poorest 40% richest 20% United Kingdom 43,430 39,040 2.2 1.8 2 – – 8 6 2 – – – 20 40 United Republic of Tanzania 920 2,510 – 2.5 14 47 – 3 5 1 2,648 6 2 19 46 United States 55,200 55,860 2.2 1.6 2 – – 8 5 5 – – – 15 46 Uruguay 16,350 20,220 0.9 2.5 14 0 – 5 4 2 89 0 – 15 48 Uzbekistan 2,090 5,830 e – 3.2 64 67x – 3 – – 324 0 – 19x 43x Vanuatu 3,160 3,030 e 1.1 x 0.6 3 15 – 3 5 – 98 12 1 18 44 Venezuela (Bolivarian Republic of) 12,500 x 17,700 x -1.2 0.6 31x 9x – 2 7 1 41 – – 12x 51x Viet Nam 1,890 5,350 – 5.5 11 3 – 3 6 2 4,218 2 3 17 46 Yemen 1,300 x 3,650 x – 0.7 x 15x – – 1 – 5 1,164 – 2 20x 44x Zambia 1,680 3,690 -2.4 2.4 24 64 65y 3 – 1 995 4 3 11 61 Zimbabwe 840 1,650 -0.4 -2.8 3 – 78 – 2 1 758 6 – – – SUMMARY Sub-Saharan Africa 1,661 3,416 -0.1 2.4 17 47 – 3 5 2 40,706 2 6 16 49 Eastern and Southern Africa 1,610 3,383 0.3 1.7 10 41 – 3 5 2 22,543 3 7 16 51 West and Central Africa 1,703 3,405 -0.7 2.8 22 56 – – – – 17,129 2 – 16 48 Middle East and North Africa 6,561 14,047 0.8 1.4 11 – – – – – 20,921 1 6 – – South Asia 1,500 5,297 2.0 4.6 7 22 – 1 4 2 15,360 1 7 20 43 East Asia and Pacific 6,845 12,983 6.0 7.7 5 11 – 3** 4** 2** 8,723 0 3 15 47 Latin America and Caribbean 9,634 14,247 1.4 1.8 22 5 – 4 6 1 7,739 0 15 12 55 CEE/CIS 9,216 17,627 – 2.8 43 0 – – – – 9,549 1 24 19 44 Least developed countries 845 2,133 0.0 3.1 19 45 – 2 3 2 43,726 5 4 18 45 World 10,647 14,633 2.5 2.9 7 18 – 7** 5** 2** 101,963 0 8 17 46 For a complete list of countries and areas in the regions, subregions and country categories, see page 112 or visit . It is not advisable to compare data from consecutive editions of The State of the World’s Children. DEFINITIONS OF THE INDICATORS MAIN DATA SOURCES GNI per capita – Gross national income (GNI) is the sum of value added by all GNI per capita – The World Bank. resident producers plus any product taxes (less subsidies) not included in the GDP per capita – The World Bank. valuation of output plus net receipts of primary income (compensation of employees Rate of inflation – The World Bank. and property income) from abroad. Gross national income per capita is GNI divided by midyear population. GNI per capita in US dollars is converted using the World Population below international poverty line of US$1.90 per day – The World Bank. Bank Atlas method. National monetary child poverty – Data are compiled from official national government sources GNI per capita (PPP US$) – GNI per capita converted to international dollars such as Statistical Office tabulations and national household survey and poverty reports, and from taking into account differences in price levels (purchasing power) between official regional databases such as those compiled by Eurostat. National estimates are based on countries. Based on data from the International Comparison Programme. representative household income or expenditure surveys. GDP per capita – Gross domestic product (GDP) is the sum of value added by all Spending on health, education and military – The World Bank. resident producers plus any product taxes (less subsidies) not included in the ODA – Organisation for Economic Co-operation and Development. valuation of output. Gross domestic product per capita is GDP divided by midyear population. Growth is calculated from constant price GDP data in local currency. Debt service – The World Bank. Population below international poverty line of US$1.90 per day – Poverty Share of household income – The World Bank. headcount ratio at $1.90 a day is the percentage of the population living on less than $1.90 a day at 2011 international prices. As a result of revisions in PPP exchange rates, poverty rates for individual countries cannot be compared with NOTES poverty rates reported in earlier editions. a low-income country (GNI per capita is $1,045 or less). National monetary child poverty – Percentage of children aged 0–17 years old b lower-middle-income country (GNI per capita is $1,046 to $4,125). living in households with income or consumption below the government defined c upper-middle-income country (GNI per capita is $4,126 to $12,735). national monetary poverty threshold. d high-income country (GNI per capita is $12,736 or more). ODA – Net official development assistance. – Data not available. Debt service – Sum of interest payments and repayments of principal on external public and publicly guaranteed long-term debts. x Data refer to years or periods other than those specified in the column heading. Such data are not Share of household income – Percentage of income received by the 20 per cent included in the calculation of regional and global averages. of households with the highest income and by the 40 per cent of households with y Data differ from the standard definition or refer to only part of a country. If they fall within the the lowest income. reference period, such data are included in the calculation of regional and global averages. e Estimate is based on regression; other PPP figures are extrapolated from the 2011 International Comparison Programme benchmark estimates. * Data refer to the most recent year available during the period specified in the column heading. ** Excludes China. THE STATE OF THE WORLD’S CHILDREN 2016 145
TABLE 8. WOMEN Enrolment ratios: Survival Life Adult females as a rate to the Post-natal health + † expec- literacy % of males last grade Contra- Antenatal care (%) Delivery care (%) check (%) Maternal mortality ratio tancy: rate: of primary: ceptive females females females as preva- At least Skilled Institu- For Lifetime risk of as a % as a % of Primary Second- a % of lence At least four attendant tional C- new- For maternal death Countries of males males GER ary GER males (%) one visit visits at birth delivery section borns mothers Reported Adjusted (1 in:) and areas 2009– 2010– 2015 2014* 2010–2014* 2010–2014* 2015* 2010–2015* 2010–2015* 2010–2015* 2010–2015* 2015 Afghanistan 104 39 70 56 – 21 63 23 45 43 4 – 23 330 396 52 Albania 107 98 98 93 101 69x 97x 67x 99x 97x 19x – – 6 29 1,900 Algeria 106 79x 94 104 102 57 93 67 97 97 16 – – – 140 240 Andorra – – – – 99 – – – – – – – – – – – Angola 106 72 64 65 73x – 80x – 47x 46x – – – – 477 32 Antigua and Barbuda 107 101 92 101 – – 100x 100 100 – – – – 0x – – Argentina 110 100 99 108 102 77 98 90 97 99 28x – – 37 52 790 Armenia 111 100 116 x 117x 100 55 99 93 100 99 13 50 92 22 25 2,300 Australia 105 – 99 95 – 72x 98x 92x – 99 31x – – – 6 8,700 Austria 106 – 99 95 101 70x – – – 99 24x – – – 4 18,200 Azerbaijan 109 100 99 99 105 55 92 66 97 93 20 – 83 15 25 1,600 Bahamas 108 – 102 105 96x 45x 98x 85 98 – – – – 37 80 660 Bahrain 102 95 – – 97 – 100x 100 100 – – – – 17x 15 3,000 Bangladesh 104 89 106 108 114x 62 64 31 42 37 23 32 34 190 176 240 Barbados 107 – 101 103 – 59 93 88 98 100 21 98 97 52 27 2,100 Belarus 118 100 100 98 100 63 100 100 100 100 25 100 100 0 4 13,800 Belgium 106 – 100 114 103 70 – – – – 18x – – – 7 8,000 Belize 108 – 95 104 98 55 96 83 96 94 28 97 95 45 28 1,300 Benin 105 45x 91 68 96 18 83 59 77 87 5 80 78 350 405 51 Bhutan 101 59x 101 107 101 66 98 85 75 74 12 30 41 86 148 310 Bolivia (Plurinational 107 91 97 99 101 61x 90 75 85 71 27 – – 310x 206 160 State of) Bosnia and Herzegovina 107 98 – – 100 46 87 84 100 100 14 – – 0 11 6,800 Botswana 107 101 97 106 103 53x 94x 73x 95x 100 – – – 160 129 270 Brazil 111 101 – – – 81x 98x 89 98 99 56 – – 58 44 1,200 Brunei Darussalam 105 97 100 100 97 – 99x 93 100 100x – – – – 23 2,300 Bulgaria 110 99 99 97 101 69x – – 100 94 36 – – 12 11 6,200 Burkina Faso 105 59x 96 87 115 16 94 34 66 66 2 26 72 340 371 48 Burundi 107 95x 101 85 127 22 99 33 60 60 4 8 30 500 712 23 Cabo Verde 105 89 95 114 104 61x 98x 72x 92 76x 11x – – 10 42 900 Cambodia 106 80 95 85x 134 56 95 76 89 83 6 79 90 170 161 210 Cameroon 104 83 89 85 102 34 83 59 65 61 2 69 65 780 596 35 Canada 105 – 101 100 – 74x 100x 99x 100 98 26x – – 11 7 8,800 Central African Republic 108 48 74 51 96 15 68 38 54 53 5 – – 540x 882 27 Chad 104 61 77 46 85 6 53 31 24 22 2 – 15 860 856 18 Chile 107 100 97 102 101 58x – – 100 100 50 – – 17 22 2,600 China 104 95 100 102 – 85x 96 – 100 100 36 – – 22 27 2,400 Colombia 110 100 100 x 110x 106 79 97 89 99 99 46 7 1 71 64 800 Comoros 105 89 94 104 – 19 92 49 82 76 10 14 49 170 335 66 Congo 105 84 107 87 – 30 93 79 94 92 5 86 80 440 442 45 Cook Islands – – 97 110 94 31 100x – 100x 100x – – – 0 – – Costa Rica 106 100 99 105 102 76 98 90 97 99 22 – – 23 25 2,100 Côte d'Ivoire 103 59 87 71 89 18 91 44 59 57 3 34 70 610 645 32 Croatia 109 99 100 104 101 – – 93 100 – 20 – – 3 8 7,900 Cuba 105 100 96 103 101 74 99 98 99 99 40 98 99 35 39 1,800 Cyprus 106 99 101 100 102 – 99x – – 100 – – – – 7 9,400 Czech Republic 108 – 100 101 100 86x – – 100 100 20x – – 1 4 14,800 Democratic People's 110 100x 100 x 100x – 71 100x 94x 100x 95x 13x – – 77x 82 660 Republic of Korea Democratic Republic 105 72 91 62 99 20 88 48 80 80 5 8 44 850 693 24 of the Congo Denmark 105 – 99 102 101 – – – – 98 21x – – – 6 9,500 Djibouti 105 – 87 81 – 19 88 23 87 87 11 – – 380 229 140 Dominica – – 100 107 – – 100x – 100 – – – – 110 – – Dominican Republic 109 100 91 111 105 70 98 93 98 98 58 95 95 110 92 400 Ecuador 107 97 100 104 99 80 84x 58x 94 92 41 – – 46 64 580 Egypt 106 79 99 98 101x 59 90 83 92 87 52 14 82 52 33 810 El Salvador 113 94 95 99 106 72 96 90 98 98 32 97 94 38 54 890 Equatorial Guinea 105 95 98 – 100 13 91 67 68 67 7 – – 310 342 61 Eritrea 107 77 85 80 99 8 89 57 34 34 3 – – 490 501 43 Estonia 113 100 99 99 100 63x – 97 100x 99 – – – 7 9 6,300 Ethiopia 106 59x 92 91 116 42 41 32 16 16 2 0 13 680 353 64 Fiji 109 – 101 111 98 44 100x 94 100 99 – – – 59 30 1,200 Finland 107 – 100 109 100 – 100x – – 100 16x – – – 3 21,700 THE STATE OF THE WORLD’S CHILDREN 2016 146
TABLE 8. WOMEN Enrolment ratios: Survival Life Adult females as a rate to the Post-natal health + † expec- literacy % of males last grade Contra- Antenatal care (%) Delivery care (%) check (%) Maternal mortality ratio tancy: rate: of primary: ceptive females females females as preva- At least Skilled Institu- For Lifetime risk of as a % as a % of Primary Second- a % of lence At least four attendant tional C- new- For maternal death Countries of males males GER ary GER males (%) one visit visits at birth delivery section borns mothers Reported Adjusted (1 in:) and areas 2009– 2010– 2015 2014* 2010–2014* 2010–2014* 2015* 2010–2015* 2010–2015* 2010–2015* 2010–2015* 2015 France 107 – 99 101 – 76x 100x 99 – 98 21x – – – 8 6,100 Gabon 102 94 97 – – 31 95 78 89 90 10 25 60 320 291 85 Gambia 105 72 105 95 107 9 86 78 57 63 2 6 76 430 706 24 Georgia 110 100 101 100 100 53 98 87 100 100 39 – – 32 36 1,500 Germany 106 – 99 95 100 66x 100x 99 – 99 29x – – – 6 11,700 Ghana 103 83 100 94 97 27 91 87 71 73 13 23 81 450x 319 74 Greece 107 98 99 96 101 76x – – – – – – – – 3 23,700 Grenada 107 – 96 98 – 54x 100x – 99 – – – – 23 27 1,500 Guatemala 110 85 96 94 99 61 91 86 66 65 26 – 75 140 88 330 Guinea 102 33 88 66 152 6 85 57 45 40 2 25 37 720 679 29 Guinea-Bissau 107 64 93 – – 16 92 65 45 44 4 55 48 900 549 38 Guyana 107 106 97 99 105 34 91 87 92 93 17 95 93 86x 229 170 Haiti 107 84x 99 – – 35 90 67 37 36 6 19 32 380 359 90 Holy See – – – – – – – – – – – – – – – – Honduras 107 100 98 117 103 73 97 89 83 83 19 81 85 73 129 300 Hungary 110 100 99 100 100 – – – 99 – 31x – – 15 17 4,400 Iceland 104 – 100 99 102 – – – – – 17x – – – 3 14,600 India 104 75 112 101 – 55x 74x 45 52x 79 9x – – 170 174 220 Indonesia 106 94 100 97 – 60 95 84 87 70 12 48 80 360 126 320 Iran (Islamic Republic of) 103 88 104 99 84 77 97 94x 96 95 46 – – 25x 25 2,000 Iraq 107 85 – – – 53 78 50 91 77 22 – – 35 50 420 Ireland 105 – 101 102 – 65x 100x – 100x 100 25x – – – 8 6,100 Israel 104 – 100 102 99 – – – – – – – – – 5 6,200 Italy 106 100 99 98 101 – 99x 68x – 100 40x – – – 4 19,700 Jamaica 107 111 – 108 103 72x 98 86 99 99 21 – – 80 89 520 Japan 108 – 100 100 100 54x – – – 100 – – – – 5 13,400 Jordan 105 93 99 105 102 61 99 95 100 99 28 75 82 19x 58 490 Kazakhstan 115 100 100 103 100 51 99 87 100 100 15 – – 13 12 3,000 Kenya 106 86x 100 93 – 58 96 58 62 61 9 36 53 360 510 42 Kiribati 110 – 104 110x – 22x 88x 71x 80x 66x 10x – – 33 90 300 Kuwait 103 99 102 108 101 – 100x – 100x 100 – – – 2 4 10,300 Kyrgyzstan 112 99 99 101 102 42 98 95 98 98 7 99 98 36 76 390 Lao People's Democratic 104 77x 95 91 104 50 54 37 42 38 4 41 39 360 197 150 Republic Latvia 114 100 99 97 100 – 92x – 100x 98 – – – 24 18 3,500 Lebanon 105 92x 91 101 106 54x 96x – 98x – – – – – 15 3,700 Lesotho 100 130 98 137 134 60 95 74 78 77 7x – 61 1,200 x 487 61 Liberia 103 44x 92 78 85x 20 96 78 61 56 4 35 71 1,100 725 28 Libya 108 88 – – – 42x 93x – 100x 100 – – – – 9 4,200 Liechtenstein – – 102 85 96x – – – – – – – – – – – Lithuania 116 100 100 96 100 63x 100x – 100x – – – – 7 10 6,300 Luxembourg 106 – 101 103 105 – – 97 100x 100x 29x – – – 10 6,500 Madagascar 105 91 100 98 106 40 82 51 44 38 2 – – 480 353 60 Malawi 103 71 102 91 94 59 96 45 87 89 5 82 75 570 634 29 Malaysia 106 95 – – – 49x 97 – 99 99 – – – 23 40 1,200 Maldives 103 100x 97 x – 106 35x 99x 85x 96 95x 32x – – 140x 68 600 Mali 99 47 90 76 94 8x 70x 35x 49x 45x 2x – – 460x 587 27 Malta 104 103 95 89 102 – 100x – – 100 – – – – 9 8,300 Marshall Islands – – 99 103x 91x 45x 81x 77x 90 85x 9x – – 110 – – Mauritania 105 62x 106 91 98 11 84 48 65 65 10 – 9 630 602 36 Mauritius 110 94 102 102 101 76x – – 100 98x – – – 22x 53 1,300 Mexico 106 97 99 107 102 52 97 91 96 96 46 – – 38 38 1,100 Micronesia (Federated 103 – 99 – – 55x 80x – 100x 87x 11x – – 160 100 310 States of) Monaco – – – – – – – – – – – – – – – – Mongolia 113 100 98 103 – 55 99 90 99 98 23 99 95 51 44 800 Montenegro 106 98 98 100 102 23 92 87 99 99 20 99 95 0x 7 8,300 Morocco 103 76 95 85 99 67 77 55 74 73 16 – – 110 121 320 Mozambique 105 54 92 92 96 12 91 51 54 55 4 – – 410 489 40 Myanmar 106 95 97 103 107x 46 83 73x 71 36 – – – 280 178 260 Namibia 108 105x 97 – 104 56 97 63 88 87 14 20 69 390 265 100 Nauru – – 92 102 – 36x 95x 40x 97x 99x 8x – – 0 – – Nepal 104 68 108 106 105 50 68 60 56 55 9 58 58 280x 258 150 THE STATE OF THE WORLD’S CHILDREN 2016 147
TABLE 8. WOMEN Enrolment ratios: Survival Life Adult females as a rate to the Post-natal health + † expec- literacy % of males last grade Contra- Antenatal care (%) Delivery care (%) check (%) Maternal mortality ratio tancy: rate: of primary: ceptive females females females as preva- At least Skilled Institu- For Lifetime risk of as a % as a % of Primary Second- a % of lence At least four attendant tional C- new- For maternal death Countries of males males GER ary GER males (%) one visit visits at birth delivery section borns mothers Reported Adjusted (1 in:) and areas 2009– 2010– 2015 2014* 2010–2014* 2010–2014* 2015* 2010–2015* 2010–2015* 2010–2015* 2010–2015* 2015 Netherlands 105 – 99 99 – 69x – – – 100x 14x – – – 7 8,700 New Zealand 104 – 100 106 – – – – – 97 23x – – – 11 4,500 Nicaragua 108 100x 99 113 – 80 95 88 88 71 30 – – 51 150 270 Niger 103 38 86 70 104 13 83 38 40 59 1 13 37 520 553 23 Nigeria 101 68x 92 89 107x 15 61 51 38 36 2 14 40 550 814 22 Niue – – 98 – – 23x 100x – 100 – – – – 0 – – Norway 105 – 100 97 – 88x – – – 97 16x – – – 5 11,500 Oman 105 91 109 101 99 30 99 94 99 99 19 98 95 12 17 1,900 Pakistan 103 60 85 79 90 35 73 37 52 48 14 43 60 280x 178 140 Palau – 100 96 106 – 22 90 81 100 100 – – – 0 – – Panama 108 99 97 106 – 63 93 88 91 91 28 93 92 81 94 420 Papua New Guinea 107 93 91 76 – 32x 79x 55x 53x 43 – – – 730x 215 120 Paraguay 106 98 97 107 104 79x 96x 91x 96 96 33x – – 96 132 270 Peru 107 94 100 100 103 75 97 95 90 90 29 92 93 93 68 570 Philippines 111 101x 100 110 111x 55 95 84 73 61 9 53 72 220 114 280 Poland 111 100 100 96 101 – – – 100x 100 21x – – 2 3 22,100 Portugal 107 96 96 98 – 67x 100x – 100x 99 31x – – – 10 8,200 Qatar 103 99 95 89 97 38 91 85 100 99 20 – – 13 13 3,500 Republic of Korea 108 – 99 99 100 80x – 97 – 100 32x – – – 11 7,200 Republic of Moldova 112 99 100 101 99 60 99 95 99 99 16 – – 30 23 3,200 Romania 110 99 98 98 100 70x 94x 76x 99 98x 19x – – 15 31 2,300 Russian Federation 117 100 101 99 – 68 – – 100 – – – – 11 25 2,300 Rwanda 109 87 102 107 125 53 99 44 91 91 15 5 18 210 290 85 Saint Kitts and Nevis – – 102 103 – 54x 100x – 100 – – – – 310 – – Saint Lucia 107 – – 99 100 56 97 90 99 100 19 100 90 34 48 1,100 Saint Vincent and the 106 – 97 97 127 48x 100x 100x 99 – – – – 45 45 1,100 Grenadines Samoa 109 100 100 112 98 27 93 73 83 82 5 – 63 29x 51 500 San Marino – – 99 103 103 – – – – – – – – – – – Sao Tome and Principe 106 75x 96 – – 41 98 84 93 91 6 91 87 – 156 140 Saudi Arabia 104 95 99 76 – 24x 97x – 98 – – – – – 12 3,100 Senegal 106 61 109 91 108 22 96 48 59 77 4 45 67 430 315 61 Serbia 108 97 100 102 101 58 98 94 98 98 29 – – 14 17 3,900 Seychelles 113 101 101 102 – – – – – – – – – 57x – – Sierra Leone 102 62 100 85 101 17 97 76 60 54 3 39 73 1,200 1,360 17 Singapore 108 96 – – 100x – – – – 100 – – – – 10 8,200 Slovakia 110 – 98 102 100 – 97x – 99 – 24x – – 0 6 12,100 Slovenia 108 100 100 100 100 – 100x – 100 100 – – – 0 9 7,000 Solomon Islands 104 – 97 94 93 35x 74x 65x 86x 85x 6x – – 150x 114 220 Somalia 106 – – – – 15x 26x 6x 33x 9x – – – 1,000 x 732 22 South Africa 107 97 95 126 – 60x 97x 87x 94x 95x 21x – – 580 138 300 South Sudan 104 55x 66 – – 4 62 17 19 12 1 – – 2,100 x 789 26 Spain 107 98 101 100 99 66x – – – – 26x – – – 5 14,700 Sri Lanka 109 97 98 105 100 68x 99x 93x 99x 98x 24x – – 31 30 1,600 State of Palestine 106 94 99 110 – 57 99 96 100 99 20 94 91 – 45 490 Sudan 105 81 89 91 98 12 79 51 23 28 9 28 27 220 311 72 Suriname 109 99 97 131 122 48 91 67 91 92 19 – – 130 155 270 Swaziland 97 98 92 98 107 66 99 76 88 88 12 90 87 590x 389 76 Sweden 104 – 106 113 100 – 100x – – – – – – – 4 12,900 Switzerland 105 – 100 97 – – – – – – 30x – – – 5 12,400 Syrian Arab Republic 120 88 97 100 101 54x 88x 64x 96x 78x 26x – – 65x 68 440 Tajikistan 111 100 100 90 101 28 79 53 87 77 4 54 80 29 32 790 Thailand 109 100 98 107 – 79 98 93 100 100 32 – – 12x 20 3,600 The former Yugoslav 106 98 98 98 – 40 99 94 100 98 25 – – 4 8 8,500 Republic of Macedonia Timor-Leste 105 83 99 108 109 22 84 55 29 22 2 – – 570 215 82 Togo 103 65 94 – 95 20 73 57 59 73 7 35 71 400 368 58 Tonga 108 100 100 103 – 34 99 70 98 98 17 – – 36 124 230 Trinidad and Tobago 110 99 97 – 106x 43x 96x 100 100 97x – – – 84 63 860 Tunisia 106 81 97 – 98 63 98 85 99 99 27 98 92 – 62 710 Turkey 109 91 99 97 98 73 97 89 97 97 48 72 88 29x 16 3,000 Turkmenistan 114 100 98 96 – 48x 99x 83x 100x 98x 3x – – 7 42 940 Tuvalu – – 101 125 – 31x 97x 67x 98x 93x 7x – – 0x – – THE STATE OF THE WORLD’S CHILDREN 2016 148
TABLE 8. WOMEN Enrolment ratios: Survival Life Adult females as a rate to the Post-natal health + † expec- literacy % of males last grade Contra- Antenatal care (%) Delivery care (%) check (%) Maternal mortality ratio tancy: rate: of primary: ceptive females females females as preva- At least Skilled Institu- For Lifetime risk of as a % as a % of Primary Second- a % of lence At least four attendant tional C- new- For maternal death Countries of males males GER ary GER males (%) one visit visits at birth delivery section borns mothers Reported Adjusted (1 in:) and areas 2009– 2010– 2015 2014* 2010–2014* 2010–2014* 2015* 2010–2015* 2010–2015* 2010–2015* 2010–2015* 2015 Uganda 107 78 102 87 97 30 93 48 57 57 5 11 33 440 343 47 Ukraine 115 100 102 98 101 65 99 87 99 99 12 99 96 14 24 2,600 United Arab Emirates 103 102x 101 – 103 – 100x – 100 100 – – – 0x 6 7,900 United Kingdom 105 – 100 104 – 84x – – – – 26x – – – 9 5,800 United Republic of 104 81 101 91 115 34 88 43 49 50 5 2 31 430 398 45 Tanzania United States 106 – 99 101 – 76 – 97 99 – 31x – – 28 14 3,800 Uruguay 110 101 97 114 103x 78x 97 77 98 100 30 – – 10 15 3,300 Uzbekistan 110 100 98 99 101 65x 99x – 100x 97x – – – 20 36 1,000 Vanuatu 106 97 98 100 94x 49 76 52 89 89 12 – – 86x 78 360 Venezuela (Bolivarian 112 101 98 108 91 – 94x 61 100 95 – – – 72 95 420 Republic of) Viet Nam 113 95 99 – 115 76 96 74 94 94 28 89 90 67 54 870 Yemen 104 62 84 69 93 34 60 25 45 30 5 11 20 150 385 60 Zambia 107 72x 101 – 94 49 96 56 64 67 4 16 63 400 224 79 Zimbabwe 105 91 99 97 – 67 94 70 80 80 6 85 77 – 443 52 SUMMARY Sub-Saharan Africa 105 76 93 86 102 27 78 49 50 51 4 21 43 – 546 36 Eastern and 106 82 94 93 105 40 80 45 49 49 5 18 36 – 417 51 Southern Africa West and Central Africa 103 69 91 79 100 18 76 52 54 54 3 22 49 – 679 27 Middle East and 105 83 95 94 101 57 85 63 80 75 29 – – – 110 280 North Africa South Asia 104 75 100 94 106 47‡ 69‡ 42 49‡ 69 15‡ 40‡ 48‡ – 182 200 East Asia and Pacific 105 95 99 101 102 63** 95 82** 93 88 28 57** 80** – 62 880 Latin America and 109 99 98 106 104 65 96 87 94 93 44 – – – 68 670 Caribbean CEE/CIS 113 99 100 98 101 65 96 85 98 96 28 – – – 25 2,000 Least developed countries 105 77 93 88 103 37 77 42 50 49 6 20 37 – 436 52 World 106 91 98 97 103 53‡** 85‡ 58** 75‡ 73 20‡ 34‡** 54‡** – 216 180 For a complete list of countries and areas in the regions, subregions and country categories, see page 112 or visit . It is not advisable to compare data from consecutive editions of The State of the World’s Children. DEFINITIONS OF THE INDICATORS MAIN DATA SOURCES Life expectancy – Number of years newborn children Caesarean section. NB: C-section rates between 5 per Life expectancy – United Nations Population mothers – DHS and MICS. would live if subject to the mortality risks prevailing for cent and 15 per cent expected with adequate levels of Division. Maternal mortality ratio (reported) – Nationally the cross section of population at the time of their birth. emergency obstetric care. Adult literacy – UNESCO Institute for Statistics (UIS). representative sources, including household surveys Adult literacy rate – Percentage of the population Post-natal health check for newborns – Percentage Primary and secondary school enrolment – UIS. and vital registration. aged 15 years and over who can both read and write of last live births in the last 2 years who received a Survival rate to last grade of primary – UIS. Maternal mortality ratio (adjusted) – United with understanding a short, simple statement on his/her health check within 2 days after delivery. NB: For MICS, Contraceptive prevalence – DHS, MICS and other Nations Maternal Mortality Estimation Inter-agency everyday life. health check refers to a health check while in facility or nationally representative sources; United Nations Group (WHO, UNICEF, UNFPA, The World Bank and the Primary gross enrolment ratio (GER) – Total at home following delivery or a post-natal visit. Population Division. United Nations Population Division). enrolment in primary school, regardless of age, Post-natal health check for mothers – Percentage Antenatal care, skilled attendant at birth, Lifetime risk of maternal death – United Nations expressed as a percentage of the official primary-school- of women aged 15–49 years who received a health institutional delivery and C-section: – DHS, MICS Maternal Mortality Estimation Inter-agency Group aged population. check within 2 days after delivery of their most recent and other nationally representative sources. (WHO, UNICEF, UNFPA, The World Bank and the Secondary gross enrolment ratio (GER) – Total live birth in the last 2 years. NB: For MICS, health check Post-natal health check for newborns and United Nations Population Division). enrolment in secondary school, regardless of age, refers to a health check while in facility or at home expressed as a percentage of the official following delivery or a post-natal visit. secondary-school-aged population. Maternal mortality ratio – Number of deaths of NOTES Survival rate to last grade of primary – Percentage women from pregnancy-related causes per 100,000 live of children entering the first grade of primary school births during the same time period. The ‘reported’ − Data not available. World Bank and the United Nations Population who eventually reach the last grade (administrative column shows country-reported figures that are not x Data refer to years or periods other than those Division) produces internationally comparable sets data). adjusted for under-reporting and misclassification. For specified in the column heading. Such data are not of maternal mortality data that account for the Contraceptive prevalence – Percentage of women the ‘adjusted’ column, see note below (†). Maternal included in the calculation of regional and global well-documented problems of under-reporting and (aged 15–49) in union currently using any contraceptive mortality ratio values have been rounded according to averages. Estimates from data years prior to 2000 misclassification of maternal deaths, including method. the following scheme: Reported: <100, no rounding; are not displayed. also estimates for countries with no data. Please Antenatal care – Percentage of women (aged 15–49) 100–999, rounded to nearest 10; and >1,000, rounded to * Data refer to the most recent year available during note that owing to an evolving methodology, attended at least once during pregnancy by skilled nearest 100. Adjusted: <1,000, rounded to nearest 1; the period specified in the column heading. these values are not comparable with previously health personnel (doctor, nurse or midwife) and the and ≥1,000, rounded to nearest 10. reported maternal mortality ratio ‘adjusted’ values. Life ** Excludes China. Comparable time series on maternal mortality percentage attended by any provider at least four times. time risk of maternal death – Lifetime risk of † The maternal mortality data in the column headed ratios for the years 1990, 1995, 2000, 2005 and Skilled attendant at birth – Percentage of births maternal death takes into account both the probability ‘reported’ refer to data reported by national au- 2015 are available at . midwife). a result of that pregnancy, accumulated across a woman’s reproductive years. Lifetime risk values have refer to the 2015 United Nations inter-agency + Data collection method for this indicator varies Institutional delivery – Percentage of women (aged been rounded according to the following scheme: maternal mortality estimates. Periodically, the across surveys and may affect comparability of the 15–49) who gave birth in a health facility. <1,000, rounded to nearest 1; and ≥1,000, rounded to United Nations Maternal Mortality Estimation coverage estimates. For detailed explanation see C-section – Percentage of births delivered by nearest 10. Inter-agency Group (WHO, UNICEF, UNFPA The General Note on the Data, page 108. THE STATE OF THE WORLD’S CHILDREN 2016 149
TABLE 9. CHILD PROTECTION Birth Female genital mutilation/cutting registration + Justification of (%) 2004–2015* + (%)++ wife-beating (%) Violent discipline (%)+ Child labour (%) Child marriage (%) Countries 2009–2015* 2008–2014* 2010–2015* prevalence attitudes 2010–2015* 2010–2015* married by married by support for and areas a b c total male female 15 18 total women girls the practice male female total male female Afghanistan 29y 34y 24y – 33 37 – – – – 90 74 75 74 Albania 5y 6y 4y 0 10 99x – – – 36x 30x 77x 81x 73x Algeria 5 6 5 0 3 100 – – – – 59y 86 88 85 Andorra – – – – – 100v – – – – – – – – Angola 24x 22x 25x – – 36x – – – – – – – – Antigua and Barbuda – – – – – – – – – – – – – – Argentina 4 5 4 – – 100y – – – – 2 72 74 71 Armenia 4 5 3 0 7 100 – – – 20 9 70 72 67 Australia – – – – – 100v – – – – – – – – Austria – – – – – 100v – – – – – – – – Azerbaijan 7x,y 8x,y 5x,y 2 11 94x – – – – 28 77x 80x 74x Bahamas – – – – – – – – – – – – – – Bahrain 5x 6x 3x – – – – – – – – – – – Bangladesh 4y 5y 4y 18 52 37 – – – – 33y 82y 83y 82y Barbados 2 3 1 1 11 99 – – – – 3 75 78 72 Belarus 1 1 2 0 3 100y – – – 4 4 65y 67y 62y Belgium – – – – – 100v – – – – – – – – Belize 3y 5y 1y 3 26 95 – – – – 9 71 71 70 Benin 15 15 16 11 32 85 9 0 3 17 36 91y – – Bhutan 3 3 3 6 26 100 – – – – 68 – – – Bolivia (Plurinational State of) 26x,y 28x,y 24x,y 3 22 76x,y – – – – 16x – – – Bosnia and Herzegovina 5x 7x 4x 0 4 100x – – – 6 5 55 60 50 Botswana 9x,y 11x,y 7x,y – – 72x – – – – – – – – Brazil 8y 10y 6y 11x 36x 96 – – – – – – – – Brunei Darussalam – – – – – – – – – – – – – – Bulgaria – – – – – 100v – – – – – – – – Burkina Faso 39 42 36 10 52 77 76 13 9 34 44 83x 84x 82x Burundi 26 26 27 3 20 75 – – – 44 73 – – – Cabo Verde 6y – – 3x 18x 91 – – – 16x,y 17x,y – – – Cambodia 19y 20y 19y 2 19 73 – – – 27y 50y – – – Cameroon 47y – – 13 38 66 1 1y 7 39 36 85y – – Canada – – – – – 100v – – – – – – – – Central African Republic 29 27 30 29 68 61 24 1 11 75 80 92 92 92 Chad 26 25 28 29 68 12 44 18y 38 – 62 84 85 84 Chile 7y – – – – 99y – – – – – – – – China – – – – – – – – – – – – – – Colombia 10y 13y 7y 6 23 97 – – – – – – – – Comoros 22 20 24 10 32 87 – – – 17 39 – – – Congo 23y – – 6 33 96 – – – 40 54 83y – – Cook Islands – – – – – – – – – – – – – – Costa Rica 4 4 5 7 21 100y – – – – 4 46 52 39 Côte d'Ivoire 26 25 28 10 33 65 38 10 14 42 48 91x 91x 91x Croatia – – – – – – – – – – – – – – Cuba – – – 5 26 100 – – – 7y 4y 36y 37y 35y Cyprus – – – – – 100v – – – – – – – – Czech Republic – – – – – 100v – – – – – – – – Democratic People's Republic – – – – – 100x – – – – – – – – of Korea Democratic Republic 38y 36y 41y 10 37 25 – – – 61 75 82y 82y 81y of the Congo Denmark – – – – – 100v – – – – – – – – Djibouti 8x 8x 8x 2x 5x 92x 93 49y 37 – – 72x 73x 71x Dominica – – – – – – – – – – – – – – Dominican Republic 13y – – 10 37 88 – – – – 2 63y – – Ecuador 3y 4y 2y 4x 22x 92 – – – – – – – – Egypt 7y 8y 6y 2 17 99 87 14y 54 – 36y 93y 93y 93y El Salvador 19y – – 5 25 99 – – – – 8 52y – – Equatorial Guinea 28x 28x 28x 9 30 54 – – – 52 53 – – – Eritrea – – – 13 41 – 83 33 12 45 51 – – – Estonia – – – – – 100v – – – – – – – – Ethiopia 27 31 24 16 41 7x 74 24 31 45 68 – – – Fiji – – – – – – – – – – – 72x,y – – Finland – – – – – 100v – – – – – – – – France – – – – – 100v – – – – – – – – Gabon 13 15 12 6 22 90 – – – 40 50 – – – THE STATE OF THE WORLD’S CHILDREN 2016 150
TABLE 9. CHILD PROTECTION Birth Female genital mutilation/cutting registration (%)+ Justification of 2004–2015* + ++ + Child labour (%) Child marriage (%) (%) wife-beating (%) Violent discipline (%) Countries 2009–2015* 2008–2014* 2010–2015* prevalence attitudes 2010–2015* 2010–2015* married by married by support for and areas a b c total male female 15 18 total women girls the practice male female total male female Gambia 19 21 18 9 30 72 75 56 65 33 58 90 90 91 Georgia 18x 20x 17x 1 14 100 – – – – 7x 67x 70x 63x Germany – – – – – 100v – – – – – – – – Ghana 22y 23y 21y 5 21 71 4 1 2 13 28 94 94 94 Greece – – – – – 100v – – – – – – – – Grenada – – – – – – – – – – – – – – Guatemala 26y 35y 16y 7 30 97x – – – – – – – – Guinea 28 29 27 21 52 58 97 46 76 66 92 – – – Guinea-Bissau 38 40 36 7 22 24 45 30 13 29 42 82y – – Guyana 18y – – 6 23 89 – – – 10 10 70y – – Haiti 24 25 24 3 18 80 – – – 15 17 85 85 84 Holy See – – – – – – – – – – – – – – Honduras 15y 22y 8y 8 34 94 – – – 10 12 – – – Hungary – – – – – 100v – – – – – – – – Iceland – – – – – 100v – – – – – – – – India 12x 12x 12x 18x 47x 72 – – – 42x 47x – – – Indonesia 7 8 6 – 14 69y – 49y – 18y 35 – – – Iran (Islamic Republic of) 11y 13y 10y 3 17 99y – – – – – – – – Iraq 5 5 4 5 24 99 8 3y 5 – 51 79 81 77 Ireland – – – – – 100v – – – – – – – – Israel – – – – – 100v – – – – – – – – Italy – – – – – 100v – – – – – – – – Jamaica 3 4 3 1 8 100 – – – – 5 85 87 82 Japan – – – – – 100v – – – – – – – – Jordan 2x,y 3x,y 0x,y 0 8 99 – – – – 70y 90 91 89 Kazakhstan 2x 2x 2x 0 6 100 – – – 17 12 49 54 45 Kenya 26x 27x 25x 4 23 67 21 3 6 36 42 – – – Kiribati – – – 3 20 94x – – – 60x 76x 81x,y – – Kuwait – – – – – – – – – – – – – – Kyrgyzstan 26y 30y 22y 1 12 98 – – – – 33 57y 60y 54y Lao People's Democratic Republic 10y 9y 11y 9 35 75 – – – 49 58 76 77 74 Latvia – – – – – 100v – – – – – – – – Lebanon 2 3 1 1 6 100x – – – – 10x,y 82x 82x 82x Lesotho 23x 25x 21x 2 19 45x – – – 48x 37x – – – Liberia 21x 21x 21x 9 36 25y 50 – 39 24 43 90x 90x 90x Libya – – – – – – – – – – – – – – Liechtenstein – – – – – 100v – – – – – – – – Lithuania – – – – – 100v – – – – – – – – Luxembourg – – – – – 100v – – – – – – – – Madagascar 23y 23y 23y 12 41 83 – – – 46y 45 – – – Malawi 39y 42y 37y 9 46 6y – – – 8 13 72y 73y 72y Malaysia – – – – – – – – – – – – – – Maldives – – – 0 4 93x – – – 14x,y 31x,y – – – Mali 21 22 21 15 55 81 89 74y 73 – 87 – – – Malta – – – – – 100v – – – – – – – – Marshall Islands – – – 6x 26x 96x – – – 58x 56x – – – Mauritania 15 14 15 14 34 59 69 54 41 – 38 87 87 87 Mauritius – – – – – – – – – – – – – – Mexico 4 – – 5 23 93 – – – – – – – – Micronesia (Federated States of) – – – – – – – – – – – – – – Monaco – – – – – 100v – – – – – – – – Mongolia 15y – – 0 5 99 – – – 9y 10 47y – – Montenegro 13y 15y 10y 1 5 99 – – – 5 3 69y 73y 66y Morocco 8x 9x 8x 3x 16x 94y – – – – 64x 91x 92x 90x Mozambique 22x 21x 24x 14 48 48 – – – 20 23 – – – Myanmar – – – – – 72 – – – – – – – – Namibia – – – 2 7 87y – – – 22 28 – – – Nauru – – – 2x 27x 83x – – – – – – – – Nepal 37y 37y 38y 10 37 58 – – – – 43 82y 83y 81y Netherlands – – – – – 100v – – – – – – – – New Zealand – – – – – 100v – – – – – – – – Nicaragua 15x 18x 11x 10x 41x 85 – – – – 14x,y – – – Niger 31 31 30 28 76 64 2 2y 6 27 60 82 82 81 Nigeria 25 24 25 17 43 30y 25 17 23 25 35 91 91 90 THE STATE OF THE WORLD’S CHILDREN 2016 151
TABLE 9. CHILD PROTECTION Birth Female genital mutilation/cutting registration (%)+ Justification of 2004–2015* + ++ + Child labour (%) Child marriage (%) (%) wife-beating (%) Violent discipline (%) Countries 2009–2015* 2008–2014* 2010–2015* prevalence attitudes 2010–2015* 2010–2015* married by married by support for and areas a b c total male female 15 18 total women girls the practice male female total male female Niue – – – – – – – – – – – – – – Norway – – – – – 100v – – – – – – – – Oman – – – – – – – – – – 8 – – – Pakistan – – – 3 21 34 – – – 32y 42y – – – Palau – – – – – – – – – – – – – – Panama 6y 8y 3y 7 26 96 – – – – 6 45y 47y 43y Papua New Guinea – – – 2x 21x – – – – – – – – – Paraguay 28y 32y 24y – 18x 85y – – – – – – – – Peru 34x,y 31x,y 36x,y 3 19 97y – – – – – – – – Philippines 11y 14y 8y 2 15 90 – – – – 13 – – – Poland – – – – – 100v – – – – – – – – Portugal 3x,y 4x,y 3x,y – – 100v – – – – – – – – Qatar – – – 0 4 – – – – 16 7 50y 53y 46y Republic of Korea – – – – – – – – – – – – – – Republic of Moldova 16 20 12 0 12 100 – – – 13 11 76 77 74 Romania 1x 1x 1x – – – – – – – – – – – Russian Federation – – – – – 100v – – – – – – – – Rwanda 29 27 30 1 8 63 – – – 25 56 – – – Saint Kitts and Nevis – – – – – – – – – – – – – – Saint Lucia 4 5 3 1 8 92 – – – – 7 68 71 64 Saint Vincent and the Grenadines – – – – – – – – – – – – – – Samoa – – – 1 11 59 – – – 30 37 – – – San Marino – – – – – 100v – – – – – – – – Sao Tome and Principe 26y – – 5 34 95 – – – 14 19 80y – – Saudi Arabia – – – – – – – – – – – – – – Senegal 15 19 10 9 32 73 25 13 16 27 57 – – – Serbia 10y 12y 7y 0 3 99 – – – – 4 43y 44y 42y Seychelles – – – – – – – – – – – – – – Sierra Leone 37 38 37 13 39 77 90 31y 69 34 63 82 81 82 Singapore – – – – – – – – – – – – – – Slovakia – – – – – 100v – – – – – – – – Slovenia – – – – – 100v – – – – – – – – Solomon Islands – – – 3x 22x – – – – 65x 69x 72x,y – – Somalia 49x 45x 54x 8x 45x 3x 98 46y 65 – 76x,y – – – South Africa – – – 1x 6x 85y – – – – – – – – South Sudan – – – 9 52 35 – – – – 79 – – – Spain – – – – – 100v – – – – – – – – Sri Lanka 3y 3y 2y 2x 12x 97x – – – – 53x,y – – – State of Palestine 6 7 4 1 15 99 – – – – – 92y 93y 92y Sudan 25y – – 7 33 67 87 32 41 – 34 64y – – Suriname 4 4 4 5 19 99 – – – – 13 86 87 85 Swaziland 7 8 7 1 7 54 – – – 17 20 88y – – Sweden – – – – – 100v – – – – – – – – Switzerland – – – – – 100v – – – – – – – – Syrian Arab Republic 4x 5x 3x 3x 13x 96x – – – – – 89x 90x 88x Tajikistan 10x 9x 11x 0 12 88 – – – – 60 78x 80x 75x Thailand 8x 8x 8x 4 22 99y – – – – 13 – – – The former Yugoslav Republic 13 12 13 1 7 100 – – – – 15 69 71 67 of Macedonia Timor-Leste 4x 4x 4x 3 19 55 – – – 81 86 – – – Togo 28y 29y 27y 6 22 78 5 0 1 18 29 81y 81y 80y Tonga – – – 0 6 93 – – – 21 29 – – – Trinidad and Tobago 1x 1x 1x 2x 8x 97x – – – – 8x 77x 78x 77x Tunisia 2 3 2 0 2 99 – – – – 30 93 94 92 Turkey 6y 8y 4y 1 15 99y – – – – 13 – – – Turkmenistan – – – 1x 7x 96x – – – – 38x,y – – – Tuvalu – – – 0x 10x 50x – – – 73x 70x – – – Uganda 16y 17y 16y 10 40 30 1 1 9 44 58 – – – Ukraine 2 3 2 0 9 100 – – – 9 3 61 68 55 United Arab Emirates – – – – – 100y – – – – – – – – United Kingdom – – – – – 100v – – – – – – – – United Republic of Tanzania 29y 29y 28y 7 37 15y 15 3y 6 38 54 – – – United States – – – – – 100v – – – – – – – – THE STATE OF THE WORLD’S CHILDREN 2016 152
TABLE 9. CHILD PROTECTION Birth Female genital mutilation/cutting registration (%)+ Justification of 2004–2015* + ++ + Child labour (%) Child marriage (%) (%) wife-beating (%) Violent discipline (%) Countries 2009–2015* 2008–2014* 2010–2015* prevalence attitudes 2010–2015* 2010–2015* married by married by support for and areas a b c total male female 15 18 total women girls the practice male female total male female Uruguay 8x,y 8x,y 8x,y 1 25 100 – – – – 2 55 58 51 Uzbekistan – – – 0x 7x 100x – – – 61x 70x – – – Vanuatu 15y 15y 16y 3 21 43y – – – 60 60 84 83 84 Venezuela 8x 9x 6x – – 81y – – – – – – – – (Bolivarian Republic of) Viet Nam 16y 17y 16y 1 11 96 – – – – 28 68y 72y 65y Yemen 23x 21x 24x 9 32 31 19 16y 19 – 49 79y 81y 77y Zambia 41x,y 42x,y 40x,y 6 31 11 – – – 32 47 – – – Zimbabwe – – – 4 34 32 – – – 24 37 63y 63y 62y SUMMARY Sub-Saharan Africa 28 27 27 12 39 46 39 16 22 35 50 – – – Eastern and Southern Africa 26 28 24 10 36 45 43 13 19 37 52 – – – West and Central Africa 28 27 28 14 42 45 31 17 23 34 49 87 88 87 Middle East and North Africa 10 8 6 3 18 89 – 16 – – 43 83 88 86 South Asia – – – – – 62 – – – – – – – – East Asia and Pacific 10** 11** 9** – 15** 80** – – – – 28** – – – Latin America and Caribbean 9 12 7 5 23 94 – – – – – – – – CEE/CIS – – – 1 11 99 – – – – – – – – Least developed countries 24 25 23 13 41 45 – – – 40 52 – – – World – – – – – 71** – – – – – – – – For a complete list of countries and areas in the regions, subregions and country categories, see page 112 or visit . It is not advisable to compare data from consecutive editions of The State of the World’s Children. DEFINITIONS OF THE INDICATORS MAIN DATA SOURCES Child labour – Percentage of children 5–14 years old involved in child labour at the Child labour – Demographic and Health Surveys (DHS), Multiple Indicator Cluster Surveys (MICS) moment of the survey. A child is considered to be involved in child labour under the and other national surveys. following conditions: (a) children 5–11 years old who, during the reference week, did at Child marriage – DHS, MICS and other national surveys. least 1 hour of economic activity or at least 28 hours of household chores, or (b) Birth registration – DHS, MICS, other national surveys, censuses and vital registration systems. children 12–14 years old who, during the reference week, did at least 14 hours of Female genital mutilation/cutting – DHS, MICS and other national surveys. economic activity or at least 28 hours of household chores. Justification of wife-beating – DHS, MICS and other national surveys. Child marriage – Percentage of women 20–24 years old who were first married or in Violent discipline – DHS, MICS and other national surveys. union before they were 15 years old and percentage of women 20–24 years old who were first married or in union before they were 18 years old. Italicized data are from older sources than the data presented for a country for other indicators on Birth registration – Percentage of children less than 5 years old who were registered the same topic. at the moment of the survey. The numerator of this indicator includes children reported to have a birth certificate, regardless of whether or not it was seen by the interviewer, NOTES and those without a birth certificate whose mother or caregiver says the birth has been − Data not available. registered. Female genital mutilation/cutting (FGM/C) – (a) Women: percentage of women v Estimates of 100% were assumed given that civil registration systems in these countries are 15–49 years old who have undergone FGM/C; (b) girls: percentage of girls 0–14 years complete and all vital events (including births) are registered. Source: United Nations, Department old who have undergone FGM/C (as reported by their mothers); (c) support for the of Economic and Social Affairs, Statistics Division, Population and Vital Statistics Report, Series A practice: percentage of women 15–49 years old who have heard about FGM/C and Vol. LXV, New York, 2013. think the practice should continue. x Data refer to years or periods other than those specified in the column heading. Such data are not Justification of wife-beating – Percentage of women and men 15–49 years old who included in the calculation of regional and global averages. consider a husband to be justified in hitting or beating his wife for at least one of the y Data differ from the standard definition or refer to only part of a country. If they fall within the specified reasons, i.e., if his wife burns the food, argues with him, goes out without noted reference period, such data are included in the calculation of regional and global averages. telling him, neglects the children or refuses sexual relations. + A more detailed explanation of the methodology and the changes in calculating these estimates Violent discipline – Percentage of children 2–14 years old who experience any can be found in the General Note on the Data, page 108. violent discipline (psychological aggression and/or physical punishment). ++ Changes in the definition of birth registration were made from the second and third rounds of MICS (MICS2 and MICS3) to the fourth round (MICS4). In order to allow for comparability with later rounds, data from MICS2 and MICS3 on birth registration were recalculated according to the MICS4 indicator definition. Therefore, the recalculated data presented here may differ from estimates included in MICS2 and MICS3 national reports. * Data refer to the most recent year available during the period specified in the column heading. ** Excludes China. THE STATE OF THE WORLD’S CHILDREN 2016 153
TABLE 10. THE RATE OF PROGRESS Average annual Re- rate of reduction ɵ (%) Annual rate of reduction (%) duction GDP per capita average Countries Under-5 Under-5 mortality rate Under-5 mortality rate Reduction since annual growth rate (%) Total fertility rate Total fertility rate mortality 1970– 1990– 2000– 1990– since 1990 2000 1970– 1990– ɵ ɵ and areas rank 1970 1990 2000 2015 1990 2000 2015 2015 (%) (%) 1970–1990 1990–2014 1970 1990 2015 1990 2015 Afghanistan 16 308 181 137 91 2.7 2.8 2.7 2.7 50 34 – 5.6 x 7.5 7.5 4.7 0.0 1.9 Albania 112 – 41 26 14 – 4.4 4.2 4.3 66 47 -0.6 x 5.7 4.9 3.0 1.8 2.5 2.0 Algeria 79 242 47 40 26 8.2 1.6 3.0 2.4 46 36 1.8 1.7 7.6 4.7 2.8 2.4 2.1 Andorra 182 – 9 5 3 – 6.1 3.3 4.4 67 39 -1.3 1.2 x – – – – – Angola 1 – 226 217 157 – 0.4 2.2 1.5 31 28 – -0.4 x 7.4 7.2 6.0 0.1 0.7 Antigua and Barbuda 142 – 26 16 8 – 5.0 4.3 4.6 68 48 7.9 x 1.2 3.7 2.1 2.1 2.9 0.0 Argentina 120 72 28 20 13 4.8 3.1 3.2 3.2 55 38 -0.8 2.3 3.1 3.0 2.3 0.1 1.0 Armenia 112 – 50 30 14 – 5.0 5.1 5.0 72 53 – 6.2 3.2 2.5 1.5 1.2 2.1 Australia 166 21 9 6 4 4.2 3.9 3.3 3.5 59 39 1.6 2.0 2.7 1.9 1.9 1.9 -0.1 Austria 166 29 10 6 4 5.6 5.5 3.0 4.0 63 36 2.5 1.6 2.3 1.5 1.5 2.3 -0.1 Azerbaijan 68 – 95 74 32 – 2.5 5.7 4.4 67 57 – 6.4 4.6 3.0 2.3 2.2 1.1 Bahamas 125 31 24 16 12 1.3 4.0 1.7 2.7 49 23 1.9 0.1 3.5 2.6 1.9 1.5 1.4 Bahrain 153 77 23 13 6 6.0 6.0 4.7 5.2 73 51 -1.0 x 0.1 6.5 3.7 2.0 2.8 2.4 Bangladesh 61 224 144 88 38 2.2 4.9 5.7 5.4 74 57 0.7 3.6 6.9 4.5 2.1 2.2 3.0 Barbados 120 48 18 16 13 4.9 0.9 1.5 1.3 27 20 1.4 x 1.2 3.1 1.7 1.8 2.9 -0.1 Belarus 159 – 17 14 5 – 1.5 7.6 5.1 72 68 – 5.0 2.3 1.9 1.6 1.1 0.5 Belgium 166 24 10 6 4 4.4 5.4 2.3 3.6 59 29 2.2 1.4 2.2 1.6 1.8 1.7 -0.6 Belize 99 97 40 25 17 4.5 4.6 2.8 3.5 58 34 3.1 1.7 6.3 4.5 2.5 1.7 2.3 Benin 8 266 180 145 100 2.0 2.2 2.5 2.4 45 31 0.4 1.1 6.7 6.7 4.7 0.0 1.5 Bhutan 67 272 134 80 33 3.5 5.2 5.9 5.6 75 59 7.0 x 5.3 6.7 5.6 2.0 0.8 4.2 Bolivia (Plurinational State of) 61 231 124 80 38 3.1 4.4 4.9 4.7 69 52 -1.0 2.0 6.3 4.9 2.9 1.2 2.1 Bosnia and Herzegovina 159 – 18 9 5 – 6.9 3.6 4.9 70 41 – 7.4 x 2.9 1.8 1.3 2.5 1.4 Botswana 55 121 54 83 44 4.0 -4.2 4.3 0.9 20 47 8.1 2.7 6.6 4.7 2.8 1.7 2.1 Brazil 104 134 61 32 16 3.9 6.4 4.5 5.2 73 49 2.2 1.8 5.0 2.8 1.8 2.9 1.8 Brunei Darussalam 133 – 12 9 10 – 2.6 -0.5 0.7 16 -9 -2.2 x -0.4 5.8 3.5 1.9 2.4 2.6 Bulgaria 133 39 22 21 10 2.8 0.5 4.7 3.0 53 50 3.4 x 3.5 2.1 1.8 1.6 0.9 0.5 Burkina Faso 18 319 202 186 89 2.3 0.9 4.9 3.3 56 52 1.4 2.9 6.6 7.0 5.4 -0.3 1.0 Burundi 21 248 172 152 82 1.8 1.2 4.1 3.0 52 46 1.2 -1.5 7.3 7.5 5.9 -0.2 1.0 Cabo Verde 80 165 63 36 25 4.8 5.7 2.5 3.8 61 31 3.5 x 6.3 6.9 5.3 2.3 1.3 3.4 Cambodia 71 – 117 108 29 – 0.8 8.9 5.6 76 73 – 5.9 x 6.5 5.6 2.6 0.7 3.1 Cameroon 19 213 138 150 88 2.2 -0.9 3.6 1.8 36 42 3.4 0.6 6.2 6.4 4.6 -0.2 1.3 Canada 159 22 8 6 5 4.9 2.9 1.6 2.1 41 21 2.0 1.6 2.2 1.7 1.6 1.5 0.2 Central African Republic 4 223 177 175 130 1.2 0.1 2.0 1.2 26 26 -1.3 -0.6 6.0 5.8 4.2 0.1 1.3 Chad 2 – 215 190 139 – 1.2 2.1 1.7 35 27 -0.9 3.3 6.5 7.3 6.1 -0.6 0.8 Chile 142 80 19 11 8 7.1 5.6 2.0 3.4 58 26 1.5 3.3 4.0 2.5 1.7 2.4 1.4 China 130 113 54 37 11 3.7 3.8 8.3 6.5 80 71 6.6 9.2 5.7 2.4 1.6 4.3 1.7 Colombia 104 98 35 25 16 5.1 3.4 3.0 3.2 55 37 1.9 2.1 5.5 3.0 1.9 3.1 1.9 Comoros 25 227 125 101 74 3.0 2.1 2.1 2.1 41 27 -0.2 x -0.2 7.1 6.4 4.4 0.5 1.5 Congo 52 143 94 122 45 2.1 -2.6 6.6 2.9 52 63 3.3 0.6 6.3 5.3 4.8 0.8 0.4 Cook Islands 142 52 24 17 8 3.8 3.7 4.9 4.4 67 52 – – – – – – – Costa Rica 133 76 17 13 10 7.5 2.6 2.0 2.2 43 25 0.8 2.9 4.6 3.2 1.8 1.9 2.3 Côte d'Ivoire 13 241 153 146 93 2.3 0.5 3.0 2.0 39 36 -1.7 -0.5 7.9 6.6 4.9 0.9 1.2 Croatia 166 – 13 8 4 – 4.4 4.4 4.4 67 48 – 2.6 x 2.0 1.6 1.5 1.1 0.3 Cuba 153 44 13 8 6 5.9 4.6 2.8 3.5 59 35 3.9 3.3 x 4.0 1.8 1.6 4.2 0.3 Cyprus 182 – 11 7 3 – 5.2 6.0 5.7 76 59 5.9 x 1.5 2.6 2.4 1.4 0.4 2.1 Czech Republic 182 – 15 7 3 – 7.9 4.4 5.8 77 48 – 2.5 2.1 1.8 1.5 0.7 0.8 Democratic People's Republic 80 – 43 60 25 – -3.2 5.9 2.2 43 59 – – 4.3 2.3 2.0 3.2 0.6 of Korea Democratic Republic 9 248 187 161 98 1.4 1.5 3.3 2.6 47 39 -2.1 -1.9 6.2 7.1 5.9 -0.6 0.7 of the Congo Denmark 166 17 9 6 4 3.1 4.6 3.1 3.7 61 38 2.0 1.2 2.1 1.7 1.7 1.2 -0.2 Djibouti 32 – 119 101 65 – 1.7 2.9 2.4 45 35 – 0.4 6.8 6.1 3.1 0.6 2.7 Dominica 89 64 17 15 21 6.6 1.1 -2.2 -0.9 -24 -39 5.2 x 2.0 – – – – – Dominican Republic 70 122 60 41 31 3.5 3.8 1.9 2.7 49 25 2.1 3.7 6.2 3.5 2.5 2.9 1.4 Ecuador 84 138 57 34 22 4.4 5.0 3.1 3.9 62 37 1.7 1.5 6.1 3.8 2.5 2.4 1.6 Egypt 82 243 86 47 24 5.2 6.1 4.4 5.1 72 48 4.1 2.6 5.9 4.7 3.3 1.2 1.4 El Salvador 99 155 59 32 17 4.8 6.1 4.4 5.1 72 48 -1.9 2.2 6.2 3.9 1.9 2.3 2.9 Equatorial Guinea 11 – 190 152 94 – 2.2 3.2 2.8 50 38 -2.4 x 19.0 5.7 5.9 4.7 -0.2 0.9 Eritrea 49 – 151 89 47 – 5.3 4.3 4.7 69 48 – -0.2 x 6.7 6.4 4.2 0.2 1.7 Estonia 182 – 20 11 3 – 6.1 8.9 7.8 86 74 – 4.7 x 2.1 1.9 1.6 0.4 0.7 Ethiopia 37 241 205 145 59 0.8 3.4 6.0 5.0 71 59 – 3.8 7.0 7.2 4.3 -0.2 2.1 Fiji 84 55 30 25 22 3.1 2.0 0.6 1.1 25 9 0.6 1.1 4.5 3.4 2.5 1.5 1.2 Finland 193 16 7 4 2 4.4 4.4 4.2 4.3 66 47 2.9 2.1 1.9 1.7 1.8 0.3 0.0 France 166 18 9 5 4 3.5 5.1 1.5 3.0 52 20 2.2 1.2 2.5 1.8 2.0 1.8 -0.5 Gabon 42 – 93 85 51 – 0.9 3.5 2.4 45 40 0.6 -0.7 5.1 5.4 3.8 -0.3 1.4 THE STATE OF THE WORLD’S CHILDREN 2016 154
TABLE 10. THE RATE OF PROGRESS Average annual Re- rate of reduction ɵ (%) Annual rate of reduction (%) duction GDP per capita average Countries Under-5 Under-5 mortality rate Under-5 mortality rate Reduction since annual growth rate (%) Total fertility rate Total fertility rate mortality 1970– 1990– 2000– 1990– since 1990 2000 1970– 1990– ɵ ɵ and areas rank 1970 1990 2000 2015 1990 2000 2015 2015 (%) (%) 1970–1990 1990–2014 1970 1990 2015 1990 2015 Gambia 29 303 170 119 69 2.9 3.6 3.6 3.6 60 42 0.7 0.3 x 6.1 6.1 5.7 0.0 0.3 Georgia 125 – 48 36 12 – 2.9 7.3 5.6 75 67 3.1 3.3 2.6 2.2 1.8 0.9 0.7 Germany 166 26 9 5 4 5.5 4.5 2.5 3.3 56 31 2.3 1.3 2.0 1.4 1.4 2.0 -0.2 Ghana 35 202 127 101 62 2.3 2.4 3.3 2.9 52 39 -2.0 2.9 7.0 5.6 4.1 1.1 1.2 Greece 159 38 13 8 5 5.5 4.8 3.5 4.0 63 41 1.3 1.4 2.4 1.4 1.3 2.5 0.3 Grenada 125 – 23 16 12 – 3.8 2.0 2.7 49 26 4.2 x 2.4 4.6 3.8 2.1 0.9 2.4 Guatemala 71 174 81 51 29 3.8 4.7 3.7 4.1 64 42 0.1 1.3 6.2 5.3 3.2 0.8 2.1 Guinea 11 327 238 170 94 1.6 3.4 4.0 3.7 61 45 – 0.6 6.2 6.6 4.9 -0.3 1.2 Guinea-Bissau 13 – 229 178 93 – 2.6 4.3 3.6 60 48 0.8 -0.9 6.0 6.6 4.8 -0.5 1.3 Guyana 59 74 60 47 39 1.0 2.6 1.1 1.7 35 16 -1.5 2.9 x 5.2 3.6 2.5 1.8 1.4 Haiti 29 245 146 105 69 2.6 3.3 2.8 3.0 53 34 – -0.6 x 5.8 5.4 3.0 0.3 2.4 Holy See – – – – – – – – – – – – – – – – – – Honduras 94 148 58 37 20 4.7 4.4 4.0 4.2 65 45 0.8 1.7 7.3 5.1 2.3 1.7 3.2 Hungary 153 43 19 11 6 4.0 5.3 4.3 4.7 69 47 – 2.5 x 2.0 1.8 1.4 0.5 1.2 Iceland 193 16 6 4 2 4.5 4.7 4.6 4.7 69 50 3.2 2.1 3.0 2.2 1.9 1.7 0.5 India 48 213 126 91 48 2.6 3.2 4.3 3.9 62 48 2.0 5.0 5.6 4.0 2.4 1.6 2.1 Indonesia 77 166 85 52 27 3.4 4.8 4.4 4.5 68 48 4.5 2.9 5.5 3.1 2.4 2.8 1.0 Iran (Islamic Republic of) 104 – 58 35 16 – 5.1 5.4 5.2 73 55 -4.3 2.4 6.4 4.8 1.7 1.5 4.2 Iraq 68 115 54 45 32 3.8 1.9 2.2 2.1 41 28 4.2 3.7 7.4 5.9 4.5 1.1 1.1 Ireland 166 22 9 7 4 4.4 2.6 4.5 3.8 61 49 2.8 3.8 3.8 2.0 2.0 3.2 0.0 Israel 166 – 12 7 4 – 5.2 3.6 4.3 66 42 1.9 2.4 3.8 3.0 3.0 1.2 0.0 Italy 166 34 10 6 4 6.2 5.7 3.0 4.1 64 36 2.8 0.6 2.4 1.3 1.5 3.2 -0.5 Jamaica 104 58 31 22 16 3.2 3.3 2.2 2.7 49 29 -1.3 0.4 5.5 2.9 2.0 3.1 1.5 Japan 182 18 6 5 3 5.1 3.4 3.4 3.4 57 40 3.4 0.7 2.1 1.6 1.4 1.5 0.4 Jordan 96 90 37 28 18 4.5 2.8 2.9 2.9 51 35 2.5 x 2.6 7.9 5.5 3.4 1.8 2.0 Kazakhstan 112 – 53 44 14 – 1.9 7.5 5.3 73 68 – 4.3 3.5 2.8 2.6 1.1 0.3 Kenya 46 148 102 108 49 1.9 -0.5 5.2 2.9 52 54 1.2 0.8 8.1 6.0 4.3 1.5 1.4 Kiribati 39 140 96 71 56 1.9 3.1 1.6 2.2 42 21 -5.0 1.0 5.5 4.7 3.7 0.8 1.0 Kuwait 139 71 18 13 9 6.9 3.4 2.6 2.9 52 32 -6.7 x 0.0 x 7.3 2.6 2.1 5.1 0.9 Kyrgyzstan 89 – 65 49 21 – 2.9 5.5 4.5 67 56 – 1.1 4.9 3.9 3.1 1.2 0.9 Lao People's Democratic 31 – 162 118 67 – 3.2 3.8 3.6 59 43 – 4.9 6.0 6.2 2.9 -0.1 3.0 Republic Latvia 142 – 20 17 8 – 1.7 5.2 3.8 61 54 – 5.7 x 1.9 1.9 1.5 0.0 1.0 Lebanon 142 63 33 20 8 3.3 4.9 5.9 5.5 74 59 – 2.1 4.9 3.0 1.7 2.5 2.2 Lesotho 17 175 88 117 90 3.4 -2.8 1.7 -0.1 -2 23 3.0 2.7 5.8 4.9 3.1 0.8 1.8 Liberia 27 286 255 182 70 0.6 3.4 6.4 5.2 73 62 -4.1 2.4 6.7 6.5 4.6 0.1 1.3 Libya 120 138 42 28 13 6.0 3.9 4.9 4.5 68 52 – -1.4 x 8.1 5.0 2.4 2.5 2.9 Liechtenstein – – – – – – – – – – – 2.2 2.9 x – – – – – Lithuania 159 25 17 12 5 2.1 3.4 5.5 4.6 68 56 – 5.8 x 2.3 2.0 1.6 0.8 0.8 Luxembourg 193 22 9 5 2 4.7 6.1 6.2 6.1 78 60 2.6 2.2 2.0 1.6 1.6 1.1 -0.1 Madagascar 44 152 161 109 50 -0.3 3.9 5.3 4.7 69 55 -2.4 -0.3 7.3 6.3 4.4 0.8 1.5 Malawi 33 347 242 174 64 1.8 3.3 6.7 5.3 74 63 0.0 1.4 7.3 7.0 5.0 0.2 1.3 Malaysia 148 56 17 10 7 6.1 4.9 2.5 3.5 58 31 4.0 3.2 4.9 3.5 1.9 1.6 2.4 Maldives 139 261 94 44 9 5.1 7.5 10.9 9.6 91 81 – 4.1 x 7.2 6.0 2.1 0.9 4.2 Mali 6 400 254 220 115 2.3 1.5 4.3 3.2 55 48 1.4 1.5 7.1 7.2 6.1 0.0 0.6 Malta 153 28 11 8 6 4.5 3.7 1.3 2.3 43 18 6.0 2.2 x 2.0 2.0 1.5 -0.1 1.3 Marshall Islands 63 88 50 41 36 2.8 1.9 0.9 1.3 28 13 – 0.7 – – – – – Mauritania 20 194 118 114 85 2.5 0.4 2.0 1.3 28 25 -1.1 1.2 6.8 6.0 4.5 0.6 1.1 Mauritius 112 83 23 19 14 6.4 2.2 2.1 2.1 42 27 3.1 x 3.6 4.0 2.3 1.5 2.7 1.8 Mexico 120 109 47 26 13 4.2 6.0 4.4 5.0 72 48 1.7 1.1 6.8 3.5 2.2 3.4 1.8 Micronesia (Federated States of) 65 – 56 54 35 – 0.3 2.9 1.9 38 36 – 0.6 6.9 5.0 3.2 1.7 1.8 Monaco 166 – 8 5 4 – 4.1 2.6 3.2 55 33 1.5 1.7 x – – – – – Mongolia 84 – 108 63 22 – 5.4 6.9 6.3 79 64 – 4.1 7.6 4.1 2.6 3.1 1.7 Montenegro 159 – 17 14 5 – 1.8 7.2 5.0 72 66 – 2.8 x 2.7 2.1 1.7 1.4 0.9 Morocco 73 189 80 50 28 4.3 4.7 4.0 4.3 66 45 2.6 2.8 6.7 4.1 2.5 2.5 2.0 Mozambique 23 273 240 171 79 0.6 3.4 5.2 4.5 67 54 -1.1 x 5.1 6.6 6.2 5.3 0.3 0.7 Myanmar 44 179 110 82 50 2.4 2.9 3.3 3.2 55 39 1.4 11.8 x 6.0 3.5 2.2 2.7 1.8 Namibia 52 97 74 76 45 1.4 -0.3 3.4 1.9 38 40 -2.1 x 2.2 6.5 5.2 3.5 1.1 1.6 Nauru 65 – 57 41 35 – 3.2 1.0 1.9 38 14 – – – – – – – Nepal 63 268 141 81 36 3.2 5.6 5.4 5.5 75 56 1.2 2.6 5.9 5.2 2.2 0.7 3.5 Netherlands 166 16 8 6 4 3.2 2.9 3.3 3.1 54 39 1.5 1.7 2.4 1.6 1.8 2.2 -0.5 New Zealand 153 21 11 7 6 3.1 4.1 1.7 2.7 49 23 1.5 x 1.7 3.1 2.1 2.0 2.0 0.1 Nicaragua 84 171 67 40 22 4.7 5.1 4.0 4.4 67 45 -3.7 2.1 6.9 4.6 2.2 2.0 2.9 Niger 10 327 328 227 96 0.0 3.7 5.8 4.9 71 58 -1.9 0.0 7.4 7.7 7.6 -0.2 0.1 THE STATE OF THE WORLD’S CHILDREN 2016 155
TABLE 10. THE RATE OF PROGRESS Average annual Re- rate of reduction ɵ (%) Annual rate of reduction (%) duction GDP per capita average Countries Under-5 Under-5 mortality rate Under-5 mortality rate Reduction since annual growth rate (%) Total fertility rate Total fertility rate mortality 1970– 1990– 2000– 1990– since 1990 2000 1970– 1990– ɵ ɵ and areas rank 1970 1990 2000 2015 1990 2000 2015 2015 (%) (%) 1970–1990 1990–2014 1970 1990 2015 1990 2015 Nigeria 7 285 213 187 109 1.5 1.3 3.6 2.7 49 42 -2.3 3.4 6.5 6.5 5.6 0.0 0.6 Niue 83 – 14 23 23 – -5.2 0.1 -2.0 -67 1 – – – – – – – Norway 182 16 9 5 3 3.1 5.7 4.2 4.8 70 47 3.3 1.6 2.5 1.9 1.8 1.5 0.1 Oman 125 228 39 17 12 8.8 8.6 2.4 4.9 71 30 3.2 0.6 7.3 7.2 2.7 0.1 3.9 Pakistan 22 189 139 112 81 1.5 2.1 2.2 2.1 41 28 2.7 1.7 6.6 6.0 3.6 0.5 2.1 Palau 104 – 36 27 16 – 3.0 3.3 3.2 55 39 – -0.4 x – – – – – Panama 99 68 31 26 17 3.9 1.7 2.8 2.4 45 35 0.2 3.8 5.2 3.1 2.4 2.6 0.9 Papua New Guinea 38 144 89 79 57 2.4 1.3 2.1 1.8 36 27 -1.0 0.9 6.2 4.8 3.7 1.2 1.0 Paraguay 89 78 47 34 21 2.6 3.3 3.3 3.3 56 39 3.8 0.9 5.7 4.5 2.5 1.2 2.4 Peru 99 164 80 39 17 3.6 7.3 5.5 6.2 79 56 -0.5 3.4 6.4 3.8 2.4 2.6 1.8 Philippines 73 84 58 40 28 1.8 3.8 2.3 2.9 52 29 0.6 2.3 6.3 4.3 2.9 1.9 1.5 Poland 159 36 17 9 5 3.7 6.2 3.9 4.8 70 44 – 4.2 2.3 2.1 1.3 0.4 1.7 Portugal 166 68 15 7 4 7.7 7.1 4.6 5.6 76 50 2.5 1.2 3.0 1.5 1.3 3.4 0.8 Qatar 142 66 21 12 8 5.8 5.2 2.9 3.8 62 35 – 1.5 x 6.9 4.0 2.0 2.7 2.8 Republic of Korea 182 53 7 6 3 10.0 1.5 3.9 2.9 52 44 7.5 4.3 4.5 1.6 1.3 5.2 0.9 Republic of Moldova 104 – 33 31 16 – 0.6 4.6 3.0 52 50 1.8 x 0.8 2.6 2.4 1.2 0.3 2.6 Romania 130 66 38 27 11 2.8 3.4 5.9 4.9 71 59 – 3.4 2.8 1.9 1.5 2.1 0.9 Russian Federation 133 44 26 23 10 2.7 1.1 5.9 4.0 63 59 – 2.5 2.0 1.9 1.7 0.3 0.4 Rwanda 56 219 152 184 42 1.8 -1.9 9.9 5.2 73 77 1.1 3.3 8.2 7.3 3.8 0.6 2.6 Saint Kitts and Nevis 130 69 28 19 11 4.5 4.2 3.8 4.0 63 44 6.5 x 1.8 – – – – – Saint Lucia 112 76 23 18 14 6.0 2.4 1.5 1.8 37 20 5.1 x 1.2 6.1 3.4 1.9 2.9 2.4 Saint Vincent and 96 80 25 22 18 5.9 1.0 1.3 1.2 25 18 3.3 2.9 6.0 3.0 2.0 3.6 1.7 the Grenadines Samoa 96 – 31 22 18 – 3.6 1.4 2.3 44 19 – 2.5 7.2 5.1 4.0 1.7 1.0 San Marino 182 – 11 6 3 – 6.8 4.3 5.3 73 47 1.8 3.4 x – – – – – Sao Tome and Principe 49 87 111 89 47 -1.2 2.1 4.2 3.4 57 47 – 3.0 x 6.5 5.8 4.5 0.5 1.0 Saudi Arabia 110 – 44 23 15 – 6.6 3.0 4.5 67 37 -2.1 1.4 7.3 5.9 2.7 1.0 3.1 Senegal 49 291 140 135 47 3.6 0.4 7.0 4.4 66 65 -0.6 1.1 7.3 6.6 5.0 0.5 1.1 Serbia 148 – 28 13 7 – 8.1 4.2 5.8 76 47 – 3.7 x 2.4 2.1 1.6 0.7 1.1 Seychelles 112 72 17 14 14 7.4 1.4 0.3 0.8 18 5 2.9 2.1 5.8 2.7 2.3 3.7 0.7 Sierra Leone 5 335 264 236 120 1.2 1.1 4.5 3.1 54 49 -0.6 1.4 6.0 6.7 4.5 -0.5 1.6 Singapore 182 27 8 4 3 6.3 6.5 2.6 4.2 65 32 5.9 3.5 3.2 1.7 1.2 3.1 1.3 Slovakia 148 – 18 12 7 – 4.1 3.1 3.5 59 38 – 4.2 x 2.5 2.0 1.4 1.0 1.5 Slovenia 182 – 10 6 3 – 6.4 5.0 5.5 75 53 – 2.5 x 2.2 1.5 1.6 2.1 -0.4 Solomon Islands 73 107 40 33 28 5.0 1.8 1.1 1.4 29 15 – -0.4 6.9 5.9 3.9 0.8 1.6 Somalia 3 – 180 174 137 – 0.3 1.6 1.1 24 22 -0.8 – 7.2 7.4 6.4 -0.1 0.6 South Africa 58 – 60 75 41 – -2.3 4.1 1.6 32 46 0.1 1.2 5.6 3.7 2.3 2.1 1.8 South Sudan 13 – 253 182 93 – 3.3 4.5 4.0 63 49 – – 6.9 6.8 4.9 0.1 1.3 Spain 166 29 11 7 4 4.9 5.3 3.1 3.9 63 37 1.9 1.5 2.9 1.3 1.3 3.8 0.0 Sri Lanka 133 71 21 16 10 6.1 2.6 3.4 3.1 54 40 3.0 4.4 4.3 2.5 2.1 2.8 0.7 State of Palestine 89 – 44 30 21 – 4.0 2.3 3.0 52 29 – 1.8 x 7.9 6.7 4.1 0.8 2.0 Sudan 27 155 128 106 70 1.0 1.9 2.8 2.4 45 34 -0.1 3.5 6.9 6.2 4.3 0.6 1.4 Suriname 89 – 48 34 21 – 3.2 3.2 3.2 55 38 -2.3 x 2.2 5.7 3.3 2.3 2.7 1.4 Swaziland 36 176 75 128 61 4.3 -5.4 5.0 0.8 19 53 3.1 1.0 6.9 5.7 3.2 0.9 2.3 Sweden 182 13 7 4 3 3.3 5.2 2.1 3.3 57 27 1.8 2.0 2.0 2.0 1.9 0.1 0.2 Switzerland 166 18 8 6 4 4.0 3.8 2.4 3.0 52 30 1.7 x 1.0 2.1 1.5 1.5 1.6 0.0 Syrian Arab Republic 120 105 37 23 13 5.2 4.6 4.0 4.2 65 45 2.1 1.8 x 7.6 5.3 2.9 1.8 2.4 Tajikistan 52 – 108 93 45 – 1.5 4.9 3.5 59 52 – 0.9 6.9 5.2 3.5 1.4 1.6 Thailand 125 100 37 23 12 5.0 5.0 4.0 4.4 67 45 4.8 3.1 5.6 2.1 1.5 4.9 1.4 The former Yugoslav 153 – 37 16 6 – 8.3 7.1 7.6 85 66 – 1.8 3.2 2.2 1.5 1.8 1.5 Republic of Macedonia Timor-Leste 41 – 176 110 53 – 4.7 4.9 4.8 70 52 – 3.4 x 5.9 5.3 5.6 0.5 -0.2 Togo 24 225 146 121 78 2.1 1.9 2.9 2.5 46 35 -0.5 0.1 7.1 6.3 4.5 0.6 1.3 Tonga 99 50 22 18 17 4.1 2.2 0.3 1.1 24 5 – 1.3 5.9 4.6 3.7 1.2 0.9 Trinidad and Tobago 94 52 31 29 20 2.6 0.6 2.3 1.6 33 29 -0.5 5.1 3.6 2.5 1.8 1.9 1.3 Tunisia 112 181 57 32 14 5.8 5.9 5.4 5.6 75 56 2.5 3.0 6.7 3.5 2.1 3.3 2.0 Turkey 112 187 75 40 14 4.6 6.3 7.2 6.8 82 66 1.9 2.5 5.6 3.1 2.1 3.0 1.6 Turkmenistan 42 – 91 82 51 – 1.0 3.1 2.3 43 37 – 3.5 6.3 4.3 2.3 1.9 2.6 Tuvalu 77 – 57 43 27 – 2.9 3.0 3.0 53 36 – 1.6 – – – – – Uganda 40 190 187 148 55 0.1 2.3 6.7 4.9 71 63 – 3.6 7.1 7.1 5.7 0.0 0.9 Ukraine 139 – 20 19 9 – 0.5 4.8 3.1 54 51 – 1.0 2.0 1.8 1.5 0.7 0.6 United Arab Emirates 148 98 17 11 7 8.9 4.0 3.3 3.5 59 39 -4.3 x -2.9 6.6 4.4 1.8 2.0 3.6 United Kingdom 166 21 9 7 4 4.1 3.4 3.0 3.2 55 36 2.2 1.8 2.3 1.8 1.9 1.2 -0.2 United Republic of Tanzania 46 216 165 131 49 1.3 2.4 6.6 4.9 71 63 – 2.5 6.8 6.2 5.1 0.4 0.8 THE STATE OF THE WORLD’S CHILDREN 2016 156
TABLE 10. THE RATE OF PROGRESS Average annual Re- rate of reduction ɵ (%) Annual rate of reduction (%) duction GDP per capita average Countries Under-5 Under-5 mortality rate Under-5 mortality rate Reduction since annual growth rate (%) Total fertility rate Total fertility rate mortality 1970– 1990– 2000– 1990– since 1990 2000 1970– 1990– ɵ ɵ and areas rank 1970 1990 2000 2015 1990 2000 2015 2015 (%) (%) 1970–1990 1990–2014 1970 1990 2015 1990 2015 United States 148 23 11 8 7 3.7 2.9 1.7 2.2 42 23 2.2 1.6 2.3 2.0 1.9 0.6 0.2 Uruguay 133 54 23 17 10 4.3 3.2 3.4 3.3 56 40 0.9 2.5 2.9 2.5 2.0 0.7 0.9 Uzbekistan 59 – 72 63 39 – 1.2 3.2 2.4 45 38 – 3.2 5.7 4.1 2.4 1.6 2.1 Vanuatu 73 109 36 29 28 5.6 2.2 0.2 1.0 23 4 1.1 x 0.6 6.3 4.9 3.3 1.2 1.6 Venezuela (Bolivarian 110 63 30 22 15 3.7 3.1 2.5 2.7 50 31 -1.2 0.6 5.4 3.4 2.3 2.2 1.6 Republic of) Viet Nam 84 86 51 34 22 2.6 4.1 3.0 3.4 57 36 – 5.5 6.5 3.6 2.0 3.0 2.4 Yemen 56 329 126 95 42 4.8 2.8 5.5 4.4 67 56 – 0.7 x 7.8 8.6 4.0 -0.5 3.0 Zambia 33 182 191 163 64 -0.2 1.6 6.2 4.4 66 61 -2.4 2.4 7.4 6.5 5.3 0.7 0.8 Zimbabwe 26 114 76 106 71 2.0 -3.3 2.7 0.3 7 33 -0.4 -2.8 7.4 5.2 3.9 1.8 1.2 SUMMARY Sub-Saharan Africa 244 180 154 83 1.5 1.6 4.1 3.1 54 46 -0.1 2.4 6.7 6.4 4.9 0.3 1.0 Eastern and Southern Africa 213 167 140 67 1.2 1.8 4.9 3.7 60 52 0.3 1.7 6.9 6.1 4.5 0.6 1.3 West and Central Africa 276 198 172 99 1.6 1.4 3.7 2.8 50 43 -0.7 2.8 6.6 6.6 5.4 0.0 0.8 Middle East and North Africa 200 71 50 29 5.2 3.4 3.7 3.6 59 43 0.8 1.4 6.7 5.1 2.9 1.4 2.2 South Asia 213 129 94 53 2.5 3.2 3.9 3.6 59 44 2.0 4.6 5.8 4.3 2.5 1.5 2.1 East Asia and Pacific 116 58 42 18 3.5 3.4 5.6 4.7 69 57 6.0 7.7 5.7 2.6 1.8 3.8 1.5 Latin America and Caribbean 120 54 32 18 4.0 5.2 3.9 4.4 67 44 1.4 1.8 5.3 3.2 2.1 2.5 1.7 CEE/CIS 97 48 37 17 3.5 2.5 5.1 4.1 64 54 – 2.8 2.8 2.3 1.9 0.9 0.8 Least developed countries 242 175 138 73 1.6 2.4 4.2 3.5 58 47 0.0 3.1 6.8 6.0 4.1 0.6 1.5 World 145 91 76 43 2.3 1.8 3.9 3.0 53 44 2.5 2.9 4.8 3.3 2.5 1.9 1.1 For a complete list of countries and areas in the regions, subregions and country categories, see page 112 or visit . It is not advisable to compare data from consecutive editions of The State of the World’s Children. DEFINITIONS OF THE INDICATORS MAIN DATA SOURCES Under-5 mortality rate – Probability of dying between birth and exactly 5 years of age, Under-5 mortality rate – United Nations Inter-agency Group for Child Mortality Estimation expressed per 1,000 live births. (UNICEF, World Health Organization, United Nations Population Division and the World Bank). GDP per capita – Gross domestic product (GDP) is the sum of value added by all resident GDP per capita – The World Bank. producers plus any product taxes (less subsidies) not included in the valuation of output. GDP Total fertility rate – United Nations Population Division. per capita is gross domestic product divided by midyear population. Growth is calculated from constant price GDP data in local currency. Total fertility rate – Number of children who would be born per woman if she lived to the end NOTES of her childbearing years and bore children at each age in accordance with prevailing – Data not available. age-specific fertility rates. ɵ A negative value indicates an increase in the under-five mortality rate. x Data refer to years or periods other than those specified in the column heading. Such data are not included in the calculation of regional and global averages. THE STATE OF THE WORLD’S CHILDREN 2016 157
TABLE 11. ADOLESCENTS Adolescent population Adolescents Justification of Comprehensive Proportion currently wife-beating among Use of mass media Lower Upper knowledge of HIV of total married/ in union Births by Adoles- adolescents among adolescents secondary secondary among adolescents Aged 10–19 population (%) age 18 cent (%) (%) school gross school gross (%) Countries (thousands) (%) 2010–2015* (%) birth rate 2010–2014* 2010–2014* enrolment ratio enrolment ratio 2010–2014* 2010– 2009– and areas 2015 2015 male female 2015* 2014* male female male female 2010–2014* male female Afghanistan 8,305 26 – 20 26 90 x – 84 – – 66 44 – 2 Albania 454 16 1 x 8 x 3 x 18 37 x 24 x 97 x 99 x 99 94 21 x 36 x Algeria 5,924 15 – 3 1 12 – 55 y – – 132 63 – 7 Andorra – – – – – 5 – – – – – – – – Angola 5,954 24 – – – 191 – – – – 36 21 26 x 24 x Antigua and Barbuda 16 17 – – – 67 x – – – – 116 82 55 40 Argentina 7,020 16 – – 12 70 – 2 – – 128 84 – 36 Armenia 338 11 1 8 2 23 21 8 94 92 97 x 99 4 10 Australia 2,900 12 – – – 14 – – – – 115 181 – – Austria 874 10 – – – 8 – – – – 99 99 – – Azerbaijan 1,295 13 – 9 4 47 – 24 – 98 89 135 2 x 3 x Bahamas 55 14 – – – 40 x – – – – 98 87 – – Bahrain 177 13 – – – 15 – – – – – 85 – – Bangladesh 32,530 20 – 34 24 83 – 33 y – 63 76 45 – 10 Barbados 37 13 – 1 7 49 x – 5 – 98 107 113 – 66 Belarus 879 9 1 7 3 x 22 3 3 – – 104 113 53 51 Belgium 1,231 11 – – – 8 – – – – 181 155 – – Belize 78 22 – 15 17 64 – 11 – – 91 59 – 39 Benin 2,528 23 1 17 20 98 16 15 67 59 68 35 27 26 Bhutan 144 19 – 15 15 28 – 70 – – 92 69 – 22 Bolivia (Plurinational State of) 2,216 21 4 x 13 x 20 x 89 x – 17 x 100 x 97 x 100 77 24 x 20 x Bosnia and Herzegovina 386 10 0 1 – 11 5 1 100 100 – – 41 42 Botswana 441 19 – – – 39 – – – – 91 73 – – Brazil 34,887 17 1 4 – 65 – – – – – – – – Brunei Darussalam 69 16 – – – 17 x – – – – 108 96 – – Bulgaria 635 9 – 2 y 5 43 – – – – 93 108 – – Burkina Faso 4,319 24 2 32 28 136 x 40 39 61 55 42 13 31 29 Burundi 2,403 21 1 9 11 65 x 56 74 83 69 50 21 45 43 Cabo Verde 104 20 2 x 8 x 22 x 92 x 24 x 23 x 88 x 88 x 114 72 – – Cambodia 3,064 20 3 16 7 57 26 y 46 y 77 74 61 29 x 42 33 Cameroon 5,405 23 1 22 28 128 x 43 50 77 66 67 42 30 26 Canada 3,966 11 – – – 13 – – – – 100 119 – – Central African Republic 1,120 23 11 55 45 229 83 79 – – 23 9 26 17 Chad 3,428 24 – 48 47 203 – 59 55 x 24 x 26 18 – 10 Chile 2,568 14 – – – 50 – – – – 103 99 – – China 154,222 11 – 2 – 6 – – – – 107 87 – – Colombia 8,139 17 – 14 20 85 x – – – – 110 x 82 – 21 Comoros 175 22 8 16 17 71 17 43 79 67 66 50 21 18 Congo 1,020 22 2 16 26 147 76 y 73 y 56 68 65 38 25 16 Cook Islands – – – – – 56 – – – – 97 72 – – Costa Rica 759 16 2 10 13 67 – 3 – – 133 102 – 29 Côte d'Ivoire 5,329 23 1 21 31 125 51 51 73 62 50 26 21 15 Croatia 448 11 – – – 12 – – – – 102 98 – – Cuba 1,348 12 7 16 6 50 5 y 4 y – – 101 99 48 59 Cyprus 139 12 – – – 4 – – – – 101 98 – – Czech Republic 932 9 – – – 11 – – – – 104 105 – – Democratic People's Republic 3,820 15 – – – 1 x – – – – 102 x 102 x – 7 x of Korea Democratic Republic of the 18,121 23 1 21 27 135 69 75 49 38 56 37 20 17 Congo Denmark 688 12 – – – 2 – – – – 117 142 – – Djibouti 181 20 – 3 – 21 – – – – 51 40 – 16 x Dominica – – – – – 47 x – – – – 106 81 39 49 Dominican Republic 2,007 19 – 28 21 90 – 7 91 96 87 74 39 39 Ecuador 3,005 19 – 16 x – 100 x – – – – 116 92 – – Egypt 16,511 18 – 14 7 56 – 46 y 100 100 100 72 – 3 y El Salvador 1,230 20 – 21 18 63 – – – – 101 55 – – Equatorial Guinea 178 21 5 22 42 177 x 56 57 91 91 – – 12 17 Eritrea 1,178 23 1 17 19 – 60 51 70 54 45 28 32 22 Estonia 118 9 – – – 16 – – – – 110 107 – – Ethiopia 24,725 25 – 20 22 71 51 64 42 38 42 13 32 24 Fiji 157 18 – – – 28 x – – – – 105 76 – – Finland 592 11 – – – 7 – – – – 101 182 – – THE STATE OF THE WORLD’S CHILDREN 2016 158
TABLE 11. ADOLESCENTS Adolescent population Adolescents Justification of Comprehensive Proportion currently wife-beating among Use of mass media Lower Upper knowledge of HIV of total married/ in union Births by Adoles- adolescents among adolescents secondary secondary among adolescents Aged 10–19 population (%) age 18 cent (%) (%) school gross school gross (%) Countries (thousands) (%) 2010–2015* (%) birth rate 2010–2014* 2010–2014* enrolment ratio enrolment ratio 2010–2014* 2010– 2009– and areas 2015 2015 male female 2015* 2014* male female male female 2010–2014* male female France 7,792 12 – – – 9 – – – – 108 115 – – Gabon 366 21 1 14 28 115 47 58 95 94 – – 35 29 Gambia 464 23 0 24 19 88 42 58 82 70 64 48 27 22 Georgia 434 11 – 11 6 40 – 5 x – – 109 91 – – Germany 7,644 9 – – – 8 – – – – 102 104 – – Ghana 5,860 21 1 6 17 65 20 35 81 67 85 48 25 18 Greece 1,040 9 – – – 9 – – – – 104 113 – – Grenada 19 17 – – – 53 x – – – – 104 97 67 59 Guatemala 3,721 23 – 20 x 22 x 92 – – – – 69 55 24 x 20 x Guinea 2,899 23 1 33 40 154 63 89 55 53 44 31 29 20 Guinea-Bissau 410 22 0 12 28 137 – 39 y – – – – – 12 Guyana 185 24 13 13 16 97 x 25 x 18 x 94 x 94 x 93 83 45 x 53 x Haiti 2,285 21 2 12 13 65 22 24 85 80 57 – 25 32 Holy See – – – – – – – – – – – – – – Honduras 1,793 22 5 23 22 99 18 15 98 94 73 61 33 29 Hungary 979 10 – – – 20 – – – – 101 114 – – Iceland 43 13 – – – 7 – – – – 97 121 – – India 250,098 19 5 x 30 x 22 x 39 47 x 45 x 88 x 72 x 85 56 35 x 19 x Indonesia 46,476 18 – 11 7 47 48 y 45 88 y 91 90 74 4 y,p 9 Iran (Islamic Republic of) 10,905 14 – 16 x 5 35 – – – – 100 83 – – Iraq 8,040 22 – 21 12 68 x – 50 – – – – – 3 Ireland 582 12 – – – 9 – – – – 115 145 – – Israel 1,296 16 – – – 10 – – – – 103 100 – – Italy 5,611 9 – – – 6 – – – – 109 99 – – Jamaica 510 18 – 3 15 72 x – 8 – – 86 79 34 y 39 y Japan 11,564 9 – – – 4 – – – – 101 102 – – Jordan 1,577 21 – 6 4 27 – 84 y – 100 y 87 78 – 6 Kazakhstan 2,274 13 1 5 2 31 x 14 9 99 99 109 98 30 30 Kenya 10,392 23 1 12 23 101 37 45 84 75 97 52 58 52 Kiribati 23 20 5 x 16 x 9 x 49 65 x 77 x 58 x 57 x 103 74 x 46 x 41 x Kuwait 445 11 – – – 8 – – – – 99 85 – – Kyrgyzstan 1,003 17 – 14 4 42 – 22 – 100 95 82 18 14 Lao People's Democratic 1,484 22 9 25 18 94 50 56 92 93 71 39 25 23 Republic Latvia 172 9 – – – 15 – – – – 111 110 – – Lebanon 1,061 18 – 3 x – 18 x – 22 x,y – – 79 58 – – Lesotho 493 23 1 x 16 x 13 x 94 54 x 48 x 64 x 69 x 62 37 28 x 35 x Liberia 1,044 23 2 14 37 147 29 45 59 47 45 30 19 35 Libya 1,089 17 – – – 4 x – – – – – – – – Liechtenstein – – – – – 2 – – – – 104 118 – – Lithuania 292 10 – – – 14 – – – – 104 110 – – Luxembourg 65 12 – – – 6 – – – – 114 94 – – Madagascar 5,714 24 7 28 36 147 x 44 47 62 59 50 22 24 21 Malawi 4,111 24 3 28 31 143 15 16 70 51 47 22 50 43 Malaysia 5,400 18 5 6 – 13 – – – – 92 56 – – Maldives 62 17 – 5 x 1 x 14 – 41 x,y – 100 x 101 – – 22 x,y Mali 4,151 24 – 40 46 x 178 – 83 81 x 79 x 55 30 31 23 Malta 48 12 – – – 16 – – – – 90 82 – – Marshall Islands – – 5 x 21 x 21 x 85 71 x 47 x 86 x 85 x 125 97 x 35 x 27 x Mauritania 909 22 – 25 24 71 – 36 55 x 44 x 36 21 – 5 Mauritius 193 15 – – – 31 – – – – 112 87 – – Mexico 23,754 19 6 15 39 84 – – – – 111 63 – – Micronesia (Federated States of) 25 24 – – – 33 – – – – 86 – – – Monaco – – – – – – – – – – – – – – Mongolia 448 15 1 5 3 40 9 14 99 98 95 85 24 28 Montenegro 83 13 0 2 3 12 5 2 – – 95 86 35 42 Morocco 5,827 17 1 11 8 x 32 x – 64 x – 90 x 95 55 – – Mozambique 6,731 24 8 37 40 166 20 24 73 57 31 14 49 27 Myanmar 10,278 19 4 12 13 x 17 x – – – – 59 34 – 31 Namibia 538 22 1 5 15 78 30 28 65 y 69 – – 51 56 Nauru – – 9 x 18 x 22 x 106 – – 89 x 86 x 77 94 8 x 8 x Nepal 6,623 23 – 25 16 87 x – 35 – 77 89 50 – 38 Netherlands 1,985 12 – – – 5 – – – – 135 126 – – THE STATE OF THE WORLD’S CHILDREN 2016 159
TABLE 11. ADOLESCENTS Adolescent population Adolescents Justification of Comprehensive Proportion currently wife-beating among Use of mass media Lower Upper knowledge of HIV of total married/ in union Births by Adoles- adolescents among adolescents secondary secondary among adolescents Aged 10–19 population (%) age 18 cent (%) (%) school gross school gross (%) Countries (thousands) (%) 2010–2015* (%) birth rate 2010–2014* 2010–2014* enrolment ratio enrolment ratio 2010–2014* 2010– 2009– and areas 2015 2015 male female 2015* 2014* male female male female 2010–2014* male female New Zealand 604 13 – – – 22 – – – – 103 135 – – Nicaragua 1,207 20 – 24 x 28 x 92 – 19 x,y – 95 x 85 58 – – Niger 4,654 23 3 61 48 210 41 54 35 44 24 10 21 12 Nigeria 41,386 23 1 29 29 123 25 33 54 50 46 41 29 22 Niue – – – – – 16 – – – – 91 – – – Norway 632 12 – – – 6 – – – – 99 126 – – Oman 476 11 – 3 2 12 – – – – 108 97 – – Pakistan 38,797 21 2 14 8 48 33 y 53 y 59 y 49 y 56 31 5 y,p 1 y Palau – – – – – 27 – – – – 104 119 – – Panama 686 17 – 14 – 89 – 9 – 96 94 57 – – Papua New Guinea 1,698 22 3 x 15 x 14 x 65 x – – – – 73 22 – – Paraguay 1,342 20 – 11 x – 63 x – – – – 84 69 – – Peru 5,606 18 – 11 15 68 – – – 90 100 88 – 21 x Philippines 20,389 20 – 10 8 59 – 14 – 90 92 77 – 19 x Poland 3,751 10 – – – 14 – – – – 100 116 – – Portugal 1,072 10 – – – 12 – – – – 120 119 – – Qatar 213 10 1 4 – 16 22 6 y 98 98 102 98 23 10 Republic of Korea 5,740 11 – – – 2 – – – – 102 94 – – Republic of Moldova 444 11 1 10 4 25 14 13 96 96 87 92 26 35 Romania 2,108 11 – – – 36 – – – – 95 101 – – Russian Federation 13,252 9 – – – 27 – – – – 97 102 – – Rwanda 2,654 23 – 4 5 41 x 35 56 88 73 48 31 44 49 Saint Kitts and Nevis – – – – – 75 x – – – – 95 86 55 54 Saint Lucia 31 17 – 4 – 50 x – 15 – 99 88 84 – 58 Saint Vincent and 19 17 – – – 70 – – – – 118 85 – – the Grenadines Samoa 43 22 1 8 6 39 28 34 99 97 102 80 5 x 2 x San Marino – – – – – 1 – – – – 94 95 – – Sao Tome and Principe 45 24 2 19 27 110 x 25 x 23 x 96 x 95 x 105 45 39 x 39 x Saudi Arabia 5,285 17 – – – 7 x – – – – 108 108 – – Senegal 3,430 23 0 23 18 80 38 58 96 96 39 x 16 x 28 26 Serbia 1,078 12 – 4 1 22 – 2 99 100 99 90 43 53 Seychelles 13 14 – – – 62 – – – – 110 49 – – Sierra Leone 1,507 23 1 19 36 131 32 55 55 49 63 27 29 28 Singapore 674 12 – – – 3 – – – – – – – – Slovakia 543 10 – – – 21 – – – – 97 86 – – Slovenia 185 9 – – – 5 – – – – 99 120 – – Solomon Islands 133 23 0 x 13 x 15 x 62 x 73 x 72 x 71 x 54 x 75 29 26 x 29 x Somalia 2,599 24 – 25 x – 123 x – 75 x,y – – – – – 3 x South Africa 10,328 19 2 x 4 x 15 x 54 x – – – – 95 95 – – South Sudan 2,874 23 – 40 28 158 x – 72 – – 17 – – 8 Spain 4,373 9 – – – 9 – – – – 132 130 – – Sri Lanka 3,284 16 – 9 x 4 x 24 x – 54 x,y – 88 x,y 100 99 – – State of Palestine 1,086 23 – 9 22 67 – – – – 87 68 – 5 Sudan 9,240 23 – 21 22 102 – 52 – – 50 33 10 4 Suriname 96 18 – 12 – 66 x – 19 – 99 100 52 – 40 Swaziland 295 23 0 4 17 89 34 42 94 x 89 x 73 49 52 56 Sweden 1,025 10 – – – 3 – – – – 112 142 – – Switzerland 833 10 – – – 3 – – – – 110 86 – – Syrian Arab Republic 4,469 24 – 10 x 9 x 75 x – – – – 61 32 – 6 x Tajikistan 1,707 20 – 13 2 47 – 47 – 89 97 68 – 7 Thailand 8,604 13 – 16 13 60 – 10 – – 94 78 – 57 The former Yugoslav Republic 261 13 – 4 2 19 – 14 – – 85 79 – 23 x of Macedonia Timor-Leste 277 23 0 8 9 54 x 72 81 61 62 81 64 15 11 Togo 1,650 23 1 13 15 77 19 26 67 63 68 36 28 23 Tonga 24 23 4 5 2 30 29 27 92 95 – – 13 10 Trinidad and Tobago 177 13 – 6 x – 36 x – 10 x – – 98 x – – 49 x Tunisia 1,618 14 – 1 1 7 – 27 – 98 107 78 – 15 Turkey 13,397 17 – 7 6 29 – 10 – – 140 95 – – Turkmenistan 959 18 – 5 x 2 x 21 x – 37 x,y – 96 x 87 82 – 4 x Tuvalu – – 2 x 8 x 3 x 42 x 83 x 69 x 89 x 95 x 99 56 57 x 31 x Uganda 9,603 25 2 20 33 140 52 62 88 82 31 x 14 x 36 36 THE STATE OF THE WORLD’S CHILDREN 2016 160
TABLE 11. ADOLESCENTS Adolescent population Adolescents Justification of Comprehensive Proportion currently wife-beating among Use of mass media Lower Upper knowledge of HIV of total married/ in union Births by Adoles- adolescents among adolescents secondary secondary among adolescents Aged 10–19 population (%) age 18 cent (%) (%) school gross school gross (%) Countries (thousands) (%) 2010–2015* (%) birth rate 2010–2014* 2010–2014* enrolment ratio enrolment ratio 2010–2014* 2010– 2009– and areas 2015 2015 male female 2015* 2014* male female male female 2010–2014* male female Ukraine 3,954 9 0 7 4 27 2 2 97 96 102 93 37 43 United Arab Emirates 781 9 – – – 34 – – – – – – – – United Kingdom 7,252 11 – – – 21 – – – – 111 133 – – United Republic of Tanzania 12,291 23 8 17 28 128 x 39 52 79 70 43 9 42 37 United States 41,364 13 – – – 27 – – – – 101 91 – – Uruguay 508 15 – 7 – 60 – 3 – – 110 71 – 36 Uzbekistan 5,148 17 – 5 x 2 x 26 x 63 x 63 x – – 99 136 – 27 x Vanuatu 54 21 4 11 13 78 63 56 58 58 69 47 – 14 x Venezuela (Bolivarian 5,640 18 – 16 – 101 – – – – 99 80 – – Republic of) Viet Nam 13,588 15 – 10 5 36 – 28 – 97 94 – – 51 Yemen 6,283 23 – 17 17 67 – 49 – 85 58 39 – 2 x,y Zambia 3,863 24 1 17 31 145 41 49 75 69 63 – 42 39 Zimbabwe 3,504 22 2 25 22 120 37 50 66 64 67 36 49 51 SUMMARY Sub-Saharan Africa 230,815 23 2 24 27 122 40 51 63 56 50 35 32 26 Eastern and Southern Africa 111,070 23 4 21 26 114 42 52 67 60 50 34 40 34 est and Central Africa 110,324 23 1 27 29 130 39 49 59 53 49 36 27 21 W Middle East and North Africa 81,187 18 – 14 9 52 – 50 – – 89 63 - 4 South Asia 339,843 19 – – 16 ‡ 44 – – – – 81 54 - 7 ‡ East Asia and Pacific 276,692 13 – 6 7 ** 22 – 33 ** – 91 ** 95 76 - 25 ** Latin America and Caribbean 110,944 18 3 11 26 74 – – – – 104 80 - - CEE/CIS 50,538 12 – 7 4 29 – 12 – – 98 99 - - Least developed countries 217,127 23 – 25 26 112 46 52 63 60 51 31 31 22 World 1,192,785 16 – 14 18 ‡** 50 – – – – 85 66 - 21 ‡** For a complete list of countries and areas in the regions, subregions and country categories, see page 112 or visit . It is not advisable to compare data from consecutive editions of The State of the World’s Children. DEFINITIONS OF THE INDICATORS MAIN DATA SOURCES Adolescents currently married/ in union – Percentage of boys and girls aged 15–19 who Adolescent population – United Nations Population Division. are currently married or in union. This indicator is meant to provide a snapshot of the current Adolescents currently married/ in union – Demographic and Health Surveys (DHS), marital status of boys and girls in this age group. However, it is worth noting that those not Multiple Indicator Cluster Surveys (MICS), other national surveys and censuses. married at the time of the survey are still exposed to the risk of marrying before they exit Births by age 18 – DHS, MICS and other national surveys. adolescence. Births by age 18 – Percentage of women aged 20–24 who gave birth before age 18. This Adolescent birth rate – United Nations Population Division. standardized indicator from population-based surveys captures levels of fertility among Justification of wife-beating among adolescents – DHS, MICS and other national adolescents up to the age of 18. Note that the data are based on the answers of women aged surveys. 20–24, whose risk of giving birth before the age of 18 is behind them. Use of mass media among adolescents –DHS, MICS and other national surveys Adolescent birth rate – Number of births per 1,000 adolescent girls aged 15–19. Gross enrolment ratio – UNESCO Institute for Statistics (UIS). Justification of wife-beating among adolescents – The percentage of boys and girls aged Comprehensive knowledge of HIV among adolescents – AIS, DHS, MICS and other 15–19 who consider a husband to be justified in hitting or beating his wife for at least one of national household surveys; DHS STATcompiler, . the specified reasons: if his wife burns the food, argues with him, goes out without telling him, neglects the children or refuses sexual relations. Italicized data are from different sources than the data presented for the same indicators in Use of mass media among adolescents – The percentage of boys and girls aged 15–19 other tables of the report. who make use of at least one of the following types of information media at least once a week: newspaper, magazine, television or radio. Lower secondary school gross enrolment ratio – Number of children enrolled in lower NOTES secondary school, regardless of age, expressed as a percentage of the total number of children – Data not available. of official lower secondary school age. x Data refer to years or periods other than those specified in the column heading. Such data Upper secondary school gross enrolment ratio – Number of children enrolled in upper are not included in the calculation of regional and global averages. Estimates from data years secondary school, regardless of age, expressed as a percentage of the total number of children prior to 2000 are not displayed. of official upper secondary school age. y Data differ from the standard definition or refer to only part of a country. If they fall within Comprehensive knowledge of HIV among adolescents – Percentage of young men and the noted reference period, such data are included in the calculation of regional and global women aged 15–19 who correctly identify the two major ways of preventing the sexual averages. transmission of HIV (using condoms and limiting sex to one faithful, uninfected partner), who p Based on small denominators (typically 25–49 unweighted cases). No data based on fewer reject the two most common local misconceptions about HIV transmission and who know that than 25 unweighted cases are displayed. a healthy-looking person can be HIV-positive. * Data refer to the most recent year available during the period specified in the column heading. ** Excludes China. ‡ Excludes India. THE STATE OF THE WORLD’S CHILDREN 2016 161
TABLE 12. DISPARITIES BY RESIDENCE Oral rehydration Comprehensive Use of improved Skilled attendant Stunting prevalence salts (ORS) treatment for Primary school net knowledge of HIV/AIDS sanitation ++ at birth (%) in children under 5 (%) children with diarrhoea attendance ratio (%) Females 15–24 facilities (%) Birth registration (%) 2010–2015* 2010–2015* 2009–2015* (%) 2010–2015* 2009–2014* 2010–2014* 2015 Countries ratio of ratio of ratio of ratio of ratio of ratio of ratio of urban to urban to rural to urban to urban to urban to urban to and areas urban rural rural urban rural rural urban rural urban urban rural rural urban rural rural urban rural rural urban rural rural Afghanistan 60 33 1.8 82 37 2.2 – – – 48 54 0.9 77y 51y 1.5 y 5 1 4.9 45 27 1.7 Albania 99x 98x 1.0 x 100x 99x 1.0 x 20 19 1.0 – – – 93 92 1.0 51x 26x 2.0 x 95 90 1.1 Algeria 100 100 1.0 98 95 1.0 11 12 1.1 25 26 1.0 98 97 1.0 11 7 1.7 90 82 1.1 Andorra – – – – – – – – – – – – – – – – – – 100 100 1.0 Angola 40x 26x 1.5 x 71x 26x 2.8 x 30x 33x 1.1 x – – – 85 67 1.3 – – – 89 22 3.9 Antigua and Barbuda – – – – – – – – – – – – – – – – – – – – – Argentina – – – – – – – – – – – – – – – – – – 96 98 1.0 Armenia 99 100 1.0 100 99 1.0 17 22 1.3 – – – 100 99 1.0 16 16 1.0 96 78 1.2 Australia – – – – – – – – – – – – – – – – – – 100 100 1.0 Austria – – – – – – – – – – – – – – – – – – 100 100 1.0 Azerbaijan 96x 92x 1.0 x 99 95 1.0 15 21 1.4 11 11 1.0 68y 67y 1.0 y 7x 2x 3.3 x 92 87 1.1 Bahamas – – – – – – – – – – – – – – – – – – – – – Bahrain – – – – – – – – – – – – – – – – – – 99 99 1.0 Bangladesh 43 36 1.2 61 36 1.7 31 38 1.2 83 75 1.1 77 72 1.1 14 8 1.8 58 62 0.9 Barbados 98 100 1.0 98 100 1.0 8 7 0.9 – – – 99 99 1.0 67 69 1.0 96 96 1.0 Belarus – – – 100 100 1.0 3x 8x 2.6 x – – – 91 93 1.0 56 57 1.0 94 95 1.0 Belgium – – – – – – – – – – – – – – – – – – 99 99 1.0 Belize 95 96 1.0 98 95 1.0 16 21 1.4 54 47 1.1 98 92 1.1 55 33 1.7 93 88 1.1 Benin 87 76 1.1 90 75 1.2 36x 47x 1.3 x 54 47 1.1 84 72 1.2 29 20 1.5 36 7 4.9 Bhutan 100 100 1.0 96 67 1.4 28 36 1.3 64 60 1.1 98 94 1.0 32 15 2.1 78 33 2.4 Bolivia (Plurinational 79x,y 72x,y 1.1 x,y 94 68 1.4 14 25 1.8 23 20 1.2 98x 96x 1.0 x 32x 9x 3.5 x 61 28 2.2 State of) Bosnia and Herzegovina 99x 100x 1.0 x 100 100 1.0 11 8 0.7 – – – 95 97 1.0 50 47 1.1 99 92 1.1 Botswana 78x 67x 1.2 x 99x 90x 1.1 x 30x 29x 1.0 x 47x 51x 0.9 x – – – – – – 79 43 1.8 Brazil – – – – – – 7x 8x 1.1 x – – – – – – – – – 88 52 1.7 Brunei Darussalam – – – – – – – – – – – – – – – – – – – – – Bulgaria – – – – – – 6x 15x 2.5 x – – – – – – – – – 87 84 1.0 Burkina Faso 93 74 1.3 93 61 1.5 21 37 1.8 31 19 1.6 83 45 1.8 46 24 1.9 50 7 7.5 Burundi 87 74 1.2 88 58 1.5 38 60 1.6 33 38 0.9 91 84 1.1 59 43 1.4 44 49 0.9 Cabo Verde – – – – – – – – – – – – – – – – – – 82 54 1.5 Cambodia 84 72 1.2 98 88 1.1 24 34 1.4 33 34 1.0 96 93 1.0 55 33 1.7 88 30 2.9 Cameroon 81 48 1.7 87 47 1.9 22 41 1.8 27 12 2.2 94 78 1.2 37 18 2.1 62 27 2.3 Canada – – – – – – – – – – – – – – – – – – 100 99 1.0 Central African Republic 78 52 1.5 83 38 2.2 38 42 1.1 23 12 2.0 86 66 1.3 19 16 1.2 44 7 6.0 Chad 36 6 5.6 60 12 5.1 32 42 1.3 28 18 1.5 71 47 1.5 18 7 2.6 31 6 4.9 Chile – – – – – – – – – – – – 91y 92y 1.0 y – – – 100 91 1.1 China – – – 100 100 1.0 3 12 3.6 – – – 97y 96y 1.0 y – – – 87 64 1.4 Colombia 97 95 1.0 98 86 1.1 12 17 1.5 57 49 1.2 96 95 1.0 26 17 1.5 85 68 1.3 Comoros 90 87 1.0 92 79 1.2 25 32 1.3 40 37 1.1 90 82 1.1 24 17 1.4 48 31 1.6 Congo 95 85 1.1 98 84 1.2 20 30 1.5 31 22 1.4 99 96 1.0 16 10 1.5 20 6 3.6 Cook Islands – – – – – – – – – – – – – – – – – – 98 98 1.0 Costa Rica 100 99 1.0 99 97 1.0 – – – 43 35 1.2 97 95 1.0 37 27 1.4 95 92 1.0 Côte d'Ivoire 85 54 1.6 84 45 1.9 21 35 1.7 22 14 1.5 78 64 1.2 22 8 2.7 33 10 3.2 Croatia – – – – – – – – – – – – – – – – – – 98 96 1.0 Cuba 100 100 1.0 99 100 1.0 – – – 62 59 1.0 – – – 61 63 1.0 94 89 1.1 Cyprus – – – – – – – – – – – – – – – – – – 100 100 1.0 Czech Republic – – – – – – – – – – – – – – – – – – 99 99 1.0 Democratic People's 100x 100x 1.0 x 100x 100x 1.0 x 23 45 1.9 75x 73x 1.0 x 100 99 1.0 11x 4x 2.8 x 88 73 1.2 Republic of Korea Democratic Republic 30 22 1.3 94 74 1.3 33 47 1.4 44 37 1.2 93 84 1.1 24 15 1.6 29 29 1.0 of the Congo Denmark – – – – – – – – – – – – – – – – – – 100 100 1.0 Djibouti 92x 84x 1.1 x 98 55 1.8 30 42 1.4 – – – – – – 18x 9x 2.0 x 60 5 11.7 Dominica – – – – – – – – – – – – – – – – – – – – – Dominican Republic 85 80 1.1 99 97 1.0 7 6 0.9 48 48 1.0 95 97 1.0 45 44 1.0 86 76 1.1 Ecuador 92 93 1.0 98 84 1.2 22 32 1.5 52 35 1.5 97y 97y 1.0 y – – – 87 81 1.1 Egypt 100 99 1.0 97 89 1.1 23 21 0.9 26 29 0.9 97 97 1.0 7x 3x 2.3 x 97 93 1.0 El Salvador 99x 99x 1.0 x – – – 14x 24x 1.8 x 60x 56x 1.1 x 92y 90y 1.0 y – – – 82 60 1.4 Equatorial Guinea 60 47 1.3 86 53 1.6 20 32 1.6 55 27 2.0 – – – 27 9 2.9 80 71 1.1 Eritrea – – – 74 17 4.4 38 56 1.4 51 41 1.2 79y 47y 1.7 y 32 20 1.7 45 7 6.1 Estonia – – – – – – – – – – – – – – – – – – 98 97 1.0 Ethiopia 29x 5x 5.9 x 58 9 6.4 27 42 1.6 45 24 1.9 80y 63y 1.3 y 38 19 2.0 27 28 1.0 Fiji – – – – – – 5x 9x 1.7 x – – – – – – – – – 93 88 1.1 Finland – – – – – – – – – – – – – – – – – – 99 88 1.1 THE STATE OF THE WORLD’S CHILDREN 2016 162
TABLE 12. DISPARITIES BY RESIDENCE Oral rehydration Comprehensive Use of improved Skilled attendant Stunting prevalence salts (ORS) treatment for Primary school net knowledge of HIV/AIDS sanitation ++ at birth (%) in children under 5 (%) children with diarrhoea attendance ratio (%) Females 15–24 facilities (%) Birth registration (%) 2010–2015* 2010–2015* 2009–2015* (%) 2010–2015* 2009–2014* 2010–2014* 2015 Countries ratio of ratio of ratio of ratio of ratio of ratio of ratio of urban to urban to rural to urban to urban to urban to urban to and areas urban rural rural urban rural rural urban rural urban urban rural rural urban rural rural urban rural rural urban rural rural France – – – – – – – – – – – – – – – – – – 99 99 1.0 Gabon 89 91 1.0 93 69 1.3 14 29 2.0 27 21 1.3 95 95 1.0 32 15 2.2 43 32 1.4 Gambia 72 72 1.0 75 41 1.9 19 29 1.5 62 57 1.1 75 54 1.4 32 18 1.8 62 55 1.1 Georgia 100 100 1.0 – – – 10 12 1.2 44x 36x 1.2 x 97 95 1.0 – – – 95 76 1.3 Germany – – – – – – – – – – – – – – – – – – 99 99 1.0 Ghana 79 63 1.3 87 57 1.5 15 22 1.5 48 49 1.0 75 66 1.1 23 17 1.4 20 9 2.3 Greece – – – – – – – – – – – – – – – – – – 99 98 1.0 Grenada – – – – – – – – – – – – – – – – – – 98 98 1.0 Guatemala 96x 97x 1.0 x 84 55 1.5 35 53 1.5 51 48 1.1 – – – 32x 14x 2.2 x 78 49 1.6 Guinea 83 49 1.7 84 32 2.7 18 36 2.1 46 30 1.5 84 47 1.8 32 16 2.0 34 12 2.9 Guinea-Bissau 30 21 1.4 69 29 2.4 23 37 1.6 28 13 2.1 74 53 1.4 22 8 2.8 34 8 3.9 Guyana 91x 87x 1.0 x – – – 11 20 1.8 – – – 97 97 1.0 72x 47x 1.5 x 88 82 1.1 Haiti 85 77 1.1 59 25 2.4 16 25 1.6 56 51 1.1 90 81 1.1 41 29 1.4 34 19 1.8 Holy See – – – – – – – – – – – – – – – – – – – – – Honduras 95 93 1.0 94 73 1.3 15 29 2.0 59 61 1.0 92y 92y 1.0 y 42 23 1.9 87 78 1.1 Hungary – – – – – – – – – – – – – – – – – – 98 99 1.0 Iceland – – – – – – – – – – – – – – – – – – 99 100 1.0 India 83 67 1.2 76x 43x 1.7 x 32 42 1.3 33x 24x 1.4 x 88x 82x 1.1 x 33x 14x 2.4 x 63 28 2.2 Indonesia 78y 60y 1.3 y 94 81 1.2 33 42 1.3 41 37 1.1 99 98 1.0 14y 9y 1.6 y 72 47 1.5 Iran (Islamic Republic of) 99y 98y 1.0 y 98 93 1.1 5 9 1.7 64 58 1.1 97 95 1.0 – – – 93 82 1.1 Iraq 99 99 1.0 94 85 1.1 22 24 1.1 25 19 1.3 94 84 1.1 4 1 3.7 86 84 1.0 Ireland – – – – – – – – – – – – – – – – – – 89 93 1.0 Israel – – – – – – – – – – – – – – – – – – 100 100 1.0 Italy – – – – – – – – – – – – – – – – – – 99 100 1.0 Jamaica 100 99 1.0 100 98 1.0 – – – – – – 98 98 1.0 – – – 80 84 1.0 Japan – – – – – – – – – – – – – – – – – – 100 100 1.0 Jordan 99 100 1.0 100 100 1.0 7 9 1.2 20 23 0.9 98 98 1.0 8 11 0.7 99 99 1.0 Kazakhstan 100 100 1.0 100 100 1.0 13 13 1.0 – – – 99 99 1.0 40 31 1.3 97 98 1.0 Kenya 79 61 1.3 82 50 1.6 20 29 1.5 58 52 1.1 89 84 1.1 63 52 1.2 31 30 1.1 Kiribati 95x 93x 1.0 x – – – – – – – – – – – – 45x 43x 1.1 x 51 31 1.7 Kuwait – – – – – – – – – – – – – – – – – – 100 100 1.0 Kyrgyzstan 99 97 1.0 99 98 1.0 12 13 1.1 34 33 1.0 99 100 1.0 26 16 1.7 89 96 0.9 Lao People's Democratic 88 71 1.2 80 31 2.6 27 49 1.8 65 40 1.6 95 83 1.1 39 18 2.2 94 56 1.7 Republic Latvia – – – – – – – – – – – – – – – – – – 91 82 1.1 Lebanon – – – – – – – – – – – – – – – – – – 81 81 1.0 Lesotho 43x 46x 1.0 x 90 73 1.2 27 35 1.3 53 54 1.0 98 93 1.0 44x 36x 1.2 x 37 28 1.4 Liberia 29y 20y 1.5 y 73 50 1.5 30 33 1.1 57 63 0.9 52 31 1.7 40 27 1.5 28 6 4.7 Libya – – – – – – – – – – – – – – – – – – 97 96 1.0 Liechtenstein – – – – – – – – – – – – – – – – – – – – – Lithuania – – – – – – – – – – – – – – – – – – 97 83 1.2 Luxembourg – – – – – – – – – – – – – – – – – – 98 99 1.0 Madagascar 97 81 1.2 78 39 2.0 43 51 1.2 16 14 1.1 86y 66y 1.3 y 44 18 2.5 18 9 2.1 Malawi 11y 5y 2.4 y 94 87 1.1 36 43 1.2 65 63 1.0 98 93 1.1 50 43 1.2 47 40 1.2 Malaysia – – – – – – – – – – – – – – – – – – 96 96 1.0 Maldives 93x 92x 1.0 x – – – 16 20 1.3 – – – 94 94 1.0 43x,y 32x,y 1.4 x,y 97 98 1.0 Mali 92 77 1.2 80x 38x 2.1 x 26x 42x 1.6 x 26x 11x 2.3 x 80 50 1.6 36 19 1.9 38 16 2.3 Malta – – – – – – – – – – – – – – – – – – 100 100 1.0 Marshall Islands 96x 96x 1.0 x – – – – – – 39x 37x 1.1 x – – – 33x 12x 2.7 x 84 56 1.5 Mauritania 75 49 1.5 88 49 1.8 25 33 1.3 26 14 2.0 72 55 1.3 9 4 2.7 58 14 4.2 Mauritius – – – – – – – – – – – – – – – – – – 94 93 1.0 Mexico 98x,y 82x,y 1.2 x,y – – – 11 21 1.9 54 48 1.1 – – – – – – 88 74 1.2 Micronesia (Federated – – – – – – – – – – – – – – – – – – 85 49 1.7 States of) Monaco – – – – – – – – – – – – – – – – – – 100 – – Mongolia 99 99 1.0 99 99 1.0 8 15 1.7 35 26 1.4 97 94 1.0 26 15 1.7 66 43 1.6 Montenegro 99 100 1.0 99 100 1.0 10 9 1.0 – – – 97 99 1.0 47 49 1.0 98 92 1.1 Morocco 97y 91y 1.1 y 92 55 1.7 9 21 2.4 23 21 1.1 96x 83x 1.2 x – – – 84 66 1.3 Mozambique 51 47 1.1 80 44 1.8 35 46 1.3 65 50 1.3 86 72 1.2 40 24 1.6 42 10 4.2 Myanmar 94 64 1.5 90 63 1.4 27 38 1.4 72 56 1.3 93 89 1.0 – – – 84 77 1.1 Namibia 89y 86y 1.0 y 95 82 1.2 17 28 1.7 75 69 1.1 95 91 1.0 67 55 1.2 54 17 3.2 Nauru – – – – – – – – – – – – – – – – – – 66 – – Nepal 57 58 1.0 90 51 1.8 24 39 1.7 47 44 1.1 80 76 1.1 40 24 1.7 56 43 1.3 Netherlands – – – – – – – – – – – – – – – – – – 97 100 1.0 THE STATE OF THE WORLD’S CHILDREN 2016 163
TABLE 12. DISPARITIES BY RESIDENCE Oral rehydration Comprehensive Use of improved Skilled attendant Stunting prevalence salts (ORS) treatment for Primary school net knowledge of HIV/AIDS sanitation ++ at birth (%) in children under 5 (%) children with diarrhoea attendance ratio (%) Females 15–24 facilities (%) Birth registration (%) 2010–2015* 2010–2015* 2009–2015* (%) 2010–2015* 2009–2014* 2010–2014* 2015 Countries ratio of ratio of ratio of ratio of ratio of ratio of ratio of urban to urban to rural to urban to urban to urban to urban to and areas urban rural rural urban rural rural urban rural urban urban rural rural urban rural rural urban rural rural urban rural rural New Zealand – – – – – – – – – – – – – – – – – – – – – Nicaragua – – – 97 79 1.2 – – – 74 57 1.3 76y 64y 1.2 y – – – 76 56 1.4 Niger 92 60 1.5 83 32 2.6 30 46 1.6 47 44 1.1 83 45 1.9 31 9 3.3 38 5 8.2 Nigeria 50y 19y 2.7 y 67 23 3.0 26 43 1.7 45 28 1.6 87 57 1.5 30 20 1.4 33 25 1.3 Niue – – – – – – – – – – – – 100 100 1.0 – – – 100 100 1.0 Norway – – – – – – – – – – – – – – – – – – 98 98 1.0 Oman – – – – – – – – – – – – – – – – – – 97 95 1.0 Pakistan 59 23 2.6 71 44 1.6 37 48 1.3 42 37 1.1 75 59 1.3 – – – 83 51 1.6 Palau – – – – – – – – – – – – – – – – – – 100 100 1.0 Panama 98 93 1.1 100 78 1.3 – – – 61 44 1.4 97 97 1.0 – – – 84 58 1.4 Papua New Guinea – – – 88x 48x 1.9 x 35 50 1.4 – – – – – – – – – 56 13 4.2 Paraguay 87y 80y 1.1 y – – – 12 10 0.8 – – – 89x 87x 1.0 x – – – 95 78 1.2 Peru 97y 95y 1.0 y 97 73 1.3 8 29 3.5 32 21 1.5 92y 93y 1.0 y 27x 8x 3.3 x 82 53 1.6 Philippines – – – 83 64 1.3 26 35 1.4 54 45 1.2 90x 87x 1.0 x 23x 17x 1.4 x 78 71 1.1 Poland – – – – – – – – – – – – – – – – – – 98 97 1.0 Portugal – – – – – – – – – – – – – – – – – – 100 100 1.0 Qatar – – – – – – – – – – – – – – – – – – 98 98 1.0 Republic of Korea – – – – – – – – – – – – – – – – – – 100 100 1.0 Republic of Moldova 100 100 1.0 100 99 1.0 4 8 2.2 – – – 98 99 1.0 41 32 1.3 88 67 1.3 Romania – – – – – – 14x 15x 1.1 x – – – – – – – – – 92 63 1.5 Russian Federation – – – – – – – – – – – – – – – – – – 77 59 1.3 Rwanda 60 64 0.9 97 89 1.1 24 41 1.7 33 27 1.3 91y 87y 1.0 y 66 50 1.3 59 63 0.9 Saint Kitts and Nevis – – – – – – – – – – – – – – – – – – – – – Saint Lucia 91 92 1.0 – 99 – 4 2 0.6 – – – 99 100 1.0 57 63 0.9 85 92 0.9 Saint Vincent and the – – – – – – – – – – – – – – – – – – – – – Grenadines Samoa 68 57 1.2 97 79 1.2 – – – – – – 89y 88y 1.0 y 5x 2x 2.4 x 93 91 1.0 San Marino – – – – – – – – – – – – – – – – – – – – – Sao Tome and Principe 76x 74x 1.0 x – – – 29 29 1.0 – – – 94 93 1.0 47x 38x 1.3 x 41 23 1.8 Saudi Arabia – – – – – – – – – – – – – – – – – – 100 100 1.0 Senegal 87 63 1.4 80 44 1.8 12 23 1.9 19 25 0.8 79 53 1.5 – – – 65 34 1.9 Serbia 100 99 1.0 100 100 1.0 7 5 0.8 50 22 2.3 100 98 1.0 63 41 1.5 98 94 1.0 Seychelles – – – – – – – – – – – – – – – – – – 98 98 1.0 Sierra Leone 80 76 1.1 79 53 1.5 30 40 1.4 86 85 1.0 88 71 1.2 38 22 1.7 23 7 3.3 Singapore – – – – – – – – – – – – – – – – – – 100 – – Slovakia – – – – – – – – – – – – – – – – – – 99 98 1.0 Slovenia – – – – – – – – – – – – – – – – – – 99 99 1.0 Solomon Islands – – – 95x 84x 1.1 x 23x 34x 1.5 x 40x 37x 1.1 x 72x,y 65x,y 1.1 x,y 34x 28x 1.2 x 81 15 5.4 Somalia 6x 2x 3.7 x – – – 32x 48x 1.5 x 25x 9x 2.9 x 39x 11x 3.4 x 7x 2x 4.1 x – – – South Africa – – – – – – 32x 34x 1.1 x 41x 32x 1.3 x – – – – – – 70 61 1.1 South Sudan 45 32 1.4 31 15 2.0 29 32 1.1 44 37 1.2 40 19 2.1 16 7 2.3 16 4 3.7 Spain – – – – – – – – – – – – – – – – – – 100 100 1.0 Sri Lanka 97x 98x 1.0 x 99x 99x 1.0 x 10 15 1.5 57x 50x 1.1 x – – – – – – 88 97 0.9 State of Palestine 99 100 1.0 100 100 1.0 8 8 1.0 30 34 0.9 99 99 1.0 8 6 1.3 93 90 1.0 Sudan 85 50 1.7 41 16 2.5 27 43 1.6 23 22 1.1 86 64 1.4 10 3 3.4 – – – Suriname 100 98 1.0 95 86 1.1 7 12 1.8 33 55 0.6 97 94 1.0 45 33 1.4 88 61 1.4 Swaziland 62 47 1.3 89 80 1.1 23 33 1.4 65 55 1.2 97 96 1.0 70 55 1.3 63 56 1.1 Sweden – – – – – – – – – – – – – – – – – – 99 100 1.0 Switzerland – – – – – – – – – – – – – – – – – – 100 100 1.0 Syrian Arab Republic 97x 95x 1.0 x 99x 93x 1.1 x 28 28 1.0 56x 44x 1.3 x 98x 96x 1.0 x 7x 7x 1.0 x 96 95 1.0 Tajikistan 88 89 1.0 93 86 1.1 21 27 1.3 58 61 0.9 98 97 1.0 11 8 1.4 94 95 1.0 Thailand 99y 100y 1.0 y 100 100 1.0 13 18 1.4 59 57 1.0 96 96 1.0 55 56 1.0 90 96 0.9 The former Yugoslav 100 100 1.0 98 98 1.0 4 6 1.4 – – – 98 98 1.0 33x 18x 1.8 x 97 83 1.2 Republic of Macedonia Timor-Leste 50 57 0.9 59 20 2.9 39 55 1.4 65 74 0.9 80 70 1.1 14 12 1.2 69 27 2.6 Togo 95 69 1.4 92 41 2.2 16 33 2.1 18 19 0.9 96 85 1.1 28 19 1.5 25 3 8.4 Tonga 92 94 1.0 96 99 1.0 9 8 0.9 – – – 92y 93y 1.0 y 11 13 0.8 98 89 1.1 Trinidad and Tobago – – – – – – – – – – – – – – – – – – 92 92 1.0 Tunisia 100 98 1.0 100 97 1.0 8 14 1.7 69 59 1.2 99 97 1.0 22 13 1.7 97 80 1.2 Turkey 99y 98y 1.0 y 99 92 1.1 8 14 1.8 – – – 94x,y 91x,y 1.0 x,y – – – 98 86 1.1 Turkmenistan 96x 95x 1.0 x 100x 99x 1.0 x 17x 19x 1.1 x – – – 99x 99x 1.0 x – – – – – – Tuvalu 60x 38x 1.6 x – – – 10x 11x 1.1 x – – – 98x,y 99x,y 1.0 x,y 38x 41x 0.9 x 86 – – 89 52 1.7 19 36 1.9 46 43 1.1 91 86 1.1 50 35 1.4 29 17 1.7 Uganda 38 29 1.3 Ukraine 100 100 1.0 99 99 1.0 20x 29x 1.4 x – – – 100 100 1.0 52 45 1.1 97 93 1.1 THE STATE OF THE WORLD’S CHILDREN 2016 164
TABLE 12. DISPARITIES BY RESIDENCE Oral rehydration Comprehensive Use of improved Skilled attendant Stunting prevalence salts (ORS) treatment for Primary school net knowledge of HIV/AIDS sanitation ++ at birth (%) in children under 5 (%) children with diarrhoea attendance ratio (%) Females 15–24 facilities (%) Birth registration (%) 2010–2015* 2010–2015* 2009–2015* (%) 2010–2015* 2009–2014* 2010–2014* 2015 Countries ratio of ratio of ratio of ratio of ratio of ratio of ratio of urban to urban to rural to urban to urban to urban to urban to and areas urban rural rural urban rural rural urban rural urban urban rural rural urban rural rural urban rural rural urban rural rural United Arab Emirates – – – – – – – – – – – – – – – – – – 98 95 1.0 United Kingdom – – – – – – – – – – – – – – – – – – 99 100 1.0 United Republic of Tanzania 36y 8y 4.4 y 83 40 2.0 30 39 1.3 44 44 1.0 91y 72y 1.3 y 52 36 1.5 31 8 3.8 United States – – – – – – – – – – – – – – – – – – 100 100 1.0 Uruguay 100 100 1.0 98 98 1.0 – – – – – – 97 97 1.0 34 35 1.0 97 93 1.0 Uzbekistan 100x 100x 1.0 x 100x 100x 1.0 x 18x 19x 1.1 x – – – 96x 94x 1.0 x 33x 30x 1.1 x 100 100 1.0 Vanuatu 51y 37y 1.4 y 96 87 1.1 19 32 1.6 38 52 0.7 77y 77y 1.0 y 23x 13x 1.8 x 65 55 1.2 Venezuela (Bolivarian – – – – – – – – – – – – – – – – – – 97 70 1.4 Republic of) Viet Nam 97 96 1.0 99 92 1.1 12 27 2.3 58 49 1.2 98 98 1.0 54 47 1.1 94 70 1.4 Yemen 48 24 2.0 73 34 2.1 34 51 1.5 24 26 0.9 85 73 1.2 4x 1x 6.7 x – – – Zambia 20 7 3.0 89 52 1.7 36 42 1.2 68 62 1.1 92 84 1.1 50 34 1.5 56 36 1.6 Zimbabwe 57 23 2.4 93 75 1.2 20 30 1.5 45 43 1.1 96 93 1.0 66 51 1.3 49 31 1.6 SUMMARY Sub-Saharan Africa 59 37 1.6 77 40 1.9 26 41 1.5 42 35 1.2 86 68 1.3 34 24 1.4 40 23 1.7 Eastern and Southern Africa 53 37 1.4 79 41 1.9 29 40 1.4 48 40 1.2 87 74 1.2 49 31 1.6 47 26 1.8 est and Central Africa 60 37 1.6 79 41 1.9 25 41 1.6 41 31 1.3 86 62 1.4 28 17 1.7 35 20 1.8 W Middle East and North Africa 95 80 1.2 90 65 1.4 17 27 1.6 34 29 1.2 95 84 1.1 – – – 93 87 1.1 South Asia 75 57 1.3 69‡ 41‡ 1.7 ‡ 33 42 1.3 55‡ 52‡ 1.1 ‡ 85 77 1.1 – 9‡ – 65 35 1.8 East Asia and Pacific 84** 72** 1.2 ** 97 90 1.1 12 23 2.0 49** 44** 1.1 ** 97 96 1.0 26** 26** 1.0 ** 86 64 1.3 Latin America and Caribbean – – – – – – 13 26 2.0 51 44 1.1 – – – – – – 88 64 1.4 CEE/CIS – – – 99 95 1.0 10r 16r 1.6 r – – – – – – – – – 89 81 1.1 Least developed countries 57 40 1.4 77 42 1.8 29 41 1.4 49 41 1.2 85 70 1.2 30 19 1.6 47 33 1.4 World 83** 60** 1.4 ** 88‡ 59‡ 1.5 ‡ 21 35 1.7 45‡** 39‡** 1.1 ‡** 91 79 1.1 – 22‡** – 82 51 1.6 For a complete list of countries and areas in the regions, subregions and country categories, see page 112 or visit . It is not advisable to compare data from consecutive editions of The State of the World’s Children. DEFINITIONS OF THE INDICATORS MAIN DATA SOURCES Birth registration – Percentage of children under age 5 who were registered at Birth registration – Demographic and Health Surveys (DHS), Multiple Indicator Cluster Surveys the moment of the survey. The numerator of this indicator includes children (MICS), other national surveys, censuses and vital registration systems. reported to have a birth certificate, regardless of whether or not it was seen by Skilled attendant at birth – DHS, MICS and other nationally representative sources. the interviewer, and those without a birth certificate whose mother or caregiver Stunting prevalence in children under 5 – DHS, MICS, other national household surveys, WHO and says the birth has been registered. UNICEF. Skilled attendant at birth – Percentage of births attended by skilled health Oral rehydration salts (ORS) treatment for children with diarrhoea – DHS, MICS and other personnel (doctor, nurse or midwife). national household surveys. Stunting prevalence in children under 5 – Percentage of children aged Primary school net attendance ratio – DHS, MICS and other national household surveys. 0–59 months who are below minus two standard deviations from median height-for-age of the WHO Child Growth Standards. Comprehensive knowledge of HIV – AIDS Indicator Surveys (AIS), DHS, MICS, and other national Oral rehydration salts (ORS) treatment for children with diarrhoea – household surveys; DHS STATcompiler, www.statcompiler.com. Percentage of children under age 5 who had diarrhoea in the two weeks Use of improved sanitation facilities – WHO/UNICEF Joint Monitoring Programme for Water Supply preceding the survey and who received oral rehydration salts (ORS packets or and Sanitation (JMP). pre-packaged ORS fluids). Italicized data are from different sources than the data presented for the same indicators in other tables Primary school net attendance ratio – Number of children attending primary of the report: Table 2 (Nutrition – Stunting prevalence), Table 3 (Health – Diarrhoea treatment), Table 4 or secondary school who are of official primary school age, expressed as a (HIV/AIDS – Comprehensive knowledge of HIV), Table 5 (Education – Primary school participation), percentage of the total number of children of official primary school age. Table 8 (Women – Skilled attendant at birth) and Table 9 (Child protection – Birth registration). Because of the inclusion of primary-school-aged children attending secondary school, this indicator can also be referred to as a primary adjusted net attendance ratio. NOTES Comprehensive knowledge of HIV – Percentage of young women (aged - Data not available. 15–24) who correctly identify the two major ways of preventing the sexual x Data refer to years or periods other than those specified in the column heading. Such data are not transmission of HIV (using condoms and limiting sex to one faithful, uninfected included in the calculation of regional and global averages, with the exception of 2005–2006 data on partner), who reject the two most common local misconceptions about HIV primary attendance from India. Estimates from data years prior to 2000 are not displayed. transmission and who know that a healthy-looking person can be HIV-positive. y Data differ from the standard definition or refer to only part of a country. If they fall within the noted Use of improved sanitation facilities – Percentage of the population using reference period, such data are included in the calculation of regional and global averages. any of the following sanitation facilities, not shared with other households: flush ++ Changes in the definition of birth registration were made from the second and third rounds of MICS or pour-flush latrine connected to a piped sewerage system, septic tank or pit (MICS2 and MICS3) to the fourth round (MICS4). In order to allow for comparability with later rounds, latrine; ventilated improved pit latrine; pit latrine with a slab; composting toilet. data from MICS2 and MICS3 on birth registration were recalculated according to the MICS4 indicator definition. Therefore, the recalculated data presented here may differ from estimates included in MICS2 and MICS3 national reports. * Data refer to the most recent year available during the period specified in the column heading. ** Excludes China. ‡ Excludes India. r Excludes the Russian Federation. THE STATE OF THE WORLD’S CHILDREN 2016 165
TABLE 13. DISPARITIES BY HOUSEHOLD WEALTH Oral rehydration salts Comprehensive Comprehensive Skilled attendant at Stunting prevalence in (ORS) treatment for Primary school net knowledge of HIV/AIDS knowledge of HIV/AIDS ++ birth (%) children under 5 (%) children with diarrhoea attendance ratio (%) Females 15–24 (%) Males 15–24 Birth registration (%) 2010–2015* 2010–2015* 2009–2015* (%) 2010–2015* 2009–2014* 2010–2014* 2010–2014* Countries ratio of ratio of ratio of ratio of ratio of ratio of ratio of and areas poorest richest richest to poorest richest richest to poorest richest poorest to poorest richest richest to poorest richest richest to poorest richest richest to poorest richest richest to 20% 20% poorest 20% 20% poorest 20% 20% richest 20% 20% poorest 20% 20% poorest 20% 20% poorest 20% 20% poorest Afghanistan 31 58 1.9 16 76 4.9 49 31 1.6 56 52 0.9 40 79 2.0 0 5 23.0 – – – Albania 98x 99x 1.0 x 98x 100x 1.0 x 27 13 2.1 – – – 91 94 1.0 20x 60x 3.0 x 10 x 38x 3.8 x Algeria 99 100 1.0 95 99 1.0 13 11 1.2 21 31 1.5 96 98 1.0 4 17 3.8 – – – Andorra – – – – – – – – – – – – – – – – – – – – – Angola 24x 53x 2.2 x – – – – – – – – – 63 90 1.4 – – – – – – Antigua and Barbuda – – – – – – – – – – – – – – – – – – – – – Argentina 99y 100y 1.0 y – – – – – – 26 6 0.2 98 99 1.0 29 54 1.8 – – – Armenia 100 100 1.0 99 100 1.0 26 19 1.4 – – – 99 100 1.0 – – – – – – Australia – – – – – – – – – – – – – – – – – – – – – Austria – – – – – – – – – – – – – – – – – – – – – Azerbaijan 92x 97x 1.1 x 90 100 1.1 28 16 1.8 – – – 67y 70y 1.0 y 1x 12x 10.3 x 2 x 14x 6.3 x Bahamas – – – – – – – – – – – – – – – – – – – – – Bahrain – – – – – – – – – – – – – – – – – – – – – Bangladesh 30 47 1.5 18 73 4.1 50 21 2.4 72 84 1.2 65 81 1.3 2 18 8.9 – – – Barbados 98 99 1.0 – – – 8 3 2.4 – – – 99 99 1.0 57 66 1.2 – – – Belarus – – – 100 100 1.0 11x 2x 5.3 x – – – 93 93 1.0 55 55 1.0 42 43 1.0 Belgium – – – – – – – – – – – – – – – – – – – – – Belize 95 97 1.0 89 98 1.1 33 9 3.7 43 57 1.3 88 98 1.1 20 53 2.7 – – – Benin 61 95 1.6 60 98 1.6 50x 29x 1.7 x 43 57 1.3 57 90 1.6 9x 26x 3.1 x 17 x 52x 3.0 x Bhutan 100 100 1.0 34 95 2.8 41 21 1.9 60 56 0.9 85 97 1.1 7 32 4.4 – – – Bolivia (Plurinational 68x,y 90x,y 1.3 x,y 57 99 1.7 32 9 3.5 18 27 1.5 95x 99x 1.0 x 5x 40x 8.4 x 11 x 45x 4.3 x State of) Bosnia and Herzegovina 100x 99x 1.0 x 100 100 1.0 10 10 1.0 – – – 93 94 1.0 37 44 1.2 38 45 1.2 Botswana – – – – – – 38x 20x 1.9 x – – – – – – – – – – – – Brazil – – – – – – 7 3 2.1 – – – – – – – – – – – – Brunei Darussalam – – – – – – – – – – – – – – – – – – – – – Bulgaria – – – – – – – – – – – – – – – – – – – – – Burkina Faso 62 95 1.5 46 92 2.0 42 19 2.3 13 31 2.5 31 85 2.8 8x 37x 4.4 x – – – Burundi 64 87 1.4 51 81 1.6 70 41 1.7 35 42 1.2 76 92 1.2 – – – – – – Cabo Verde – – – – – – – – – – – – – – – – – – – – – Cambodia 59 87 1.5 75 98 1.3 42 19 2.3 32 34 1.1 87 98 1.1 27 55 2.1 28 63 2.2 Cameroon 28 89 3.2 19 97 5.1 49 12 4.0 8 36 4.7 60 98 1.6 12x 50x 4.0 x – – – Canada – – – – – – – – – – – – – – – – – – – – – Central African Republic 46 85 1.8 33 87 2.6 45 30 1.5 11 28 2.5 57 90 1.6 12 21 1.7 19 29 1.5 Chad 6 39 6.5 8 61 7.6 41 32 1.3 14 30 2.2 40 74 1.8 6 18 2.9 – – – Chile – – – – – – – – – – – – – – – – – – – – – China – – – – – – – – – – – – – – – – – – – – – Colombia – – – 84 99 1.2 19 7 2.9 47 61 1.3 94 96 1.0 15 32 2.2 – – – Comoros 85 93 1.1 66 93 1.4 38 22 1.7 39 36 0.9 71 95 1.3 – – – – – – Congo 80 99 1.2 78 99 1.3 35 9 3.7 22 37 1.7 94 99 1.1 5x 12x 2.4 x 12 x 27x 2.3 x Cook Islands – – – – – – – – – – – – – – – – – – – – – Costa Rica 99 100 1.0 97 99 1.0 – – – – – – 94 98 1.0 20 54 2.7 – – – Côte d'Ivoire 44 90 2.0 35 91 2.6 38 16 2.5 6 24 3.7 56 87 1.5 – – – – – – Croatia – – – – – – – – – – – – – – – – – – – – – Cuba – – – – – – – – – – – – – – – – – – – – – Cyprus – – – – – – – – – – – – – – – – – – – – – Czech Republic – – – – – – – – – – – – – – – – – – – – – Democratic People's – – – – – – – – – – – – – – – – – – – – – Republic of Korea Democratic Republic 16 38 2.4 66 98 1.5 50 23 2.2 31 42 1.4 79 94 1.2 8 24 2.8 – – – of the Congo Denmark – – – – – – – – – – – – – – – – – – – – – Djibouti – – – – – – – – – – – – – – – – – – – – – Dominica – – – – – – – – – – – – – – – – – – – – – Dominican Republic 65 98 1.5 97 98 1.0 11 4 2.9 47 57 1.2 91 99 1.1 31x 46x 1.5 x 21 x 41x 2.0 x Ecuador 90 96 1.1 82 100 1.2 37 14 2.6 41 64 1.6 97y 97y 1.0 y – – – – – – Egypt 99 100 1.0 82 99 1.2 24 23 1.0 27 23 0.9 95 98 1.0 2x 9x 4.9 x 9 x 28x 3.1 x El Salvador 98x 99x 1.0 x – – – 31x 5x 6.8 x – – – 90y 92y 1.0 y – – – – – – Equatorial Guinea 60 60 1.0 48 88 1.8 28 19 1.5 – – – – – – – – – – – – Eritrea – – – 9 90 10.5 57 27 2.1 42 50 1.2 31y 84y 2.7 y 9 37 4.3 21 43 2.0 Estonia – – – – – – – – – – – – – – – – – – – – – Ethiopia 3x 18x 7.0 x 5 56 12.4 47 28 1.7 18 45 2.5 49y 82y 1.7 y – – – – – – Fiji – – – – – – – – – – – – – – – – – – – – – Finland – – – – – – – – – – – – – – – – – – – – – THE STATE OF THE WORLD’S CHILDREN 2016 166
TABLE 13. DISPARITIES BY HOUSEHOLD WEALTH Oral rehydration salts Comprehensive Comprehensive Skilled attendant at Stunting prevalence in (ORS) treatment for Primary school net knowledge of HIV/AIDS knowledge of HIV/AIDS ++ birth (%) children under 5 (%) children with diarrhoea attendance ratio (%) Females 15–24 (%) Males 15–24 Birth registration (%) 2010–2015* 2010–2015* 2009–2015* (%) 2010–2015* 2009–2014* 2010–2014* 2010–2014* Countries ratio of ratio of ratio of ratio of ratio of ratio of ratio of and areas poorest richest richest to poorest richest richest to poorest richest poorest to poorest richest richest to poorest richest richest to poorest richest richest to poorest richest richest to 20% 20% poorest 20% 20% poorest 20% 20% richest 20% 20% poorest 20% 20% poorest 20% 20% poorest 20% 20% poorest France – – – – – – – – – – – – – – – – – – – – – Gabon 92 86 0.9 74 95 1.3 30 6 5.2 24 19 0.8 92 97 1.1 – – – – – – Gambia 69 75 1.1 46 82 1.8 30 15 1.9 56 58 1.0 47 82 1.7 20 48 2.4 – – – Georgia 99 100 1.0 – – – – – – – – – 92 96 1.0 – – – – – – Germany – – – – – – – – – – – – – – – – – – – – – Ghana 58 88 1.5 42 94 2.2 25 9 2.9 47 50 1.1 63 84 1.3 18 53 2.9 19 49 2.6 Greece – – – – – – – – – – – – – – – – – – – – – Grenada – – – – – – – – – – – – – – – – – – – – – Guatemala – – – 37 96 2.6 66 17 3.8 49 55 1.1 – – – 5x 41x 7.8 x – – – Guinea 38 89 2.4 19 92 4.9 34 15 2.2 25 49 1.9 32 89 2.8 – – – – – – Guinea-Bissau 17 35 2.0 23 82 3.6 42 18 2.3 16 37 2.3 56 76 1.4 6 25 4.3 – – – Guyana 84x 92x 1.1 x – – – 30 10 3.0 – – – 95 98 1.0 37x 72x 2.0 x 25 x 65x 2.6 x Haiti 71 92 1.3 10 78 8.1 31 7 4.7 52 62 1.2 73 96 1.3 18x 41x 2.2 x 28 x 52x 1.9 x Holy See – – – – – – – – – – – – – – – – – – – – – Honduras 92 95 1.0 58 98 1.7 42 8 5.3 63 52 0.8 91 99 1.1 13x 44x 3.4 x – – – Hungary – – – – – – – – – – – – – – – – – – – – – Iceland – – – – – – – – – – – – – – – – – – – – – India 57 86 1.5 24x 85x 3.6 x 51 27 1.9 19x 43x 2.3 x 70x 96x 1.4 x 4x 45x 11.7 x 15 x 55x 3.8 x Indonesia 41 88 2.2 63 98 1.6 48 29 1.7 39 34 0.9 91 97 1.1 – – – – – – Iran (Islamic Republic of) – – – – – – 21 1 17.3 – – – – – – – – – – – – Iraq 98 100 1.0 82 96 1.2 25 22 1.1 19 22 1.1 79 98 1.2 1 8 7.2 – – – Ireland – – – – – – – – – – – – – – – – – – – – – Israel – – – – – – – – – – – – – – – – – – – – – Italy – – – – – – – – – – – – – – – – – – – – – Jamaica 99 100 1.0 97 100 1.0 – – – – – – 98 99 1.0 – – – – – – Japan – – – – – – – – – – – – – – – – – – – – – Jordan 98 100 1.0 99 100 1.0 14 2 7.7 22 21 1.0 97 99 1.0 – – – – – – Kazakhstan 100 100 1.0 100 100 1.0 14 12 1.2 – – – 99 100 1.0 25 44 1.8 13 49 3.8 Kenya 52 89 1.7 31 93 3.0 36 14 2.6 52 55 1.0 69 94 1.4 29x 61x 2.1 x 42 x 68x 1.6 x Kiribati 93x 94x 1.0 x – – – – – – – – – – – – 42x 49x 1.2 x 38 x 51x 1.3 x Kuwait – – – – – – – – – – – – – – – – – – – – – Kyrgyzstan 96 99 1.0 97 99 1.0 18 11 1.7 – – – 99 100 1.0 17x 29x 1.7 x – – – Lao People's Democratic 66 93 1.4 11 91 8.4 61 20 3.1 35 69 2.0 71 97 1.4 6 41 6.5 12 43 3.6 Republic Latvia – – – – – – – – – – – – – – – – – – – – – Lebanon – – – – – – – – – – – – – – – – – – – – – Lesotho 42x 49x 1.2 x 60 94 1.6 46 13 3.4 – – – 89 98 1.1 26x 48x 1.8 x 14 x 45x 3.3 x Liberia 16y 31y 1.9 y 43 89 2.1 35 20 1.8 57 44 0.8 25 65 2.6 14x 29x 2.1 x 17 x 37x 2.2 x Libya – – – – – – – – – – – – – – – – – – – – – Liechtenstein – – – – – – – – – – – – – – – – – – – – – Lithuania – – – – – – – – – – – – – – – – – – – – – Luxembourg – – – – – – – – – – – – – – – – – – – – – Madagascar 72 94 1.3 27 73 2.7 48 44 1.1 11 17 1.6 54y 82y 1.5 y 10 40 4.1 13 41 3.2 Malawi 4y 10y 2.4 y 83 95 1.1 49 34 1.4 60 67 1.1 88 98 1.1 39 50 1.3 48 52 1.1 Malaysia – – – – – – – – – – – – – – – – – – – – – Maldives 92x 94x 1.0 x – – – 22 16 1.4 – – – 94 94 1.0 23x 48x 2.0 x – – – Mali 65 96 1.5 35x 86x 2.5 x 44x 22x 2.0 x 8x 29x 3.5 x 36 85 2.4 9 19 2.0 – – – Malta – – – – – – – – – – – – – – – – – – – – – Marshall Islands 92x 98x 1.1 x – – – – – – – – – – – – 12x 39x 3.3 x 37 x 58x 1.6 x Mauritania 33 84 2.6 27 96 3.6 39 18 2.2 9 33 3.8 45 83 1.9 2 12 7.9 – – – Mauritius – – – – – – – – – – – – – – – – – – – – – Mexico – – – – – – 26 8 3.2 – – – – – – – – – – – – Micronesia (Federated – – – – – – – – – – – – – – – – – – – – – States of) Monaco – – – – – – – – – – – – – – – – – – – – – Mongolia 99 99 1.0 98 99 1.0 25 7 3.9 24 50 2.1 93 98 1.1 17 42 2.5 12 48 4.1 Montenegro 99 99 1.0 99 100 1.0 5 9 0.5 – – – 95 100 1.0 39 51 1.3 33 47 1.4 Morocco – – – 38 96 2.5 28 7 4.2 14 23 1.7 77x 97x 1.3 x – – – – – – Mozambique 42 60 1.4 32 90 2.8 51 24 2.1 41 70 1.7 64 95 1.5 41x 43x 1.1 x 16 x 45x 2.7 x Myanmar 50 96 1.9 51 96 1.9 47 21 2.3 52 75 1.4 81 95 1.2 – – – – – – Namibia 83y 93y 1.1 y 73 98 1.4 31 9 3.6 64 70 1.1 88 97 1.1 61x 69x 1.1 x 55 x 67x 1.2 x Nauru 71x 88x 1.2 x 97x 98x 1.0 x 52x 18x 2.9 x – – – – – – 13x 10x 0.8 x – 25x – Nepal 55 58 1.1 26 93 3.7 55 15 2.2 49 48 1.0 81 82 1.0 12x 49x 4.3 x 30 x 59x 2.0 x Netherlands – – – – – – – – – – – – – – – – – – – – – THE STATE OF THE WORLD’S CHILDREN 2016 167
TABLE 13. DISPARITIES BY HOUSEHOLD WEALTH Oral rehydration salts Comprehensive Comprehensive Skilled attendant at Stunting prevalence in (ORS) treatment for Primary school net knowledge of HIV/AIDS knowledge of HIV/AIDS ++ birth (%) children under 5 (%) children with diarrhoea attendance ratio (%) Females 15–24 (%) Males 15–24 Birth registration (%) 2010–2015* 2010–2015* 2009–2015* (%) 2010–2015* 2009–2014* 2010–2014* 2010–2014* Countries ratio of ratio of ratio of ratio of ratio of ratio of ratio of and areas poorest richest richest to poorest richest richest to poorest richest poorest to poorest richest richest to poorest richest richest to poorest richest richest to poorest richest richest to 20% 20% poorest 20% 20% poorest 20% 20% richest 20% 20% poorest 20% 20% poorest 20% 20% poorest 20% 20% poorest New Zealand – – – – – – – – – – – – – – – – – – – – – Nicaragua – – – – – – – – – – – – – – – – – – – – – Niger 50 89 1.8 12 71 6.0 47 35 1.4 34 49 1.4 35 81 2.3 6 30 5.0 6 42 7.2 Nigeria 7y 65y 9.7 y 6 85 15.0 54 18 3.0 20 53 2.6 28 95 3.3 15 33 2.2 23 43 1.9 Niue – – – – – – – – – – – – 100 100 1.0 – – – – – – Norway – – – – – – – – – – – – – – – – – – – – – Oman – – – – – – – – – – – – – – – – – – – – – Pakistan 5 71 14.3 30 85 2.9 62 23 2.7 34 48 1.4 39 87 2.2 – – – – – – Palau – – – – – – – – – – – – – – – – – – – – – Panama 90 97 1.1 72 100 1.4 – – – – – – 96 97 1.0 – – – – – – Papua New Guinea – – – – – – – – – – – – – – – – – – – – – Paraguay 67y 89y 1.3 y – – – 28 13 2.2 – – – – – – – – – – – – Peru 94y 98y 1.0 y 68 99 1.5 34 4 9.2 23 36 1.6 93y 96y 1.0 y – – – – – – Philippines – – – 42 96 2.3 45 13 3.4 – – – 79x 92x 1.2 x 14x 26x 1.8 x – – – Poland – – – – – – – – – – – – – – – – – – – – – Portugal – – – – – – – – – – – – – – – – – – – – – Qatar – – – – – – – – – – – – – – – – – – – – – Republic of Korea – – – – – – – – – – – – – – – – – – – – – Republic of Moldova 99 100 1.0 98 99 1.0 11 3 4.2 – – – 98 99 1.0 14 47 3.3 13 40 3.1 Romania – – – – – – – – – – – – – – – – – – – – – Russian Federation – – – – – – – – – – – – – – – – – – – – – Rwanda 58 64 1.1 84 97 1.2 49 21 2.3 22 37 1.7 82y 93y 1.1 y – – – – – – Saint Kitts and Nevis – – – – – – – – – – – – – – – – – – – – – Saint Lucia – – – – – – – – – – – – – – – – – – – – – Saint Vincent and the – – – – – – – – – – – – – – – – – – – – – Grenadines Samoa 47 77 1.6 72 94 1.3 – – – – – – 85y 91y 1.1 y 3x 3x 1.0 x 3 x 9x 2.7 x San Marino – – – – – – – – – – – – – – – – – – – – – Sao Tome and Principe 74x 86x 1.1 x – – – 38 18 2.2 – – – 88 97 1.1 27x 56x 2.0 x 39 x 55x 1.4 x Saudi Arabia – – – – – – – – – – – – – – – – – – – – – Senegal 51 93 1.8 30 86 2.8 29 9 3.3 24 24 1.0 50 89 1.8 – – – – – – Serbia 97 100 1.0 98 95 1.0 14 4 3.3 – – – 97 100 1.0 28 69 2.4 28 66 2.4 Seychelles – – – – – – – – – – – – – – – – – – – – – Sierra Leone 77 80 1.0 51 84 1.6 43 28 1.5 87 88 1.0 62 92 1.5 14 36 2.6 – – – Singapore – – – – – – – – – – – – – – – – – – – – – Slovakia – – – – – – – – – – – – – – – – – – – – – Slovenia – – – – – – – – – – – – – – – – – – – – – Solomon Islands – – – 74x 95x 1.3 x 34x 22x 1.6 x – – – 58x,y 78x,y 1.3 x,y 17x 37x 2.1 x 35 x 50x 1.5 x Somalia 1x 7x 6.6 x – – – 52x 25x 2.0 x 7x 31x 4.8 x 4x 50x 13.2 x 1x 8x 13.5 x – – – South Africa – – – – – – – – – – – – – – – – – – – – – South Sudan 21 57 2.7 8 41 5.1 31 27 1.2 27 52 1.9 10 50 5.1 3 18 6.1 – – – Spain – – – – – – – – – – – – – – – – – – – – – Sri Lanka 97x 98x 1.0 x 97x 99x 1.0 x 19 10 2.0 – – – – – – – – – – – – State of Palestine 100 99 1.0 100 99 1.0 8 7 1.1 23 31 1.3 99 99 1.0 5 10 2.1 – – – Sudan 26 98 3.8 6 59 10.5 42 15 2.8 21 16 0.7 48 96 2.0 1 11 13.6 – – – Suriname 98 100 1.0 84 95 1.1 13 6 2.4 – – – 92 96 1.1 26 52 2.0 – – – Swaziland 39 73 1.9 65 94 1.4 42 14 3.0 58 60 1.0 95 99 1.0 49 72 1.5 44 64 1.5 Sweden – – – – – – – – – – – – – – – – – – – – – Switzerland – – – – – – – – – – – – – – – – – – – – – Syrian Arab Republic 93x 99x 1.1 x – – – – – – 45x 59x 1.3 x 92x 99x 1.1 x 4x 10x 2.9 x – – – ajikistan 86 90 1.0 74 96 1.3 32 21 1.5 53 62 1.2 95 99 1.0 – – – – – – T Thailand 99y 100y 1.0 y 98 100 1.0 23 11 2.2 71 53 0.7 94 97 1.0 48 59 1.2 – – – The former Yugoslav 99 100 1.0 98 98 1.0 7 2 3.6 – – – 96 99 1.0 9x 45x 5.0 x – – – Republic of Macedonia Timor-Leste 50 56 1.1 10 69 6.9 59 39 1.5 70 71 1.0 60 84 1.4 9 16 1.8 11 35 3.0 Togo 67 97 1.5 27 95 3.6 33 11 3.2 28 25 0.9 80 97 1.2 18 42 2.3 20 55 2.7 Tonga 92 96 1.1 97 99 1.0 7 10 0.7 – – – 94y 94y 1.0 y 11 16 1.4 13 14 1.1 Trinidad and Tobago 96x 99x 1.0 x – – – – – – – – – 95x 98x 1.0 x 48x 62x 1.3 x – – – Tunisia 98 100 1.0 94 100 1.1 16 8 2.0 – – – 96 98 1.0 10 29 2.8 – – – Turkey 98y 99y 1.0 y 91 100 1.1 18 4 4.3 – – – 87x,y 97x,y 1.1 x,y – – – – – – Turkmenistan 94x 97x 1.0 x 99x 100x 1.0 x 21x 13x 1.7 x – – – 99x 99x 1.0 x – – – – – – Tuvalu 39x 71x 1.8 x – – – 8x 13x 0.6 x – – – 99x,y 100x,y 1.0 x,y 34x 39x 1.2 x – 67x – Uganda 27 44 1.6 43 88 2.0 37 21 1.8 43 45 1.1 79 92 1.2 20x 47x 2.3 x 28 x 47x 1.6 x THE STATE OF THE WORLD’S CHILDREN 2016 168
TABLE 13. DISPARITIES BY HOUSEHOLD WEALTH Oral rehydration salts Comprehensive Comprehensive Skilled attendant at Stunting prevalence in (ORS) treatment for Primary school net knowledge of HIV/AIDS knowledge of HIV/AIDS ++ birth (%) children under 5 (%) children with diarrhoea attendance ratio (%) Females 15–24 (%) Males 15–24 Birth registration (%) 2010–2015* 2010–2015* 2009–2015* (%) 2010–2015* 2009–2014* 2010–2014* 2010–2014* Countries ratio of ratio of ratio of ratio of ratio of ratio of ratio of and areas poorest richest richest to poorest richest richest to poorest richest poorest to poorest richest richest to poorest richest richest to poorest richest richest to poorest richest richest to 20% 20% poorest 20% 20% poorest 20% 20% richest 20% 20% poorest 20% 20% poorest 20% 20% poorest 20% 20% poorest Ukraine 100 99 1.0 99 100 1.0 – – – – – – 100 100 1.0 41 53 1.3 40 54 1.3 United Arab Emirates – – – – – – – – – – – – – – – – – – – – – United Kingdom – – – – – – – – – – – – – – – – – – – – – United Republic of Tanzania 4 56 12.7 31 90 2.9 48 26 1.8 41 38 0.9 68 95 1.4 39 55 1.4 34 56 1.7 United States – – – – – – – – – – – – – – – – – – – – – Uruguay – – – – – – – – – – – – – – – – – – – – – Uzbekistan 100x 100x 1.0 x 100x 100x 1.0 x 21x 15x 1.4 x – – – 93x 96x 1.0 x 25x 33x 1.3 x – – – Vanuatu 33y 59y 1.8 y 77 95 1.2 40 16 2.4 – – – 75y 80y 1.1 y 9x 23x 2.7 x – – – Venezuela (Bolivarian – – – – – – – – – – – – 86x 99x 1.2 x – – – – – – Republic of) Viet Nam 91 98 1.1 73 100 1.4 41 6 6.7 – – – 94 99 1.0 30 65 2.2 – – – Yemen 17 56 3.3 19 81 4.2 59 26 1.4 27 21 0.8 56 90 1.6 0x 4x – – – – Zambia 5 29 6.0 45 94 2.1 47 28 1.7 59 68 1.1 75 97 1.3 24x 48x 2.0 x 24 x 51x 2.1 x Zimbabwe 17 68 3.9 70 96 1.4 33 15 2.2 37 45 1.2 90 98 1.1 47 65 1.4 43 67 1.6 SUMMARY Sub-Saharan Africa 28 68 2.4 29 84 2.9 46 22 2.1 29 45 1.5 55 91 1.7 16 34 2.1 – – – Eastern and 31 61 1.9 32 80 2.5 45 26 1.8 36 48 1.3 64 89 1.4 – – – – – – Southern Africa West and Central Africa 27 70 2.6 27 88 3.2 47 19 2.5 24 45 1.8 46 91 2.0 12 31 2.5 21 44 2.1 Middle East and North Africa 77 95 1.2 62 90 1.5 28 15 1.8 23 23 1.0 78 97 1.2 – – – – – – South Asia 46 79 1.7 24‡ 81‡ 3.3 ‡ 52 25 2.0 49‡ 60‡ 1.2 ‡ 65 93 1.4 – – – – – – East Asia and Pacific 57** 91** 1.6 ** 61** 97** 1.6 ** 45** 20** 2.2 ** 44** 42** 1.0 ** 90** 97** 1.1 ** – – – – – – Latin America and Caribbean – – – – – – 22 7 3.3 – – – – – – – – – – – – CEE/CIS – – – 93 99 1.1 19r 9r 2.3 r – – – – – – – – – – – – Least developed countries 34 63 1.9 32 81 2.6 47 24 1.9 38 49 1.3 61 88 1.4 10 26 2.6 – – – World 57** 84** 1.7 ** 43‡** 88‡** 2.1 ‡** 43** 21** 2.1 ** 34‡** 45‡** 1.3 ‡** 67** 93** 1.4 ** – – – – – – For a complete list of countries and areas in the regions, subregions and country categories, see page 112 or visit . It is not advisable to compare data from consecutive editions of The State of the World’s Children. DEFINITIONS OF THE INDICATORS MAIN DATA SOURCES Birth registration – Percentage of children under age 5 who were registered Birth registration – Demographic and Health Surveys (DHS), Multiple Indicator Cluster Surveys at the moment of the survey. The numerator of this indicator includes children (MICS), other national surveys, censuses and vital registration systems. reported to have a birth certificate, regardless of whether or not it was seen by Skilled attendant at birth – DHS, MICS and other nationally representative sources. the interviewer, and those without a birth certificate whose mother or Stunting prevalence in children under 5 – DHS, MICS, other national household surveys, WHO and caregiver says the birth has been registered. UNICEF. Skilled attendant at birth – Percentage of births attended by skilled health Oral rehydration salts (ORS) treatment for children with diarrhoea – DHS, MICS and other personnel (doctor, nurse or midwife). national household surveys. Stunting prevalence in children under 5 – Percentage of children aged Primary school net attendance ratio – DHS, MICS and other national household surveys. 0–59 months who are below minus two standard deviations from median height-for-age of the WHO Child Growth Standards. Comprehensive knowledge of HIV – AIDS Indicator Surveys (AIS), DHS, MICS, and other national Diarrhoea treatment with oral rehydration salts (ORS) – Percentage of household surveys; DHS STATcompiler, www.statcompiler.com. children under age 5 who had diarrhoea in the two weeks preceding the Italicized data are from different sources than the data presented for the same indicators in other tables survey and who received oral rehydration salts (ORS packets or pre-packaged of the report: Table 2 (Nutrition – Stunting prevalence), Table 3 (Health – Diarrhoea treatment), Table 4 ORS fluids). (HIV/AIDS – Comprehensive knowledge of HIV), Table 5 (Education – Primary school participation), Primary school net attendance ratio – Number of children attending Table 8 (Women – Skilled attendant at birth) and Table 9 (Child protection – Birth registration). primary or secondary school who are of official primary school age, expressed as a percentage of the total number of children of official primary school age. Because of the inclusion of primary-school-aged children attending secondary NOTES school, this indicator can also be referred to as a primary adjusted net - Data not available. attendance ratio. x Data refer to years or periods other than those specified in the column heading. Such data are not Comprehensive knowledge of HIV – Percentage of young men and women included in the calculation of regional and global averages, with the exception of 2005–2006 data on (aged 15–24) who correctly identify the two major ways of preventing the primary attendance from India. Estimates from data years prior to 2000 are not displayed. sexual transmission of HIV (using condoms and limiting sex to one faithful, uninfected partner), who reject the two most common local misconceptions y Data differ from the standard definition or refer to only part of a country. If they fall within the noted about HIV transmission and who know that a healthy-looking person can be reference period, such data are included in the calculation of regional and global averages. HIV-positive. ++ Changes in the definition of birth registration were made from the second and third rounds of MICS (MICS2 and MICS3) to the fourth round (MICS4). In order to allow for comparability with later rounds, data from MICS2 and MICS3 on birth registration were recalculated according to the MICS4 indicator definition. Therefore, the recalculated data presented here may differ from estimates included in MICS2 and MICS3 national reports. * Data refer to the most recent year available during the period specified in the column heading. ** Excludes China. ‡ Excludes India. r Excludes the Russian Federation. THE STATE OF THE WORLD’S CHILDREN 2016 169
TABLE 14. EARLY CHILDHOOD DEVELOPMENT Attendance in early childhood Learning materials at home ++ 2005–2014* education Adult support for learning Father’s Children left in inadequate care ++ Countries 2005–2014* 2005–2014* support for Children’s books Playthings 2005–2014* ++ and areas poorest richest poorest richest learning poorest richest poorest richest poorest richest total male female 20% 20% total male female 20% 20% 2005–2014* total 20% 20% total 20% 20% total male female 20% 20% Afghanistan 1 1 1 0 4 73 74 73 72 80 62 2 1 5 53 52 57 40 42 39 43 27 Albania 40 39 42 26 60 86 85 87 68 96 53 32 16 52 53 57 48 13 14 11 9 16 Algeria 17 17 16 7 31 78 79 78 64 92 79 11 3 23 35 32 36 6 6 5 6 6 Argentina 63 61 66 46 85 84 83 85 73 95 57 61 40 83 61 58 63 8 9 8 10 5 Bangladesh 13 13 14 12 18 78 78 78 64 94 10y 9 2 23 60 57 60 12 11 12 14 12 Barbados 90 88 91 90p 97p 97 97 97 100p 100p 46 85 83 89 76 68 77 1 2 1 0 3 Belarus 88 86 89 75 91 96 94 97 90 99 68 92 83 96 79 77 79 4 4 4 4 5 Belize 32 30 34 16 59 86 88 83 73 94 50 40 17 73 57 55 58 2 3 2 4 1 Benin 13 – – – – 28 – – – – 5y 1 – – 48 – – 34 – – – – Bhutan 10 10 10 3 27 54 52 57 40 73 51 6 1 24 52 36 60 14 13 15 17 7 Bosnia and Herzegovina 13 12 14 2 31 95 95 96 87 100 76 56 39 73 56 58 60 2 2 2 3 1 Botswana 18 – – – – – – – – – – – – – – – – – – – – – Brazil 70y – – – – – – – – – – – – – – – – – – – – – Burkina Faso 2 3 1 0 9 14 14 14 12 26 24 – – – – – – – – – – – Burundi 5 5 5 4 10 34 35 34 32 38 20 – – – – – – – – – – – Cambodia 15y 12y 17y 7y 38y 59y 57y 62y 48y 73y 9y 4y 1y 12y 34y 20y 53y 10y 10y 10y 16y 4y Cameroon 28 – – – – 44 – – – – 4y 4 – – 53 – – 34 – – – – Central African Republic 5 5 6 2 17 74 74 74 70 78 42 1 0 3 49 41 51 61 60 62 58 60 Chad 5 5 4 1 16 70 69 70 64 71 29 1 0 2 43 38 50 56 57 56 58 56 Colombia 37y – – – – – – – – – – – – – – – – – – – – – Congo 36 – – – – 59 – – – – 6y 3 – – 51 – – 42 – – – – Costa Rica 18 17 18 8 40 68 69 66 54 88 52 37 13 70 73 68 74 4 4 4 6 3 Côte d'Ivoire 5 5 5 1 15 50 50 51 55 57 40 5 3 13 39 44 35 59 60 58 62 51 Croatia 72y – – – – – – – – – – – – – – – – – – – – – Cuba 76 75 77 – – 89 89 90 – – 18y 48 – – 78 – – 4 4 4 – – Democratic People's 98 98 97 – – 91 88 93 – – 75 79 – – 47 – – 17 17 16 – – Republic of Korea Democratic Republic 7y 7y 7y 1y 20y 52y 55y 48y 45y 64y 4y 1y 0y 2y 27y 18y 49y 49y 50y 48y 57y 29y of the Congo Djibouti 14 12 16 – – 37y 38y 35y – – 28y 15 – – 24 – – 8 8 8 – – Dominican Republic 40 – – – – 58 – – – – 6y 10 – – 57 – – 5 – – – – Egypt 47y 48y 47y 34y 50y – – – – – – – – – – – – 4 4 4 7 2 El Salvador 25 – – – – 59 – – – – 8y 18 – – 62 – – 4 – – – – Gambia 18 17 19 12 32 48 49 47 50 55 21 1 0 4 42 28 50 21 22 19 25 18 Georgia 66 65 67 53 83 84 84 83 67 94 33 51y 26y 69y 38 41 41 8y 9y 8y 4y 10y Ghana 68 65 72 42 97 40 38 42 23 78 30 6 1 23 41 31 51 21 21 21 27 15 Guinea-Bissau 13 – – – – 34 – – – – 0y 1 – – 31 – – 31 – – – – Guyana 61 – – – – 87 – – – – 16y 47 – – 69 – – 5 – – – – Honduras 19 17 21 13 28 48 47 49 28 75 59 11 1 34 78 74 81 4 5 4 8 2 Indonesia 17 16 18 – – – – – – – – – – – – – – – – – – – Iran (Islamic Republic of) 20y 19y 22y – – 70y 69y 70y – – 60y 36y – – 67y – – 15y 15y 15y – – Iraq 4 4 4 1 10 58 58 59 40 78 55 5 1 16 34 34 32 8 8 7 9 8 Jamaica 92 92 91 88 100 88 86 90 76 86 28 55 34 73 61 64 56 2 2 2 2 1 Jordan 22y 21y 23y 11y 39y 82y 81y 83y 75y 87y 72y 23y 11y 40y 70y 68y 74y 9y 9y 9y 11y 8y Kazakhstan 37 36 38 19 61 92 92 91 84 96 49 48 24 76 45 40 49 4 4 4 5 4 Kyrgyzstan 23 23 23 12 50 72 74 70 63 73 3y 27 15 54 59 63 54 5 5 4 6 5 Lao People's Democratic 23 21 25 5 73 57 58 57 42 87 52 5 1 24 41 29 50 14 15 13 20 8 Republic Lebanon 62 63 60 – – 56y 58y 54y – – 74y 29 – – 16y – – 9 8 10 – – Malawi 39 37 41 26 67 29 29 30 22 44 3y 1 0 6 45 35 66 37 37 37 39 28 Mali 10 10 10 1 40 29 27 30 28 44 14 0 0 2 40 33 49 33 33 33 33 36 Mauritania 14 14 14 2 41 55 54 55 55 64 28 – – – 40 42 39 26 27 26 24 25 Mongolia 68 – – – – 60 – – – – 12y 33 – – 56 – – 10 – – – – Montenegro 40 39 42 7 66 98 97 99 93 98 45y 73 48 87 60 61 66 3 3 3 2 3 Morocco 39 36 41 6 78 35y 34y 35y 16y 59y 58y 21y 9y 52y 14y 19y 7y 11 – – – – Mozambique – – – – – 47 45 48 48 50 20 3 2 10 – – – 33 33 32 – – Myanmar 23 23 23 8 46 58y 58y 58y 42y 76y 44y – – – – – – – – – – – 170 THE STATE OF THE WORLD’S CHILDREN 2016
TABLE 14. EARLY CHILDHOOD DEVELOPMENT Attendance in early childhood Learning materials at home ++ 2005–2014* education Adult support for learning Father’s Children left in inadequate care ++ Countries 2005–2014* 2005–2014* support for Children’s books Playthings 2005–2014* poorest richest poorest richest learning ++ poorest richest poorest richest poorest richest and areas total male female 20% 20% total male female 20% 20% 2005–2014* total 20% 20% total 20% 20% total male female 20% 20% Nepal 51 52 49 41 84 67 70 64 51 90 10y 5 1 16 59 60 60 21 20 21 30 12 Nigeria 43 42 43 10 84 65 66 64 48 89 37 6 0 19 38 29 48 40 40 40 40 34 Oman 29 – – – – 81 – – – – 22y 25 – – 75 – – 45 – – – – Panama 37 38 35 28 67 74 73 74 55 89 45 26 7 59 69 67 68 3 3 2 6 1 Qatar 41 41 41 – – 88 89 88 – – 85 40 – – 55 – – 12 12 11 – – Republic of Moldova 71 74 67 50 88 89 86 92 81 95 47 68 33 87 68 75 69 6 6 6 9 5 Saint Lucia 85 87 84 – – 93 89 96 – – 50 68 – – 59 – – 5 5 5 – – Sao Tome and Principe 36 – – – – 63 – – – – 3y 6 – – 65 – – 16 – – – – Senegal 22y 23y 21y 7y 43y – – – – – – – – – – – – – – – – – Serbia 50 52 49 9 82 96 95 96 87 98 37y 72 44 83 75 78 76 1 2 1 3 2 Sierra Leone 14 13 15 5 42 54 53 55 45 79 42 2 0 10 35 24 50 32 33 32 29 28 Somalia 2 2 2 1 6 79 80 79 76 85 48 – – – – – – – – – – – South Africa 37y – – – – – – – – – – – – – – – – – – – – – South Sudan 6 6 6 2 13 – – – – – – – – – – – – – – – – – State of Palestine 26 27 26 21 38 78 77 78 69 87 12y 20 13 31 69 64 72 14 14 15 15 12 Sudan 22 – – – – – – – – – – 2 – – 46 – – – – – – – Suriname 34 33 35 16 63 73 71 75 56 91 26 25 4 61 59 61 60 7 7 7 9 8 Swaziland 30 – – – – 39 – – – – 2y 6 – – 67 – – 17 – – – – Syrian Arab Republic 8 8 7 4 18 70 70 69 52 84 62 30 12 53 52 52 51 17 17 17 22 15 Tajikistan 6 – – – – 74 73 74 56 86 23 17 4 33 46 43 44 13 13 12 15 11 Thailand 84 84 85 85 82 93 92 93 87 96 35 43 24 71 71 69 70 5 5 4 7 2 The former Yugoslav 22 25 19 0 56 92 92 91 81 96 71 52 18 81 71 70 79 5 5 5 11 1 Republic of Macedonia Togo 26y 26y 26y 15y 52y 25y 25y 25y 20y 42y 21y 1y 0y 3y 34y 22y 48y 29y 26y 33y 36y 26y Trinidad and Tobago 75 74 76 65 87 98 98 98 96 100 63 81 66 93 65 63 72 1 1 1 2 0 Tunisia 44 42 47 13 81 71 68 74 44 90 71 18 3 40 53 46 56 13 13 14 18 9 Turkmenistan 24 23 26 10 64 93 93 92 92 96 66 42 24 65 61 64 48 15 15 16 18 10 Ukraine 52 54 50 30 68 98 97 98 95 99 71 91 92 92 52 61 51 7 6 7 11 5 Uruguay 81 83 80 – – 93 94 91 – – 66y 59 – – 75 – – 3 3 3 – – Uzbekistan 20 20 19 5 46 91 91 90 83 95 54 43 32 59 67 74 62 5 5 5 6 7 Venezuela (Bolivarian 66y – – – – – – – – – – – – – – – – – – – – – Republic of) Viet Nam 71 74 69 53 86 76 76 76 52 96 15y 26 6 58 52 44 54 7 6 8 14 2 Yemen 3 3 3 0 8 33 34 32 16 56 37 10 4 31 49 45 49 34 36 33 46 22 Zimbabwe 22 20 23 17 34 43 43 43 35 59 3y 3 1 12 62 48 74 19 19 18 25 7 SUMMARY Sub-Saharan Africa 25 − − − − 51 − − − − 24 4 − − − − − − − − − − Eastern and − − − − − − − − − − − − − − − − − − − − − − Southern Africa West and Central 26 28 21 8 53 52 56 48 43 72 25 4 0 13 38 28 48 41 42 42 44 34 Africa Middle East and 23 25 21 13 35 63 60 66 − − 60 16 − − 45 − − 11 11 11 14 8 North Africa South Asia − − − − − − − − − − − − − − − − − − − − − − East Asia and Pacific 34** 36** 32** − − − − − − − − − − − − − − − − − − − Latin America and 60 − − − − − − − − − − − − − − − − − − − − − Caribbean CEE/CIS − − − − − − − − − − − − − − − − − − − − − − Least developed 13 13 12 7 25 57 57 63 50 72 21 − − − − − − − − − − − countries World − − − − − − − − − − − − − − − − − − − − − − For a complete list of countries and areas in the regions, subregions and country categories, see page 112 or visit . It is not advisable to compare data from consecutive editions of The State of the World’s Children. THE STATE OF THE WORLD’S CHILDREN 2016 171
DEFINITIONS OF THE INDICATORS MAIN DATA SOURCES Attendance in early childhood education – Percentage of children 36–59 Attendance in early childhood education – Demographic and Health Surveys (DHS), Multiple months old who are attending an early childhood education programme. Indicator Cluster Surveys (MICS), and other national surveys. Adult support for learning – Percentage of children 36–59 months old with Adult support for learning – DHS, MICS and other national surveys. whom an adult has engaged in four or more of the following activities to Father’s support for learning – DHS, MICS and other national surveys. promote learning and school readiness in the past 3 days: a) reading books to Learning materials at home: Children’s books – DHS, MICS and other national surveys. the child, b) telling stories to the child, c) singing songs to the child, d) taking the child outside the home, e) playing with the child, and f) spending time with the Learning materials at home: Playthings – DHS, MICS and other national surveys. child naming, counting or drawing things. Children left in inadequate care – DHS, MICS and other national surveys. Father’s support for learning – Percentage of children 36–59 months old whose father has engaged in one or more of the following activities to promote learning and school readiness in the past 3 days: a) reading books to the child, b) NOTES telling stories to the child, c) singing songs to the child, d) taking the child − Data not available. outside the home, e) playing with the child, and f) spending time with the child y Data differ from the standard definition or refer to only part of a country. If they fall within the naming, counting or drawing things. noted reference period, such data are included in the calculation of regional and global averages. Learning materials at home: Children’s books – Percentage of children p Based on small denominators (typically 25–49 unweighted cases). No data based on fewer than 25 0–59 months old who have three or more children’s books at home. unweighted cases are displayed. Learning materials at home: Playthings – Percentage of children 0–59 * Data refer to the most recent year available during the period specified in the column heading. months old with two or more of the following playthings at home: household objects or objects found outside (sticks, rocks, animals, shells, leaves etc.), ++ Changes in the definitions of several ECD indicators were made between the third and fourth round homemade toys or toys that came from a store. of MICS (MICS3 and MICS4). In order to allow for comparability with MICS4, data from MICS3 Children left in inadequate care – Percentage of children 0–59 months old for the adult support for learning, father’s support for learning and learning materials at home left alone or in the care of another child younger than 10 years of age for more (playthings) indicators were recalculated according to MICS4 indicator definitions. Therefore, the than one hour at least once in the past week. recalculated data presented here will differ from estimates reported in MICS3 national reports. 172 THE STATE OF THE WORLD’S CHILDREN 2016
“As we look around the world today, we’re confronted with an uncomfortable but undeniable truth: Millions of children’s lives are blighted, for no other reason than the country, the community, the gender or the circumstances into which they are born. Unless we accelerate the pace of our progress in reaching them, the futures of millions of disadvantaged and vulnerable children – and therefore the future of their societies – will be imperilled.” Anthony Lake, Executive Director, UNICEF Published by UNICEF Division of Communication 3 United Nations Plaza New York, NY 10017, USA ISBN: 978-92-806-4838-6 pubdoc@unicef.org www.unicef.org © United Nations Children’s Fund (UNICEF) June 2016 174 THE STATE OF THE WORLD’S CHILDREN 2016