
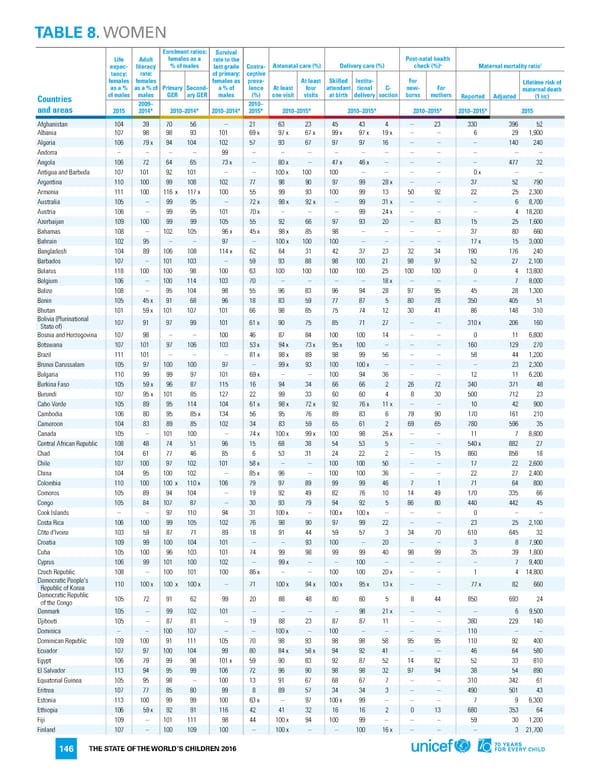
TABLE 8. WOMEN Enrolment ratios: Survival Life Adult females as a rate to the Post-natal health + † expec- literacy % of males last grade Contra- Antenatal care (%) Delivery care (%) check (%) Maternal mortality ratio tancy: rate: of primary: ceptive females females females as preva- At least Skilled Institu- For Lifetime risk of as a % as a % of Primary Second- a % of lence At least four attendant tional C- new- For maternal death Countries of males males GER ary GER males (%) one visit visits at birth delivery section borns mothers Reported Adjusted (1 in:) and areas 2009– 2010– 2015 2014* 2010–2014* 2010–2014* 2015* 2010–2015* 2010–2015* 2010–2015* 2010–2015* 2015 Afghanistan 104 39 70 56 – 21 63 23 45 43 4 – 23 330 396 52 Albania 107 98 98 93 101 69x 97x 67x 99x 97x 19x – – 6 29 1,900 Algeria 106 79x 94 104 102 57 93 67 97 97 16 – – – 140 240 Andorra – – – – 99 – – – – – – – – – – – Angola 106 72 64 65 73x – 80x – 47x 46x – – – – 477 32 Antigua and Barbuda 107 101 92 101 – – 100x 100 100 – – – – 0x – – Argentina 110 100 99 108 102 77 98 90 97 99 28x – – 37 52 790 Armenia 111 100 116 x 117x 100 55 99 93 100 99 13 50 92 22 25 2,300 Australia 105 – 99 95 – 72x 98x 92x – 99 31x – – – 6 8,700 Austria 106 – 99 95 101 70x – – – 99 24x – – – 4 18,200 Azerbaijan 109 100 99 99 105 55 92 66 97 93 20 – 83 15 25 1,600 Bahamas 108 – 102 105 96x 45x 98x 85 98 – – – – 37 80 660 Bahrain 102 95 – – 97 – 100x 100 100 – – – – 17x 15 3,000 Bangladesh 104 89 106 108 114x 62 64 31 42 37 23 32 34 190 176 240 Barbados 107 – 101 103 – 59 93 88 98 100 21 98 97 52 27 2,100 Belarus 118 100 100 98 100 63 100 100 100 100 25 100 100 0 4 13,800 Belgium 106 – 100 114 103 70 – – – – 18x – – – 7 8,000 Belize 108 – 95 104 98 55 96 83 96 94 28 97 95 45 28 1,300 Benin 105 45x 91 68 96 18 83 59 77 87 5 80 78 350 405 51 Bhutan 101 59x 101 107 101 66 98 85 75 74 12 30 41 86 148 310 Bolivia (Plurinational 107 91 97 99 101 61x 90 75 85 71 27 – – 310x 206 160 State of) Bosnia and Herzegovina 107 98 – – 100 46 87 84 100 100 14 – – 0 11 6,800 Botswana 107 101 97 106 103 53x 94x 73x 95x 100 – – – 160 129 270 Brazil 111 101 – – – 81x 98x 89 98 99 56 – – 58 44 1,200 Brunei Darussalam 105 97 100 100 97 – 99x 93 100 100x – – – – 23 2,300 Bulgaria 110 99 99 97 101 69x – – 100 94 36 – – 12 11 6,200 Burkina Faso 105 59x 96 87 115 16 94 34 66 66 2 26 72 340 371 48 Burundi 107 95x 101 85 127 22 99 33 60 60 4 8 30 500 712 23 Cabo Verde 105 89 95 114 104 61x 98x 72x 92 76x 11x – – 10 42 900 Cambodia 106 80 95 85x 134 56 95 76 89 83 6 79 90 170 161 210 Cameroon 104 83 89 85 102 34 83 59 65 61 2 69 65 780 596 35 Canada 105 – 101 100 – 74x 100x 99x 100 98 26x – – 11 7 8,800 Central African Republic 108 48 74 51 96 15 68 38 54 53 5 – – 540x 882 27 Chad 104 61 77 46 85 6 53 31 24 22 2 – 15 860 856 18 Chile 107 100 97 102 101 58x – – 100 100 50 – – 17 22 2,600 China 104 95 100 102 – 85x 96 – 100 100 36 – – 22 27 2,400 Colombia 110 100 100 x 110x 106 79 97 89 99 99 46 7 1 71 64 800 Comoros 105 89 94 104 – 19 92 49 82 76 10 14 49 170 335 66 Congo 105 84 107 87 – 30 93 79 94 92 5 86 80 440 442 45 Cook Islands – – 97 110 94 31 100x – 100x 100x – – – 0 – – Costa Rica 106 100 99 105 102 76 98 90 97 99 22 – – 23 25 2,100 Côte d'Ivoire 103 59 87 71 89 18 91 44 59 57 3 34 70 610 645 32 Croatia 109 99 100 104 101 – – 93 100 – 20 – – 3 8 7,900 Cuba 105 100 96 103 101 74 99 98 99 99 40 98 99 35 39 1,800 Cyprus 106 99 101 100 102 – 99x – – 100 – – – – 7 9,400 Czech Republic 108 – 100 101 100 86x – – 100 100 20x – – 1 4 14,800 Democratic People's 110 100x 100 x 100x – 71 100x 94x 100x 95x 13x – – 77x 82 660 Republic of Korea Democratic Republic 105 72 91 62 99 20 88 48 80 80 5 8 44 850 693 24 of the Congo Denmark 105 – 99 102 101 – – – – 98 21x – – – 6 9,500 Djibouti 105 – 87 81 – 19 88 23 87 87 11 – – 380 229 140 Dominica – – 100 107 – – 100x – 100 – – – – 110 – – Dominican Republic 109 100 91 111 105 70 98 93 98 98 58 95 95 110 92 400 Ecuador 107 97 100 104 99 80 84x 58x 94 92 41 – – 46 64 580 Egypt 106 79 99 98 101x 59 90 83 92 87 52 14 82 52 33 810 El Salvador 113 94 95 99 106 72 96 90 98 98 32 97 94 38 54 890 Equatorial Guinea 105 95 98 – 100 13 91 67 68 67 7 – – 310 342 61 Eritrea 107 77 85 80 99 8 89 57 34 34 3 – – 490 501 43 Estonia 113 100 99 99 100 63x – 97 100x 99 – – – 7 9 6,300 Ethiopia 106 59x 92 91 116 42 41 32 16 16 2 0 13 680 353 64 Fiji 109 – 101 111 98 44 100x 94 100 99 – – – 59 30 1,200 Finland 107 – 100 109 100 – 100x – – 100 16x – – – 3 21,700 THE STATE OF THE WORLD’S CHILDREN 2016 146
 70 Years for Every Child Page 164 Page 166