
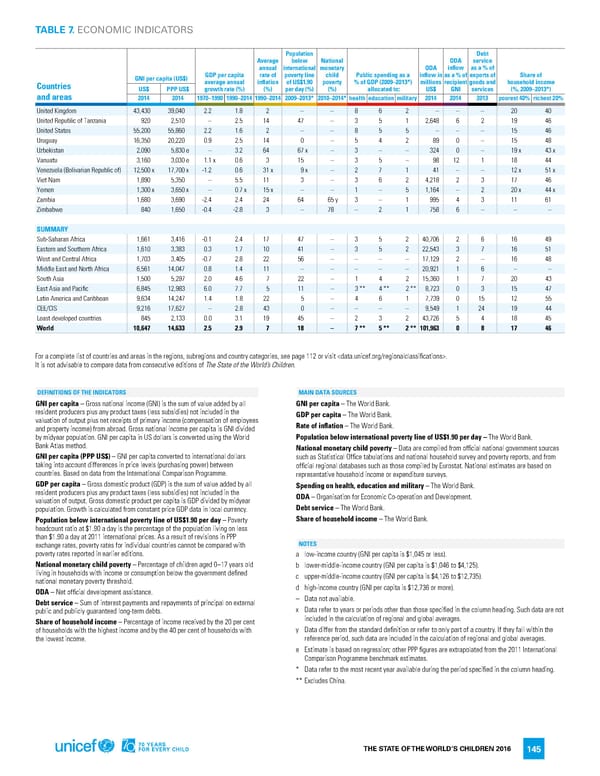
TABLE 7. ECONOMIC INDICATORS Population Debt Average below National ODA service annual international monetary ODA inflow as a % of GNI per capita (US$) GDP per capita rate of poverty line child Public spending as a inflow in as a % of exports of Share of Countries average annual inflation of US$1.90 poverty % of GDP (2009–2013*) millions recipient goods and household income US$ PPP US$ growth rate (%) (%) per day (%) (%) allocated to: US$ GNI services (%, 2009–2013*) and areas 2014 2014 1970–1990 1990–2014 1990–2014 2009–2013* 2010–2014* health education military 2014 2014 2013 poorest 40% richest 20% United Kingdom 43,430 39,040 2.2 1.8 2 – – 8 6 2 – – – 20 40 United Republic of Tanzania 920 2,510 – 2.5 14 47 – 3 5 1 2,648 6 2 19 46 United States 55,200 55,860 2.2 1.6 2 – – 8 5 5 – – – 15 46 Uruguay 16,350 20,220 0.9 2.5 14 0 – 5 4 2 89 0 – 15 48 Uzbekistan 2,090 5,830 e – 3.2 64 67x – 3 – – 324 0 – 19x 43x Vanuatu 3,160 3,030 e 1.1 x 0.6 3 15 – 3 5 – 98 12 1 18 44 Venezuela (Bolivarian Republic of) 12,500 x 17,700 x -1.2 0.6 31x 9x – 2 7 1 41 – – 12x 51x Viet Nam 1,890 5,350 – 5.5 11 3 – 3 6 2 4,218 2 3 17 46 Yemen 1,300 x 3,650 x – 0.7 x 15x – – 1 – 5 1,164 – 2 20x 44x Zambia 1,680 3,690 -2.4 2.4 24 64 65y 3 – 1 995 4 3 11 61 Zimbabwe 840 1,650 -0.4 -2.8 3 – 78 – 2 1 758 6 – – – SUMMARY Sub-Saharan Africa 1,661 3,416 -0.1 2.4 17 47 – 3 5 2 40,706 2 6 16 49 Eastern and Southern Africa 1,610 3,383 0.3 1.7 10 41 – 3 5 2 22,543 3 7 16 51 West and Central Africa 1,703 3,405 -0.7 2.8 22 56 – – – – 17,129 2 – 16 48 Middle East and North Africa 6,561 14,047 0.8 1.4 11 – – – – – 20,921 1 6 – – South Asia 1,500 5,297 2.0 4.6 7 22 – 1 4 2 15,360 1 7 20 43 East Asia and Pacific 6,845 12,983 6.0 7.7 5 11 – 3** 4** 2** 8,723 0 3 15 47 Latin America and Caribbean 9,634 14,247 1.4 1.8 22 5 – 4 6 1 7,739 0 15 12 55 CEE/CIS 9,216 17,627 – 2.8 43 0 – – – – 9,549 1 24 19 44 Least developed countries 845 2,133 0.0 3.1 19 45 – 2 3 2 43,726 5 4 18 45 World 10,647 14,633 2.5 2.9 7 18 – 7** 5** 2** 101,963 0 8 17 46 For a complete list of countries and areas in the regions, subregions and country categories, see page 112 or visit . It is not advisable to compare data from consecutive editions of The State of the World’s Children. DEFINITIONS OF THE INDICATORS MAIN DATA SOURCES GNI per capita – Gross national income (GNI) is the sum of value added by all GNI per capita – The World Bank. resident producers plus any product taxes (less subsidies) not included in the GDP per capita – The World Bank. valuation of output plus net receipts of primary income (compensation of employees Rate of inflation – The World Bank. and property income) from abroad. Gross national income per capita is GNI divided by midyear population. GNI per capita in US dollars is converted using the World Population below international poverty line of US$1.90 per day – The World Bank. Bank Atlas method. National monetary child poverty – Data are compiled from official national government sources GNI per capita (PPP US$) – GNI per capita converted to international dollars such as Statistical Office tabulations and national household survey and poverty reports, and from taking into account differences in price levels (purchasing power) between official regional databases such as those compiled by Eurostat. National estimates are based on countries. Based on data from the International Comparison Programme. representative household income or expenditure surveys. GDP per capita – Gross domestic product (GDP) is the sum of value added by all Spending on health, education and military – The World Bank. resident producers plus any product taxes (less subsidies) not included in the ODA – Organisation for Economic Co-operation and Development. valuation of output. Gross domestic product per capita is GDP divided by midyear population. Growth is calculated from constant price GDP data in local currency. Debt service – The World Bank. Population below international poverty line of US$1.90 per day – Poverty Share of household income – The World Bank. headcount ratio at $1.90 a day is the percentage of the population living on less than $1.90 a day at 2011 international prices. As a result of revisions in PPP exchange rates, poverty rates for individual countries cannot be compared with NOTES poverty rates reported in earlier editions. a low-income country (GNI per capita is $1,045 or less). National monetary child poverty – Percentage of children aged 0–17 years old b lower-middle-income country (GNI per capita is $1,046 to $4,125). living in households with income or consumption below the government defined c upper-middle-income country (GNI per capita is $4,126 to $12,735). national monetary poverty threshold. d high-income country (GNI per capita is $12,736 or more). ODA – Net official development assistance. – Data not available. Debt service – Sum of interest payments and repayments of principal on external public and publicly guaranteed long-term debts. x Data refer to years or periods other than those specified in the column heading. Such data are not Share of household income – Percentage of income received by the 20 per cent included in the calculation of regional and global averages. of households with the highest income and by the 40 per cent of households with y Data differ from the standard definition or refer to only part of a country. If they fall within the the lowest income. reference period, such data are included in the calculation of regional and global averages. e Estimate is based on regression; other PPP figures are extrapolated from the 2011 International Comparison Programme benchmark estimates. * Data refer to the most recent year available during the period specified in the column heading. ** Excludes China. THE STATE OF THE WORLD’S CHILDREN 2016 145
 70 Years for Every Child Page 163 Page 165