
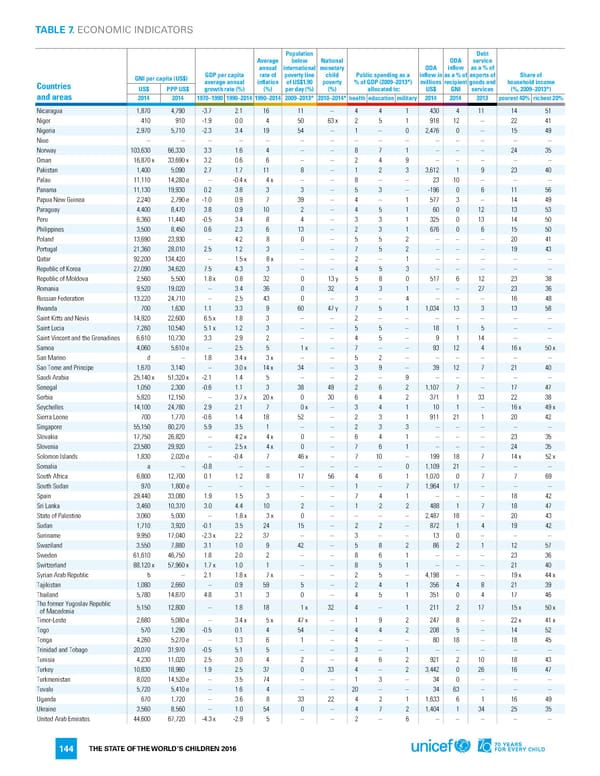
TABLE 7. ECONOMIC INDICATORS Population Debt Average below National ODA service annual international monetary ODA inflow as a % of GNI per capita (US$) GDP per capita rate of poverty line child Public spending as a inflow in as a % of exports of Share of Countries average annual inflation of US$1.90 poverty % of GDP (2009–2013*) millions recipient goods and household income US$ PPP US$ growth rate (%) (%) per day (%) (%) allocated to: US$ GNI services (%, 2009–2013*) and areas 2014 2014 1970–1990 1990–2014 1990–2014 2009–2013* 2010–2014* health education military 2014 2014 2013 poorest 40% richest 20% Nicaragua 1,870 4,790 -3.7 2.1 16 11 – 4 4 1 430 4 11 14 51 Niger 410 910 -1.9 0.0 4 50 63x 2 5 1 918 12 – 22 41 Nigeria 2,970 5,710 -2.3 3.4 19 54 – 1 – 0 2,476 0 – 15 49 Niue – – – – – – – – – – – – – – – Norway 103,630 66,330 3.3 1.6 4 – – 8 7 1 – – – 24 35 Oman 16,870 x 33,690 x 3.2 0.6 6 – – 2 4 9 – – – – – Pakistan 1,400 5,090 2.7 1.7 11 8 – 1 2 3 3,612 1 9 23 40 Palau 11,110 14,280 e – -0.4 x 4x – – 8 – – 23 10 – – – Panama 11,130 19,930 0.2 3.8 3 3 – 5 3 – -196 0 6 11 56 Papua New Guinea 2,240 2,790 e -1.0 0.9 7 39 – 4 – 1 577 3 – 14 49 Paraguay 4,400 8,470 3.8 0.9 10 2 – 4 5 1 60 0 12 13 53 Peru 6,360 11,440 -0.5 3.4 8 4 – 3 3 1 325 0 13 14 50 Philippines 3,500 8,450 0.6 2.3 6 13 – 2 3 1 676 0 6 15 50 Poland 13,690 23,930 – 4.2 8 0 – 5 5 2 – – – 20 41 Portugal 21,360 28,010 2.5 1.2 3 – – 7 5 2 – – – 19 43 Qatar 92,200 134,420 – 1.5 x 8x – – 2 – 1 – – – – – Republic of Korea 27,090 34,620 7.5 4.3 3 – – 4 5 3 – – – – – Republic of Moldova 2,560 5,500 1.8 x 0.8 32 0 13y 5 8 0 517 6 12 23 38 Romania 9,520 19,020 – 3.4 36 0 32 4 3 1 – – 27 23 36 Russian Federation 13,220 24,710 – 2.5 43 0 – 3 – 4 – – – 16 48 Rwanda 700 1,630 1.1 3.3 9 60 47y 7 5 1 1,034 13 3 13 58 Saint Kitts and Nevis 14,920 22,600 6.5 x 1.8 3 – – 2 – – – – – – – Saint Lucia 7,260 10,540 5.1 x 1.2 3 – – 5 5 – 18 1 5 – – Saint Vincent and the Grenadines 6,610 10,730 3.3 2.9 2 – – 4 5 – 9 1 14 – – Samoa 4,060 5,610 e – 2.5 5 1x – 7 – – 93 12 4 16x 50x San Marino d – 1.8 3.4 x 3x – – 5 2 – – – – – – Sao Tome and Principe 1,670 3,140 – 3.0 x 14x 34 – 3 9 – 39 12 7 21 40 Saudi Arabia 25,140 x 51,320 x -2.1 1.4 5 – – 2 – 9 – – – – – Senegal 1,050 2,300 -0.6 1.1 3 38 49 2 6 2 1,107 7 – 17 47 Serbia 5,820 12,150 – 3.7 x 20x 0 30 6 4 2 371 1 33 22 38 Seychelles 14,100 24,780 2.9 2.1 7 0x – 3 4 1 10 1 – 16x 49x Sierra Leone 700 1,770 -0.6 1.4 18 52 – 2 3 1 911 21 1 20 42 Singapore 55,150 80,270 5.9 3.5 1 – – 2 3 3 – – – – – Slovakia 17,750 26,820 – 4.2 x 4x 0 – 6 4 1 – – – 23 35 Slovenia 23,580 29,920 – 2.5 x 4x 0 – 7 6 1 – – – 24 35 Solomon Islands 1,830 2,020 e – -0.4 7 46x – 7 10 – 199 18 7 14x 52x Somalia a – -0.8 – – – – – – 0 1,109 21 – – – South Africa 6,800 12,700 0.1 1.2 8 17 56 4 6 1 1,070 0 7 7 69 South Sudan 970 1,800 e – – – – – 1 – 7 1,964 17 – – – Spain 29,440 33,080 1.9 1.5 3 – – 7 4 1 – – – 18 42 Sri Lanka 3,460 10,370 3.0 4.4 10 2 – 1 2 2 488 1 7 18 47 State of Palestine 3,060 5,000 – 1.8 x 3x 0 – – – – 2,487 18 – 20 43 Sudan 1,710 3,920 -0.1 3.5 24 15 – 2 2 – 872 1 4 19 42 Suriname 9,950 17,040 -2.3 x 2.2 37 – – 3 – – 13 0 – – – Swaziland 3,550 7,880 3.1 1.0 9 42 – 5 8 2 86 2 1 12 57 Sweden 61,610 46,750 1.8 2.0 2 – – 8 6 1 – – – 23 36 Switzerland 88,120 x 57,960 x 1.7 x 1.0 1 – – 8 5 1 – – – 21 40 Syrian Arab Republic b – 2.1 1.8 x 7x – – 2 5 – 4,198 – – 19x 44x Tajikistan 1,080 2,660 – 0.9 59 5 – 2 4 1 356 4 8 21 39 Thailand 5,780 14,870 4.8 3.1 3 0 – 4 5 1 351 0 4 17 46 The former Yugoslav Republic 5,150 12,800 – 1.8 18 1x 32 4 – 1 211 2 17 15x 50x of Macedonia Timor-Leste 2,680 5,080 e – 3.4 x 5x 47x – 1 9 2 247 8 – 22x 41x Togo 570 1,290 -0.5 0.1 4 54 – 4 4 2 208 5 – 14 52 Tonga 4,260 5,270 e – 1.3 6 1 – 4 – – 80 18 – 18 45 Trinidad and Tobago 20,070 31,970 -0.5 5.1 5 – – 3 – 1 – – – – – Tunisia 4,230 11,020 2.5 3.0 4 2 – 4 6 2 921 2 10 18 43 Turkey 10,830 18,980 1.9 2.5 37 0 33 4 – 2 3,442 0 26 16 47 Turkmenistan 8,020 14,520 e – 3.5 74 – – 1 3 – 34 0 – – – Tuvalu 5,720 5,410 e – 1.6 4 – – 20 – – 34 63 – – – Uganda 670 1,720 – 3.6 8 33 22 4 2 1 1,633 6 1 16 49 Ukraine 3,560 8,560 – 1.0 54 0 – 4 7 2 1,404 1 34 25 35 United Arab Emirates 44,600 67,720 -4.3 x -2.9 5 – – 2 – 6 – – – – – THE STATE OF THE WORLD’S CHILDREN 2016 144
 70 Years for Every Child Page 162 Page 164