
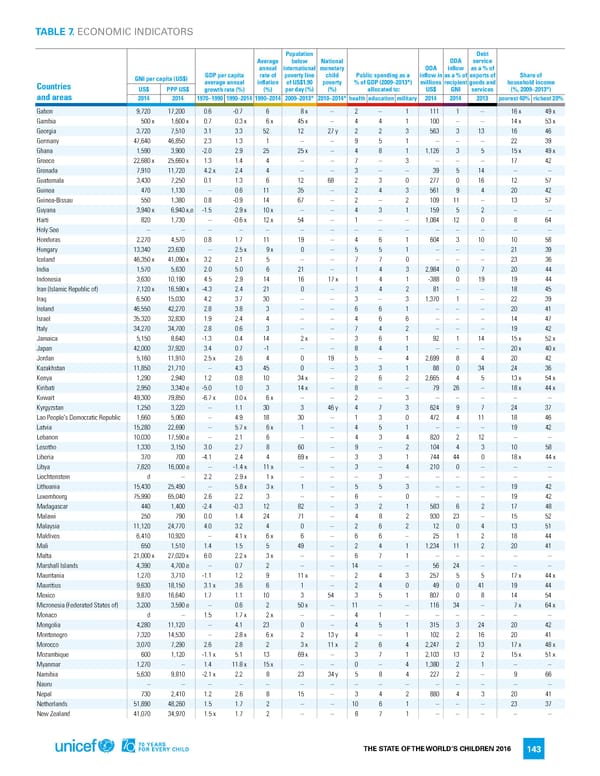
TABLE 7. ECONOMIC INDICATORS Population Debt Average below National ODA service annual international monetary ODA inflow as a % of GNI per capita (US$) GDP per capita rate of poverty line child Public spending as a inflow in as a % of exports of Share of Countries average annual inflation of US$1.90 poverty % of GDP (2009–2013*) millions recipient goods and household income US$ PPP US$ growth rate (%) (%) per day (%) (%) allocated to: US$ GNI services (%, 2009–2013*) and areas 2014 2014 1970–1990 1990–2014 1990–2014 2009–2013* 2010–2014* health education military 2014 2014 2013 poorest 40% richest 20% Gabon 9,720 17,200 0.6 -0.7 6 8x – 2 – 1 111 1 – 16x 49x Gambia 500x 1,600 x 0.7 0.3 x 6x 45x – 4 4 1 100 – – 14x 53x Georgia 3,720 7,510 3.1 3.3 52 12 27y 2 2 3 563 3 13 16 46 Germany 47,640 46,850 2.3 1.3 1 – – 9 5 1 – – – 22 39 Ghana 1,590 3,900 -2.0 2.9 25 25x – 4 8 1 1,126 3 5 15x 49x Greece 22,680 x 25,660 x 1.3 1.4 4 – – 7 – 3 – – – 17 42 Grenada 7,910 11,720 4.2 x 2.4 4 – – 3 – – 39 5 14 – – Guatemala 3,430 7,250 0.1 1.3 6 12 68 2 3 0 277 0 16 12 57 Guinea 470 1,130 – 0.6 11 35 – 2 4 3 561 9 4 20 42 Guinea-Bissau 550 1,380 0.8 -0.9 14 67 – 2 – 2 109 11 – 13 57 Guyana 3,940 x 6,940 x,e -1.5 2.9 x 10x – – 4 3 1 159 5 2 – – Haiti 820 1,730 – -0.6 x 12x 54 – 1 – – 1,084 12 0 8 64 Holy See – – – – – – – – – – – – – – – Honduras 2,270 4,570 0.8 1.7 11 19 – 4 6 1 604 3 10 10 58 Hungary 13,340 23,630 – 2.5 x 9x 0 – 5 5 1 – – – 21 39 Iceland 46,350 x 41,090 x 3.2 2.1 5 – – 7 7 0 – – – 23 36 India 1,570 5,630 2.0 5.0 6 21 – 1 4 3 2,984 0 7 20 44 Indonesia 3,630 10,190 4.5 2.9 14 16 17x 1 4 1 -388 0 19 19 44 Iran (Islamic Republic of) 7,120 x 16,590 x -4.3 2.4 21 0 – 3 4 2 81 – – 18 45 Iraq 6,500 15,030 4.2 3.7 30 – – 3 – 3 1,370 1 – 22 39 Ireland 46,550 42,270 2.8 3.8 3 – – 6 6 1 – – – 20 41 Israel 35,320 32,830 1.9 2.4 4 – – 4 6 6 – – – 14 47 Italy 34,270 34,700 2.8 0.6 3 – – 7 4 2 – – – 19 42 Jamaica 5,150 8,640 -1.3 0.4 14 2x – 3 6 1 92 1 14 15x 52x Japan 42,000 37,920 3.4 0.7 -1 – – 8 4 1 – – – 20x 40x Jordan 5,160 11,910 2.5 x 2.6 4 0 19 5 – 4 2,699 8 4 20 42 Kazakhstan 11,850 21,710 – 4.3 45 0 – 3 3 1 88 0 34 24 36 Kenya 1,290 2,940 1.2 0.8 10 34x – 2 6 2 2,665 4 5 13x 54x Kiribati 2,950 3,340 e -5.0 1.0 3 14x – 8 – – 79 26 – 18x 44x Kuwait 49,300 79,850 -6.7 x 0.0 x 6x – – 2 – 3 – – – – – Kyrgyzstan 1,250 3,220 – 1.1 30 3 46y 4 7 3 624 9 7 24 37 Lao People's Democratic Republic 1,660 5,060 – 4.9 18 30 – 1 3 0 472 4 11 18 46 Latvia 15,280 22,690 – 5.7 x 6x 1 – 4 5 1 – – – 19 42 Lebanon 10,030 17,590 e – 2.1 6 – – 4 3 4 820 2 12 – – Lesotho 1,330 3,150 3.0 2.7 8 60 – 9 – 2 104 4 3 10 58 Liberia 370 700 -4.1 2.4 4 69x – 3 3 1 744 44 0 18x 44x Libya 7,820 16,000 e – -1.4 x 11x – – 3 – 4 210 0 – – – Liechtenstein d – 2.2 2.9 x 1x – – – 3 – – – – – – Lithuania 15,430 25,490 – 5.8 x 3x 1 – 5 5 3 – – – 19 42 Luxembourg 75,990 65,040 2.6 2.2 3 – – 6 – 0 – – – 19 42 Madagascar 440 1,400 -2.4 -0.3 12 82 – 3 2 1 583 6 2 17 48 Malawi 250 790 0.0 1.4 24 71 – 4 8 2 930 23 – 15 52 Malaysia 11,120 24,770 4.0 3.2 4 0 – 2 6 2 12 0 4 13 51 Maldives 6,410 10,920 – 4.1 x 6x 6 – 6 6 – 25 1 2 18 44 Mali 650 1,510 1.4 1.5 5 49 – 2 4 1 1,234 11 2 20 41 Malta 21,000 x 27,020 x 6.0 2.2 x 3x – – 6 7 1 – – – – – Marshall Islands 4,390 4,700 e – 0.7 2 – – 14 – – 56 24 – – – Mauritania 1,270 3,710 -1.1 1.2 9 11x – 2 4 3 257 5 5 17x 44x Mauritius 9,630 18,150 3.1 x 3.6 6 1 – 2 4 0 49 0 41 19 44 Mexico 9,870 16,640 1.7 1.1 10 3 54 3 5 1 807 0 8 14 54 Micronesia (Federated States of) 3,200 3,590 e – 0.6 2 50x – 11 – – 116 34 – 7x 64x Monaco d – 1.5 1.7 x 2x – – 4 1 – – – – – – Mongolia 4,280 11,120 – 4.1 23 0 – 4 5 1 315 3 24 20 42 Montenegro 7,320 14,530 – 2.8 x 6x 2 13y 4 – 1 102 2 16 20 41 Morocco 3,070 7,290 2.6 2.8 2 3x 11x 2 6 4 2,247 2 13 17x 48x Mozambique 600 1,120 -1.1 x 5.1 13 69x – 3 7 1 2,103 13 2 15x 51x Myanmar 1,270 – 1.4 11.8 x 15x – – 0 – 4 1,380 2 1 – – Namibia 5,630 9,810 -2.1 x 2.2 8 23 34y 5 8 4 227 2 – 9 66 Nauru – – – – – – – – – – – – – – – Nepal 730 2,410 1.2 2.6 8 15 – 3 4 2 880 4 3 20 41 Netherlands 51,890 48,260 1.5 1.7 2 – – 10 6 1 – – – 23 37 New Zealand 41,070 34,970 1.5 x 1.7 2 – – 8 7 1 – – – – – THE STATE OF THE WORLD’S CHILDREN 2016 143
 70 Years for Every Child Page 161 Page 163