
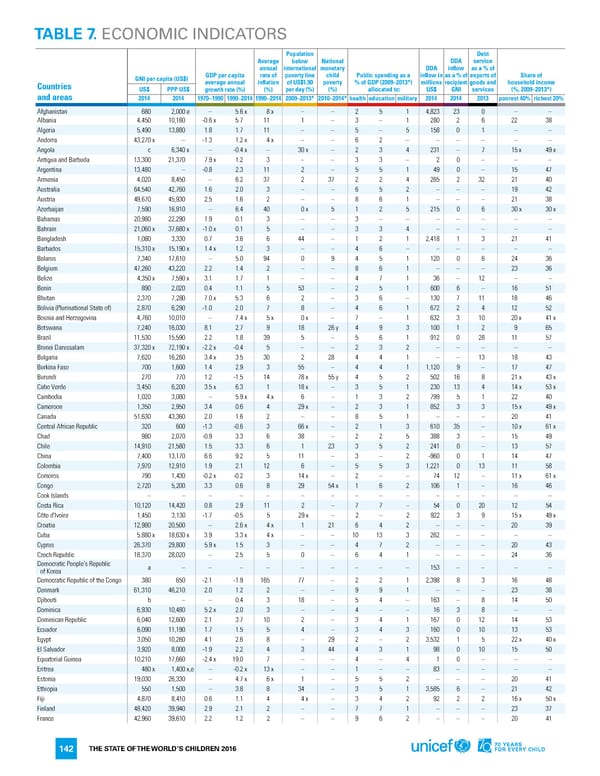
TABLE 7. ECONOMIC INDICATORS Population Debt Average below National ODA service annual international monetary ODA inflow as a % of GNI per capita (US$) GDP per capita rate of poverty line child Public spending as a inflow in as a % of exports of Share of Countries average annual inflation of US$1.90 poverty % of GDP (2009–2013*) millions recipient goods and household income US$ PPP US$ growth rate (%) (%) per day (%) (%) allocated to: US$ GNI services (%, 2009–2013*) and areas 2014 2014 1970–1990 1990–2014 1990–2014 2009–2013* 2010–2014* health education military 2014 2014 2013 poorest 40% richest 20% Afghanistan 680 2,000 e – 5.6 x 8x – – 2 5 1 4,823 23 0 – – Albania 4,450 10,180 -0.6 x 5.7 11 1 – 3 – 1 280 2 6 22 38 Algeria 5,490 13,880 1.8 1.7 11 – – 5 – 5 158 0 1 – – Andorra 43,270 x – -1.3 1.2 x 4x – – 6 2 – – – – – – Angola c 6,340 x – -0.4 x – 30x – 2 3 4 231 – 7 15x 49x Antigua and Barbuda 13,300 21,370 7.9 x 1.2 3 – – 3 3 – 2 0 – – – Argentina 13,480 – -0.8 2.3 11 2 – 5 5 1 49 0 – 15 47 Armenia 4,020 8,450 – 6.2 37 2 37 2 2 4 265 2 32 21 40 Australia 64,540 42,760 1.6 2.0 3 – – 6 5 2 – – – 19 42 Austria 49,670 45,930 2.5 1.6 2 – – 8 6 1 – – – 21 38 Azerbaijan 7,590 16,910 – 6.4 40 0x 5 1 2 5 215 0 6 30x 30x Bahamas 20,980 22,290 1.9 0.1 3 – – 3 – – – – – – – Bahrain 21,060 x 37,680 x -1.0 x 0.1 5 – – 3 3 4 – – – – – Bangladesh 1,080 3,330 0.7 3.6 6 44 – 1 2 1 2,418 1 3 21 41 Barbados 15,310 x 15,190 x 1.4 x 1.2 3 – – 4 6 – – – – – – Belarus 7,340 17,610 – 5.0 94 0 9 4 5 1 120 0 6 24 36 Belgium 47,260 43,220 2.2 1.4 2 – – 8 6 1 – – – 23 36 Belize 4,350 x 7,590 x 3.1 1.7 1 – – 4 7 1 36 – 12 – – Benin 890 2,020 0.4 1.1 5 53 – 2 5 1 600 6 – 16 51 Bhutan 2,370 7,280 7.0 x 5.3 6 2 – 3 6 – 130 7 11 18 46 Bolivia (Plurinational State of) 2,870 6,290 -1.0 2.0 7 8 – 4 6 1 672 2 4 12 52 Bosnia and Herzegovina 4,760 10,010 – 7.4 x 5x 0x – 7 – 1 632 3 10 20x 41x Botswana 7,240 16,030 8.1 2.7 9 18 26y 4 9 3 100 1 2 9 65 Brazil 11,530 15,590 2.2 1.8 39 5 – 5 6 1 912 0 28 11 57 Brunei Darussalam 37,320 x 72,190 x -2.2 x -0.4 5 – – 2 3 2 – – – – – Bulgaria 7,620 16,260 3.4 x 3.5 30 2 28 4 4 1 – – 13 18 43 Burkina Faso 700 1,600 1.4 2.9 3 55 – 4 4 1 1,120 9 – 17 47 Burundi 270 770 1.2 -1.5 14 78x 55y 4 5 2 502 16 8 21x 43x Cabo Verde 3,450 6,200 3.5 x 6.3 1 18x – 3 5 1 230 13 4 14x 53x Cambodia 1,020 3,080 – 5.9 x 4x 6 – 1 3 2 799 5 1 22 40 Cameroon 1,350 2,950 3.4 0.6 4 29x – 2 3 1 852 3 3 15x 49x Canada 51,630 43,360 2.0 1.6 2 – – 8 5 1 – – – 20 41 Central African Republic 320 600 -1.3 -0.6 3 66x – 2 1 3 610 35 – 10x 61x Chad 980 2,070 -0.9 3.3 6 38 – 2 2 5 388 3 – 15 49 Chile 14,910 21,580 1.5 3.3 6 1 23 3 5 2 241 0 – 13 57 China 7,400 13,170 6.6 9.2 5 11 – 3 – 2 -960 0 1 14 47 Colombia 7,970 12,910 1.9 2.1 12 6 – 5 5 3 1,221 0 13 11 58 Comoros 790 1,430 -0.2 x -0.2 3 14x – 2 – – 74 12 – 11x 61x Congo 2,720 5,200 3.3 0.6 8 29 54x 1 6 2 106 1 – 16 46 Cook Islands – – – – – – – – – – – – – – – Costa Rica 10,120 14,420 0.8 2.9 11 2 – 7 7 – 54 0 20 12 54 Côte d'Ivoire 1,450 3,130 -1.7 -0.5 5 29x – 2 – 2 922 3 9 15x 49x Croatia 12,980 20,500 – 2.6 x 4x 1 21 6 4 2 – – – 20 39 Cuba 5,880 x 18,630 x 3.9 3.3 x 4x – – 10 13 3 262 – – – – Cyprus 26,370 29,800 5.9 x 1.5 3 – – 4 7 2 – – – 20 43 Czech Republic 18,370 28,020 – 2.5 5 0 – 6 4 1 – – – 24 36 Democratic People's Republic a – – – – – – – – – 153 – – – – of Korea Democratic Republic of the Congo 380 650 -2.1 -1.9 165 77 – 2 2 1 2,398 8 3 16 48 Denmark 61,310 46,210 2.0 1.2 2 – – 9 9 1 – – – 23 38 Djibouti b – – 0.4 3 18 – 5 4 – 163 – 8 14 50 Dominica 6,930 10,480 5.2 x 2.0 3 – – 4 – – 16 3 8 – – Dominican Republic 6,040 12,600 2.1 3.7 10 2 – 3 4 1 167 0 12 14 53 Ecuador 6,090 11,190 1.7 1.5 5 4 – 3 4 3 160 0 10 13 53 Egypt 3,050 10,260 4.1 2.6 8 – 29 2 – 2 3,532 1 5 22x 40x El Salvador 3,920 8,000 -1.9 2.2 4 3 44 4 3 1 98 0 10 15 50 Equatorial Guinea 10,210 17,660 -2.4 x 19.0 7 – – 4 – 4 1 0 – – – Eritrea 480x 1,400 x,e – -0.2 x 13x – – 1 – – 83 – – – – Estonia 19,030 26,330 – 4.7 x 6x 1 – 5 5 2 – – – 20 41 Ethiopia 550 1,500 – 3.8 8 34 – 3 5 1 3,585 6 – 21 42 Fiji 4,870 8,410 0.6 1.1 4 4x – 3 4 2 92 2 2 16x 50x Finland 48,420 39,940 2.9 2.1 2 – – 7 7 1 – – – 23 37 France 42,960 39,610 2.2 1.2 2 – – 9 6 2 – – – 20 41 THE STATE OF THE WORLD’S CHILDREN 2016 142
 70 Years for Every Child Page 160 Page 162