
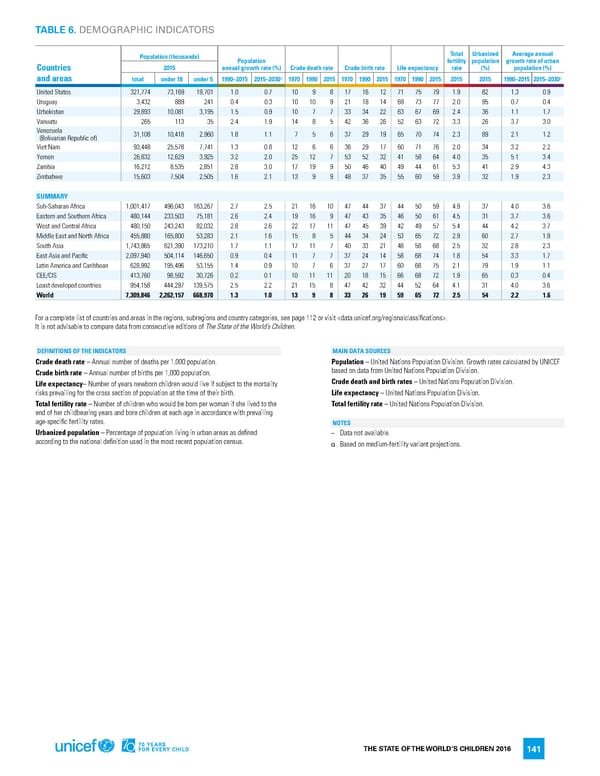
TABLE 6. DEMOGRAPHIC INDICATORS Population (thousands) Total Urbanized Average annual Population fertility population growth rate of urban Countries 2015 annual growth rate (%) Crude death rate Crude birth rate Life expectancy rate (%) population (%) and areas total under 18 under 5 1990–2015 2015–2030α 1970 1990 2015 1970 1990 2015 1970 1990 2015 2015 2015 1990–2015 2015–2030α United States 321,774 73,169 19,701 1.0 0.7 10 9 8 17 16 12 71 75 79 1.9 82 1.3 0.9 Uruguay 3,432 889 241 0.4 0.3 10 10 9 21 18 14 69 73 77 2.0 95 0.7 0.4 Uzbekistan 29,893 10,081 3,195 1.5 0.9 10 7 7 33 34 22 63 67 69 2.4 36 1.1 1.7 Vanuatu 265 113 35 2.4 1.9 14 8 5 42 36 26 52 63 72 3.3 26 3.7 3.0 Venezuela 31,108 10,418 2,960 1.8 1.1 7 5 6 37 29 19 65 70 74 2.3 89 2.1 1.2 (Bolivarian Republic of) Viet Nam 93,448 25,578 7,741 1.3 0.8 12 6 6 36 29 17 60 71 76 2.0 34 3.2 2.2 Yemen 26,832 12,629 3,925 3.2 2.0 25 12 7 53 52 32 41 58 64 4.0 35 5.1 3.4 Zambia 16,212 8,535 2,851 2.8 3.0 17 19 9 50 46 40 49 44 61 5.3 41 2.9 4.3 Zimbabwe 15,603 7,504 2,505 1.6 2.1 13 9 9 48 37 35 55 60 59 3.9 32 1.9 2.3 SUMMARY Sub-Saharan Africa 1,001,417 496,043 163,267 2.7 2.5 21 16 10 47 44 37 44 50 59 4.9 37 4.0 3.6 Eastern and Southern Africa 480,144 233,503 75,181 2.6 2.4 19 16 9 47 43 35 46 50 61 4.5 31 3.7 3.6 West and Central Africa 480,150 243,243 82,032 2.8 2.6 22 17 11 47 45 39 42 49 57 5.4 44 4.2 3.7 Middle East and North Africa 455,880 165,800 53,283 2.1 1.6 15 8 5 44 34 24 53 65 72 2.9 60 2.7 1.9 South Asia 1,743,865 621,390 173,210 1.7 1.1 17 11 7 40 33 21 48 58 68 2.5 32 2.8 2.3 East Asia and Pacific 2,097,940 504,114 146,650 0.9 0.4 11 7 7 37 24 14 58 68 74 1.8 54 3.3 1.7 Latin America and Caribbean 628,992 195,496 53,155 1.4 0.9 10 7 6 37 27 17 60 68 75 2.1 79 1.9 1.1 CEE/CIS 413,760 98,592 30,726 0.2 0.1 10 11 11 20 18 15 66 68 72 1.9 65 0.3 0.4 Least developed countries 954,158 444,297 139,575 2.5 2.2 21 15 8 47 42 32 44 52 64 4.1 31 4.0 3.6 World 7,309,846 2,262,157 668,970 1.3 1.0 13 9 8 33 26 19 59 65 72 2.5 54 2.2 1.6 For a complete list of countries and areas in the regions, subregions and country categories, see page 112 or visit . It is not advisable to compare data from consecutive editions of The State of the World’s Children. DEFINITIONS OF THE INDICATORS MAIN DATA SOURCES Crude death rate – Annual number of deaths per 1,000 population. Population – United Nations Population Division. Growth rates calculated by UNICEF Crude birth rate – Annual number of births per 1,000 population. based on data from United Nations Population Division. Life expectancy– Number of years newborn children would live if subject to the mortality Crude death and birth rates – United Nations Population Division. risks prevailing for the cross section of population at the time of their birth. Life expectancy – United Nations Population Division. Total fertility rate – Number of children who would be born per woman if she lived to the Total fertility rate – United Nations Population Division. end of her childbearing years and bore children at each age in accordance with prevailing age-specific fertility rates. NOTES Urbanized population – Percentage of population living in urban areas as defined − Data not available. according to the national definition used in the most recent population census. α Based on medium-fertility variant projections. THE STATE OF THE WORLD’S CHILDREN 2016 141
 70 Years for Every Child Page 159 Page 161