
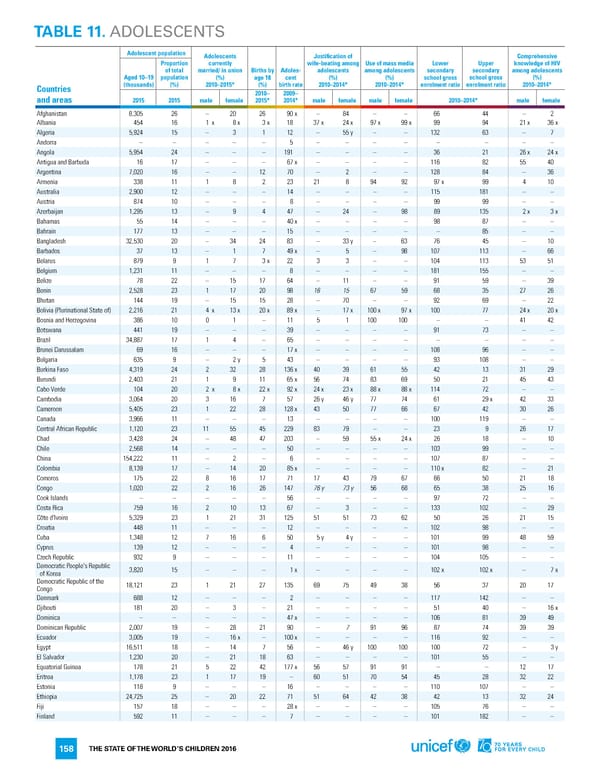
TABLE 11. ADOLESCENTS Adolescent population Adolescents Justification of Comprehensive Proportion currently wife-beating among Use of mass media Lower Upper knowledge of HIV of total married/ in union Births by Adoles- adolescents among adolescents secondary secondary among adolescents Aged 10–19 population (%) age 18 cent (%) (%) school gross school gross (%) Countries (thousands) (%) 2010–2015* (%) birth rate 2010–2014* 2010–2014* enrolment ratio enrolment ratio 2010–2014* 2010– 2009– and areas 2015 2015 male female 2015* 2014* male female male female 2010–2014* male female Afghanistan 8,305 26 – 20 26 90 x – 84 – – 66 44 – 2 Albania 454 16 1 x 8 x 3 x 18 37 x 24 x 97 x 99 x 99 94 21 x 36 x Algeria 5,924 15 – 3 1 12 – 55 y – – 132 63 – 7 Andorra – – – – – 5 – – – – – – – – Angola 5,954 24 – – – 191 – – – – 36 21 26 x 24 x Antigua and Barbuda 16 17 – – – 67 x – – – – 116 82 55 40 Argentina 7,020 16 – – 12 70 – 2 – – 128 84 – 36 Armenia 338 11 1 8 2 23 21 8 94 92 97 x 99 4 10 Australia 2,900 12 – – – 14 – – – – 115 181 – – Austria 874 10 – – – 8 – – – – 99 99 – – Azerbaijan 1,295 13 – 9 4 47 – 24 – 98 89 135 2 x 3 x Bahamas 55 14 – – – 40 x – – – – 98 87 – – Bahrain 177 13 – – – 15 – – – – – 85 – – Bangladesh 32,530 20 – 34 24 83 – 33 y – 63 76 45 – 10 Barbados 37 13 – 1 7 49 x – 5 – 98 107 113 – 66 Belarus 879 9 1 7 3 x 22 3 3 – – 104 113 53 51 Belgium 1,231 11 – – – 8 – – – – 181 155 – – Belize 78 22 – 15 17 64 – 11 – – 91 59 – 39 Benin 2,528 23 1 17 20 98 16 15 67 59 68 35 27 26 Bhutan 144 19 – 15 15 28 – 70 – – 92 69 – 22 Bolivia (Plurinational State of) 2,216 21 4 x 13 x 20 x 89 x – 17 x 100 x 97 x 100 77 24 x 20 x Bosnia and Herzegovina 386 10 0 1 – 11 5 1 100 100 – – 41 42 Botswana 441 19 – – – 39 – – – – 91 73 – – Brazil 34,887 17 1 4 – 65 – – – – – – – – Brunei Darussalam 69 16 – – – 17 x – – – – 108 96 – – Bulgaria 635 9 – 2 y 5 43 – – – – 93 108 – – Burkina Faso 4,319 24 2 32 28 136 x 40 39 61 55 42 13 31 29 Burundi 2,403 21 1 9 11 65 x 56 74 83 69 50 21 45 43 Cabo Verde 104 20 2 x 8 x 22 x 92 x 24 x 23 x 88 x 88 x 114 72 – – Cambodia 3,064 20 3 16 7 57 26 y 46 y 77 74 61 29 x 42 33 Cameroon 5,405 23 1 22 28 128 x 43 50 77 66 67 42 30 26 Canada 3,966 11 – – – 13 – – – – 100 119 – – Central African Republic 1,120 23 11 55 45 229 83 79 – – 23 9 26 17 Chad 3,428 24 – 48 47 203 – 59 55 x 24 x 26 18 – 10 Chile 2,568 14 – – – 50 – – – – 103 99 – – China 154,222 11 – 2 – 6 – – – – 107 87 – – Colombia 8,139 17 – 14 20 85 x – – – – 110 x 82 – 21 Comoros 175 22 8 16 17 71 17 43 79 67 66 50 21 18 Congo 1,020 22 2 16 26 147 76 y 73 y 56 68 65 38 25 16 Cook Islands – – – – – 56 – – – – 97 72 – – Costa Rica 759 16 2 10 13 67 – 3 – – 133 102 – 29 Côte d'Ivoire 5,329 23 1 21 31 125 51 51 73 62 50 26 21 15 Croatia 448 11 – – – 12 – – – – 102 98 – – Cuba 1,348 12 7 16 6 50 5 y 4 y – – 101 99 48 59 Cyprus 139 12 – – – 4 – – – – 101 98 – – Czech Republic 932 9 – – – 11 – – – – 104 105 – – Democratic People's Republic 3,820 15 – – – 1 x – – – – 102 x 102 x – 7 x of Korea Democratic Republic of the 18,121 23 1 21 27 135 69 75 49 38 56 37 20 17 Congo Denmark 688 12 – – – 2 – – – – 117 142 – – Djibouti 181 20 – 3 – 21 – – – – 51 40 – 16 x Dominica – – – – – 47 x – – – – 106 81 39 49 Dominican Republic 2,007 19 – 28 21 90 – 7 91 96 87 74 39 39 Ecuador 3,005 19 – 16 x – 100 x – – – – 116 92 – – Egypt 16,511 18 – 14 7 56 – 46 y 100 100 100 72 – 3 y El Salvador 1,230 20 – 21 18 63 – – – – 101 55 – – Equatorial Guinea 178 21 5 22 42 177 x 56 57 91 91 – – 12 17 Eritrea 1,178 23 1 17 19 – 60 51 70 54 45 28 32 22 Estonia 118 9 – – – 16 – – – – 110 107 – – Ethiopia 24,725 25 – 20 22 71 51 64 42 38 42 13 32 24 Fiji 157 18 – – – 28 x – – – – 105 76 – – Finland 592 11 – – – 7 – – – – 101 182 – – THE STATE OF THE WORLD’S CHILDREN 2016 158
 70 Years for Every Child Page 176 Page 178