
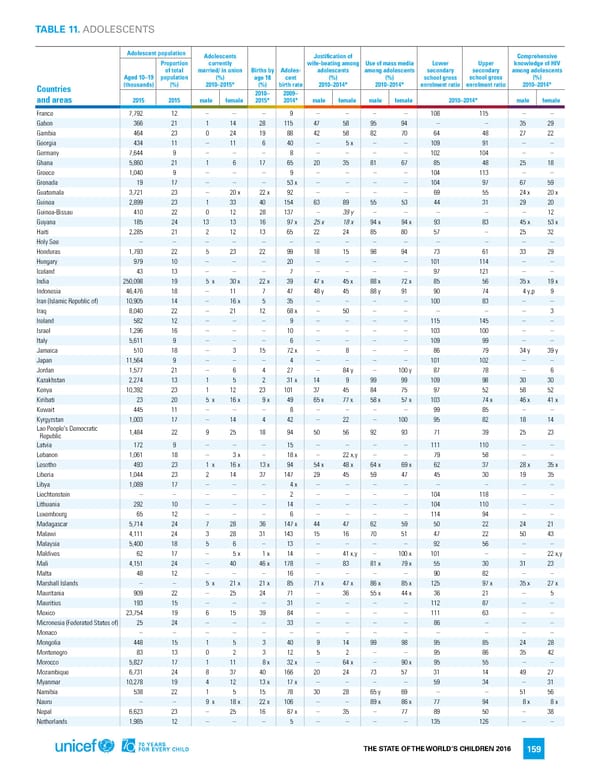
TABLE 11. ADOLESCENTS Adolescent population Adolescents Justification of Comprehensive Proportion currently wife-beating among Use of mass media Lower Upper knowledge of HIV of total married/ in union Births by Adoles- adolescents among adolescents secondary secondary among adolescents Aged 10–19 population (%) age 18 cent (%) (%) school gross school gross (%) Countries (thousands) (%) 2010–2015* (%) birth rate 2010–2014* 2010–2014* enrolment ratio enrolment ratio 2010–2014* 2010– 2009– and areas 2015 2015 male female 2015* 2014* male female male female 2010–2014* male female France 7,792 12 – – – 9 – – – – 108 115 – – Gabon 366 21 1 14 28 115 47 58 95 94 – – 35 29 Gambia 464 23 0 24 19 88 42 58 82 70 64 48 27 22 Georgia 434 11 – 11 6 40 – 5 x – – 109 91 – – Germany 7,644 9 – – – 8 – – – – 102 104 – – Ghana 5,860 21 1 6 17 65 20 35 81 67 85 48 25 18 Greece 1,040 9 – – – 9 – – – – 104 113 – – Grenada 19 17 – – – 53 x – – – – 104 97 67 59 Guatemala 3,721 23 – 20 x 22 x 92 – – – – 69 55 24 x 20 x Guinea 2,899 23 1 33 40 154 63 89 55 53 44 31 29 20 Guinea-Bissau 410 22 0 12 28 137 – 39 y – – – – – 12 Guyana 185 24 13 13 16 97 x 25 x 18 x 94 x 94 x 93 83 45 x 53 x Haiti 2,285 21 2 12 13 65 22 24 85 80 57 – 25 32 Holy See – – – – – – – – – – – – – – Honduras 1,793 22 5 23 22 99 18 15 98 94 73 61 33 29 Hungary 979 10 – – – 20 – – – – 101 114 – – Iceland 43 13 – – – 7 – – – – 97 121 – – India 250,098 19 5 x 30 x 22 x 39 47 x 45 x 88 x 72 x 85 56 35 x 19 x Indonesia 46,476 18 – 11 7 47 48 y 45 88 y 91 90 74 4 y,p 9 Iran (Islamic Republic of) 10,905 14 – 16 x 5 35 – – – – 100 83 – – Iraq 8,040 22 – 21 12 68 x – 50 – – – – – 3 Ireland 582 12 – – – 9 – – – – 115 145 – – Israel 1,296 16 – – – 10 – – – – 103 100 – – Italy 5,611 9 – – – 6 – – – – 109 99 – – Jamaica 510 18 – 3 15 72 x – 8 – – 86 79 34 y 39 y Japan 11,564 9 – – – 4 – – – – 101 102 – – Jordan 1,577 21 – 6 4 27 – 84 y – 100 y 87 78 – 6 Kazakhstan 2,274 13 1 5 2 31 x 14 9 99 99 109 98 30 30 Kenya 10,392 23 1 12 23 101 37 45 84 75 97 52 58 52 Kiribati 23 20 5 x 16 x 9 x 49 65 x 77 x 58 x 57 x 103 74 x 46 x 41 x Kuwait 445 11 – – – 8 – – – – 99 85 – – Kyrgyzstan 1,003 17 – 14 4 42 – 22 – 100 95 82 18 14 Lao People's Democratic 1,484 22 9 25 18 94 50 56 92 93 71 39 25 23 Republic Latvia 172 9 – – – 15 – – – – 111 110 – – Lebanon 1,061 18 – 3 x – 18 x – 22 x,y – – 79 58 – – Lesotho 493 23 1 x 16 x 13 x 94 54 x 48 x 64 x 69 x 62 37 28 x 35 x Liberia 1,044 23 2 14 37 147 29 45 59 47 45 30 19 35 Libya 1,089 17 – – – 4 x – – – – – – – – Liechtenstein – – – – – 2 – – – – 104 118 – – Lithuania 292 10 – – – 14 – – – – 104 110 – – Luxembourg 65 12 – – – 6 – – – – 114 94 – – Madagascar 5,714 24 7 28 36 147 x 44 47 62 59 50 22 24 21 Malawi 4,111 24 3 28 31 143 15 16 70 51 47 22 50 43 Malaysia 5,400 18 5 6 – 13 – – – – 92 56 – – Maldives 62 17 – 5 x 1 x 14 – 41 x,y – 100 x 101 – – 22 x,y Mali 4,151 24 – 40 46 x 178 – 83 81 x 79 x 55 30 31 23 Malta 48 12 – – – 16 – – – – 90 82 – – Marshall Islands – – 5 x 21 x 21 x 85 71 x 47 x 86 x 85 x 125 97 x 35 x 27 x Mauritania 909 22 – 25 24 71 – 36 55 x 44 x 36 21 – 5 Mauritius 193 15 – – – 31 – – – – 112 87 – – Mexico 23,754 19 6 15 39 84 – – – – 111 63 – – Micronesia (Federated States of) 25 24 – – – 33 – – – – 86 – – – Monaco – – – – – – – – – – – – – – Mongolia 448 15 1 5 3 40 9 14 99 98 95 85 24 28 Montenegro 83 13 0 2 3 12 5 2 – – 95 86 35 42 Morocco 5,827 17 1 11 8 x 32 x – 64 x – 90 x 95 55 – – Mozambique 6,731 24 8 37 40 166 20 24 73 57 31 14 49 27 Myanmar 10,278 19 4 12 13 x 17 x – – – – 59 34 – 31 Namibia 538 22 1 5 15 78 30 28 65 y 69 – – 51 56 Nauru – – 9 x 18 x 22 x 106 – – 89 x 86 x 77 94 8 x 8 x Nepal 6,623 23 – 25 16 87 x – 35 – 77 89 50 – 38 Netherlands 1,985 12 – – – 5 – – – – 135 126 – – THE STATE OF THE WORLD’S CHILDREN 2016 159
 70 Years for Every Child Page 177 Page 179