
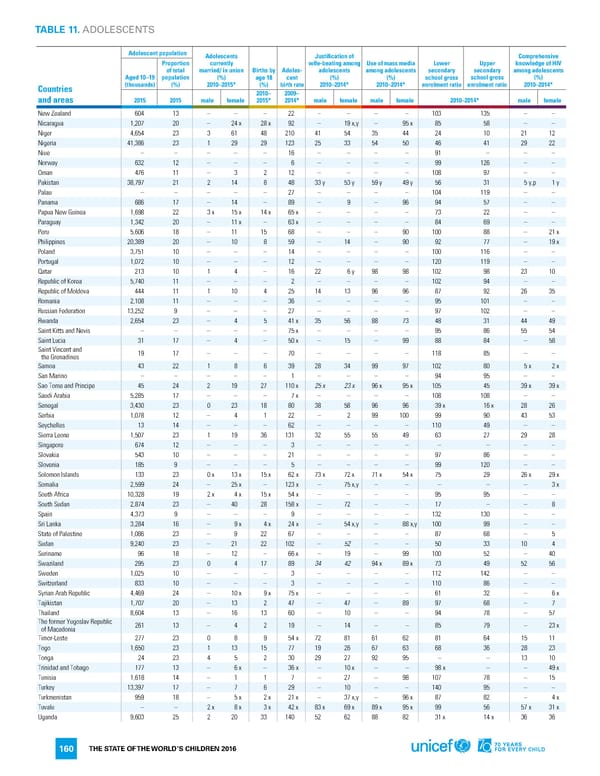
TABLE 11. ADOLESCENTS Adolescent population Adolescents Justification of Comprehensive Proportion currently wife-beating among Use of mass media Lower Upper knowledge of HIV of total married/ in union Births by Adoles- adolescents among adolescents secondary secondary among adolescents Aged 10–19 population (%) age 18 cent (%) (%) school gross school gross (%) Countries (thousands) (%) 2010–2015* (%) birth rate 2010–2014* 2010–2014* enrolment ratio enrolment ratio 2010–2014* 2010– 2009– and areas 2015 2015 male female 2015* 2014* male female male female 2010–2014* male female New Zealand 604 13 – – – 22 – – – – 103 135 – – Nicaragua 1,207 20 – 24 x 28 x 92 – 19 x,y – 95 x 85 58 – – Niger 4,654 23 3 61 48 210 41 54 35 44 24 10 21 12 Nigeria 41,386 23 1 29 29 123 25 33 54 50 46 41 29 22 Niue – – – – – 16 – – – – 91 – – – Norway 632 12 – – – 6 – – – – 99 126 – – Oman 476 11 – 3 2 12 – – – – 108 97 – – Pakistan 38,797 21 2 14 8 48 33 y 53 y 59 y 49 y 56 31 5 y,p 1 y Palau – – – – – 27 – – – – 104 119 – – Panama 686 17 – 14 – 89 – 9 – 96 94 57 – – Papua New Guinea 1,698 22 3 x 15 x 14 x 65 x – – – – 73 22 – – Paraguay 1,342 20 – 11 x – 63 x – – – – 84 69 – – Peru 5,606 18 – 11 15 68 – – – 90 100 88 – 21 x Philippines 20,389 20 – 10 8 59 – 14 – 90 92 77 – 19 x Poland 3,751 10 – – – 14 – – – – 100 116 – – Portugal 1,072 10 – – – 12 – – – – 120 119 – – Qatar 213 10 1 4 – 16 22 6 y 98 98 102 98 23 10 Republic of Korea 5,740 11 – – – 2 – – – – 102 94 – – Republic of Moldova 444 11 1 10 4 25 14 13 96 96 87 92 26 35 Romania 2,108 11 – – – 36 – – – – 95 101 – – Russian Federation 13,252 9 – – – 27 – – – – 97 102 – – Rwanda 2,654 23 – 4 5 41 x 35 56 88 73 48 31 44 49 Saint Kitts and Nevis – – – – – 75 x – – – – 95 86 55 54 Saint Lucia 31 17 – 4 – 50 x – 15 – 99 88 84 – 58 Saint Vincent and 19 17 – – – 70 – – – – 118 85 – – the Grenadines Samoa 43 22 1 8 6 39 28 34 99 97 102 80 5 x 2 x San Marino – – – – – 1 – – – – 94 95 – – Sao Tome and Principe 45 24 2 19 27 110 x 25 x 23 x 96 x 95 x 105 45 39 x 39 x Saudi Arabia 5,285 17 – – – 7 x – – – – 108 108 – – Senegal 3,430 23 0 23 18 80 38 58 96 96 39 x 16 x 28 26 Serbia 1,078 12 – 4 1 22 – 2 99 100 99 90 43 53 Seychelles 13 14 – – – 62 – – – – 110 49 – – Sierra Leone 1,507 23 1 19 36 131 32 55 55 49 63 27 29 28 Singapore 674 12 – – – 3 – – – – – – – – Slovakia 543 10 – – – 21 – – – – 97 86 – – Slovenia 185 9 – – – 5 – – – – 99 120 – – Solomon Islands 133 23 0 x 13 x 15 x 62 x 73 x 72 x 71 x 54 x 75 29 26 x 29 x Somalia 2,599 24 – 25 x – 123 x – 75 x,y – – – – – 3 x South Africa 10,328 19 2 x 4 x 15 x 54 x – – – – 95 95 – – South Sudan 2,874 23 – 40 28 158 x – 72 – – 17 – – 8 Spain 4,373 9 – – – 9 – – – – 132 130 – – Sri Lanka 3,284 16 – 9 x 4 x 24 x – 54 x,y – 88 x,y 100 99 – – State of Palestine 1,086 23 – 9 22 67 – – – – 87 68 – 5 Sudan 9,240 23 – 21 22 102 – 52 – – 50 33 10 4 Suriname 96 18 – 12 – 66 x – 19 – 99 100 52 – 40 Swaziland 295 23 0 4 17 89 34 42 94 x 89 x 73 49 52 56 Sweden 1,025 10 – – – 3 – – – – 112 142 – – Switzerland 833 10 – – – 3 – – – – 110 86 – – Syrian Arab Republic 4,469 24 – 10 x 9 x 75 x – – – – 61 32 – 6 x Tajikistan 1,707 20 – 13 2 47 – 47 – 89 97 68 – 7 Thailand 8,604 13 – 16 13 60 – 10 – – 94 78 – 57 The former Yugoslav Republic 261 13 – 4 2 19 – 14 – – 85 79 – 23 x of Macedonia Timor-Leste 277 23 0 8 9 54 x 72 81 61 62 81 64 15 11 Togo 1,650 23 1 13 15 77 19 26 67 63 68 36 28 23 Tonga 24 23 4 5 2 30 29 27 92 95 – – 13 10 Trinidad and Tobago 177 13 – 6 x – 36 x – 10 x – – 98 x – – 49 x Tunisia 1,618 14 – 1 1 7 – 27 – 98 107 78 – 15 Turkey 13,397 17 – 7 6 29 – 10 – – 140 95 – – Turkmenistan 959 18 – 5 x 2 x 21 x – 37 x,y – 96 x 87 82 – 4 x Tuvalu – – 2 x 8 x 3 x 42 x 83 x 69 x 89 x 95 x 99 56 57 x 31 x Uganda 9,603 25 2 20 33 140 52 62 88 82 31 x 14 x 36 36 THE STATE OF THE WORLD’S CHILDREN 2016 160
 70 Years for Every Child Page 178 Page 180