
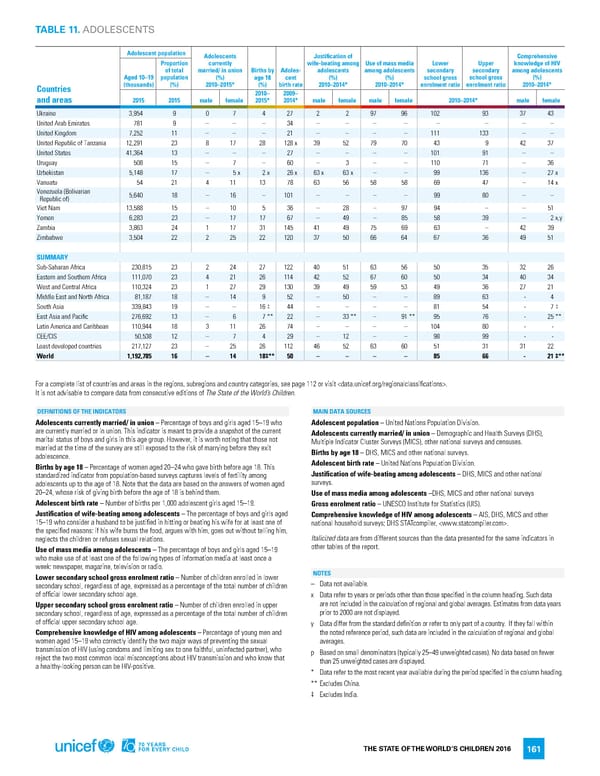
TABLE 11. ADOLESCENTS Adolescent population Adolescents Justification of Comprehensive Proportion currently wife-beating among Use of mass media Lower Upper knowledge of HIV of total married/ in union Births by Adoles- adolescents among adolescents secondary secondary among adolescents Aged 10–19 population (%) age 18 cent (%) (%) school gross school gross (%) Countries (thousands) (%) 2010–2015* (%) birth rate 2010–2014* 2010–2014* enrolment ratio enrolment ratio 2010–2014* 2010– 2009– and areas 2015 2015 male female 2015* 2014* male female male female 2010–2014* male female Ukraine 3,954 9 0 7 4 27 2 2 97 96 102 93 37 43 United Arab Emirates 781 9 – – – 34 – – – – – – – – United Kingdom 7,252 11 – – – 21 – – – – 111 133 – – United Republic of Tanzania 12,291 23 8 17 28 128 x 39 52 79 70 43 9 42 37 United States 41,364 13 – – – 27 – – – – 101 91 – – Uruguay 508 15 – 7 – 60 – 3 – – 110 71 – 36 Uzbekistan 5,148 17 – 5 x 2 x 26 x 63 x 63 x – – 99 136 – 27 x Vanuatu 54 21 4 11 13 78 63 56 58 58 69 47 – 14 x Venezuela (Bolivarian 5,640 18 – 16 – 101 – – – – 99 80 – – Republic of) Viet Nam 13,588 15 – 10 5 36 – 28 – 97 94 – – 51 Yemen 6,283 23 – 17 17 67 – 49 – 85 58 39 – 2 x,y Zambia 3,863 24 1 17 31 145 41 49 75 69 63 – 42 39 Zimbabwe 3,504 22 2 25 22 120 37 50 66 64 67 36 49 51 SUMMARY Sub-Saharan Africa 230,815 23 2 24 27 122 40 51 63 56 50 35 32 26 Eastern and Southern Africa 111,070 23 4 21 26 114 42 52 67 60 50 34 40 34 est and Central Africa 110,324 23 1 27 29 130 39 49 59 53 49 36 27 21 W Middle East and North Africa 81,187 18 – 14 9 52 – 50 – – 89 63 - 4 South Asia 339,843 19 – – 16 ‡ 44 – – – – 81 54 - 7 ‡ East Asia and Pacific 276,692 13 – 6 7 ** 22 – 33 ** – 91 ** 95 76 - 25 ** Latin America and Caribbean 110,944 18 3 11 26 74 – – – – 104 80 - - CEE/CIS 50,538 12 – 7 4 29 – 12 – – 98 99 - - Least developed countries 217,127 23 – 25 26 112 46 52 63 60 51 31 31 22 World 1,192,785 16 – 14 18 ‡** 50 – – – – 85 66 - 21 ‡** For a complete list of countries and areas in the regions, subregions and country categories, see page 112 or visit . It is not advisable to compare data from consecutive editions of The State of the World’s Children. DEFINITIONS OF THE INDICATORS MAIN DATA SOURCES Adolescents currently married/ in union – Percentage of boys and girls aged 15–19 who Adolescent population – United Nations Population Division. are currently married or in union. This indicator is meant to provide a snapshot of the current Adolescents currently married/ in union – Demographic and Health Surveys (DHS), marital status of boys and girls in this age group. However, it is worth noting that those not Multiple Indicator Cluster Surveys (MICS), other national surveys and censuses. married at the time of the survey are still exposed to the risk of marrying before they exit Births by age 18 – DHS, MICS and other national surveys. adolescence. Births by age 18 – Percentage of women aged 20–24 who gave birth before age 18. This Adolescent birth rate – United Nations Population Division. standardized indicator from population-based surveys captures levels of fertility among Justification of wife-beating among adolescents – DHS, MICS and other national adolescents up to the age of 18. Note that the data are based on the answers of women aged surveys. 20–24, whose risk of giving birth before the age of 18 is behind them. Use of mass media among adolescents –DHS, MICS and other national surveys Adolescent birth rate – Number of births per 1,000 adolescent girls aged 15–19. Gross enrolment ratio – UNESCO Institute for Statistics (UIS). Justification of wife-beating among adolescents – The percentage of boys and girls aged Comprehensive knowledge of HIV among adolescents – AIS, DHS, MICS and other 15–19 who consider a husband to be justified in hitting or beating his wife for at least one of national household surveys; DHS STATcompiler, . the specified reasons: if his wife burns the food, argues with him, goes out without telling him, neglects the children or refuses sexual relations. Italicized data are from different sources than the data presented for the same indicators in Use of mass media among adolescents – The percentage of boys and girls aged 15–19 other tables of the report. who make use of at least one of the following types of information media at least once a week: newspaper, magazine, television or radio. Lower secondary school gross enrolment ratio – Number of children enrolled in lower NOTES secondary school, regardless of age, expressed as a percentage of the total number of children – Data not available. of official lower secondary school age. x Data refer to years or periods other than those specified in the column heading. Such data Upper secondary school gross enrolment ratio – Number of children enrolled in upper are not included in the calculation of regional and global averages. Estimates from data years secondary school, regardless of age, expressed as a percentage of the total number of children prior to 2000 are not displayed. of official upper secondary school age. y Data differ from the standard definition or refer to only part of a country. If they fall within Comprehensive knowledge of HIV among adolescents – Percentage of young men and the noted reference period, such data are included in the calculation of regional and global women aged 15–19 who correctly identify the two major ways of preventing the sexual averages. transmission of HIV (using condoms and limiting sex to one faithful, uninfected partner), who p Based on small denominators (typically 25–49 unweighted cases). No data based on fewer reject the two most common local misconceptions about HIV transmission and who know that than 25 unweighted cases are displayed. a healthy-looking person can be HIV-positive. * Data refer to the most recent year available during the period specified in the column heading. ** Excludes China. ‡ Excludes India. THE STATE OF THE WORLD’S CHILDREN 2016 161
 70 Years for Every Child Page 179 Page 181