
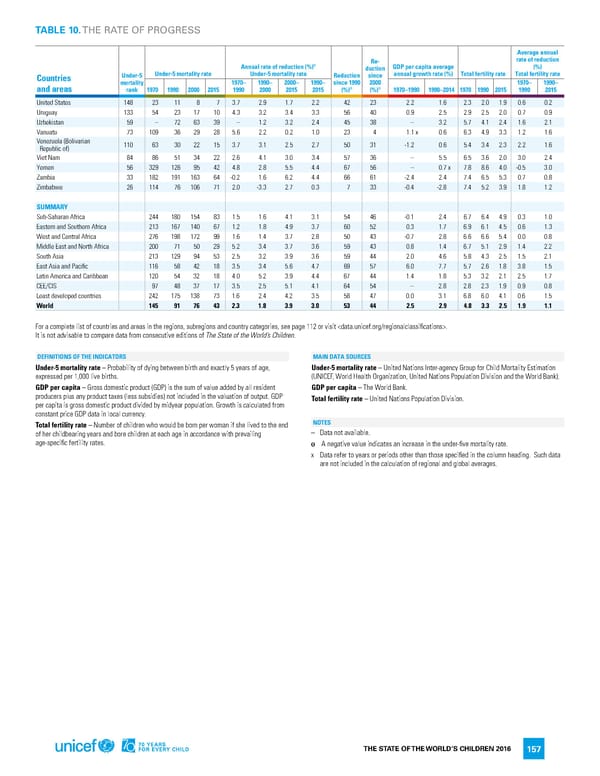
TABLE 10. THE RATE OF PROGRESS Average annual Re- rate of reduction ɵ (%) Annual rate of reduction (%) duction GDP per capita average Countries Under-5 Under-5 mortality rate Under-5 mortality rate Reduction since annual growth rate (%) Total fertility rate Total fertility rate mortality 1970– 1990– 2000– 1990– since 1990 2000 1970– 1990– ɵ ɵ and areas rank 1970 1990 2000 2015 1990 2000 2015 2015 (%) (%) 1970–1990 1990–2014 1970 1990 2015 1990 2015 United States 148 23 11 8 7 3.7 2.9 1.7 2.2 42 23 2.2 1.6 2.3 2.0 1.9 0.6 0.2 Uruguay 133 54 23 17 10 4.3 3.2 3.4 3.3 56 40 0.9 2.5 2.9 2.5 2.0 0.7 0.9 Uzbekistan 59 – 72 63 39 – 1.2 3.2 2.4 45 38 – 3.2 5.7 4.1 2.4 1.6 2.1 Vanuatu 73 109 36 29 28 5.6 2.2 0.2 1.0 23 4 1.1 x 0.6 6.3 4.9 3.3 1.2 1.6 Venezuela (Bolivarian 110 63 30 22 15 3.7 3.1 2.5 2.7 50 31 -1.2 0.6 5.4 3.4 2.3 2.2 1.6 Republic of) Viet Nam 84 86 51 34 22 2.6 4.1 3.0 3.4 57 36 – 5.5 6.5 3.6 2.0 3.0 2.4 Yemen 56 329 126 95 42 4.8 2.8 5.5 4.4 67 56 – 0.7 x 7.8 8.6 4.0 -0.5 3.0 Zambia 33 182 191 163 64 -0.2 1.6 6.2 4.4 66 61 -2.4 2.4 7.4 6.5 5.3 0.7 0.8 Zimbabwe 26 114 76 106 71 2.0 -3.3 2.7 0.3 7 33 -0.4 -2.8 7.4 5.2 3.9 1.8 1.2 SUMMARY Sub-Saharan Africa 244 180 154 83 1.5 1.6 4.1 3.1 54 46 -0.1 2.4 6.7 6.4 4.9 0.3 1.0 Eastern and Southern Africa 213 167 140 67 1.2 1.8 4.9 3.7 60 52 0.3 1.7 6.9 6.1 4.5 0.6 1.3 West and Central Africa 276 198 172 99 1.6 1.4 3.7 2.8 50 43 -0.7 2.8 6.6 6.6 5.4 0.0 0.8 Middle East and North Africa 200 71 50 29 5.2 3.4 3.7 3.6 59 43 0.8 1.4 6.7 5.1 2.9 1.4 2.2 South Asia 213 129 94 53 2.5 3.2 3.9 3.6 59 44 2.0 4.6 5.8 4.3 2.5 1.5 2.1 East Asia and Pacific 116 58 42 18 3.5 3.4 5.6 4.7 69 57 6.0 7.7 5.7 2.6 1.8 3.8 1.5 Latin America and Caribbean 120 54 32 18 4.0 5.2 3.9 4.4 67 44 1.4 1.8 5.3 3.2 2.1 2.5 1.7 CEE/CIS 97 48 37 17 3.5 2.5 5.1 4.1 64 54 – 2.8 2.8 2.3 1.9 0.9 0.8 Least developed countries 242 175 138 73 1.6 2.4 4.2 3.5 58 47 0.0 3.1 6.8 6.0 4.1 0.6 1.5 World 145 91 76 43 2.3 1.8 3.9 3.0 53 44 2.5 2.9 4.8 3.3 2.5 1.9 1.1 For a complete list of countries and areas in the regions, subregions and country categories, see page 112 or visit . It is not advisable to compare data from consecutive editions of The State of the World’s Children. DEFINITIONS OF THE INDICATORS MAIN DATA SOURCES Under-5 mortality rate – Probability of dying between birth and exactly 5 years of age, Under-5 mortality rate – United Nations Inter-agency Group for Child Mortality Estimation expressed per 1,000 live births. (UNICEF, World Health Organization, United Nations Population Division and the World Bank). GDP per capita – Gross domestic product (GDP) is the sum of value added by all resident GDP per capita – The World Bank. producers plus any product taxes (less subsidies) not included in the valuation of output. GDP Total fertility rate – United Nations Population Division. per capita is gross domestic product divided by midyear population. Growth is calculated from constant price GDP data in local currency. Total fertility rate – Number of children who would be born per woman if she lived to the end NOTES of her childbearing years and bore children at each age in accordance with prevailing – Data not available. age-specific fertility rates. ɵ A negative value indicates an increase in the under-five mortality rate. x Data refer to years or periods other than those specified in the column heading. Such data are not included in the calculation of regional and global averages. THE STATE OF THE WORLD’S CHILDREN 2016 157
 70 Years for Every Child Page 175 Page 177