
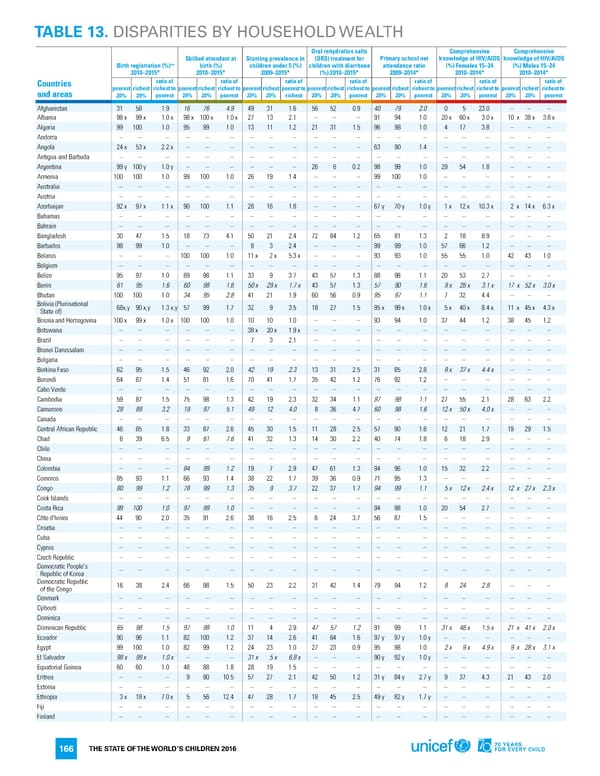
TABLE 13. DISPARITIES BY HOUSEHOLD WEALTH Oral rehydration salts Comprehensive Comprehensive Skilled attendant at Stunting prevalence in (ORS) treatment for Primary school net knowledge of HIV/AIDS knowledge of HIV/AIDS ++ birth (%) children under 5 (%) children with diarrhoea attendance ratio (%) Females 15–24 (%) Males 15–24 Birth registration (%) 2010–2015* 2010–2015* 2009–2015* (%) 2010–2015* 2009–2014* 2010–2014* 2010–2014* Countries ratio of ratio of ratio of ratio of ratio of ratio of ratio of and areas poorest richest richest to poorest richest richest to poorest richest poorest to poorest richest richest to poorest richest richest to poorest richest richest to poorest richest richest to 20% 20% poorest 20% 20% poorest 20% 20% richest 20% 20% poorest 20% 20% poorest 20% 20% poorest 20% 20% poorest Afghanistan 31 58 1.9 16 76 4.9 49 31 1.6 56 52 0.9 40 79 2.0 0 5 23.0 – – – Albania 98x 99x 1.0 x 98x 100x 1.0 x 27 13 2.1 – – – 91 94 1.0 20x 60x 3.0 x 10 x 38x 3.8 x Algeria 99 100 1.0 95 99 1.0 13 11 1.2 21 31 1.5 96 98 1.0 4 17 3.8 – – – Andorra – – – – – – – – – – – – – – – – – – – – – Angola 24x 53x 2.2 x – – – – – – – – – 63 90 1.4 – – – – – – Antigua and Barbuda – – – – – – – – – – – – – – – – – – – – – Argentina 99y 100y 1.0 y – – – – – – 26 6 0.2 98 99 1.0 29 54 1.8 – – – Armenia 100 100 1.0 99 100 1.0 26 19 1.4 – – – 99 100 1.0 – – – – – – Australia – – – – – – – – – – – – – – – – – – – – – Austria – – – – – – – – – – – – – – – – – – – – – Azerbaijan 92x 97x 1.1 x 90 100 1.1 28 16 1.8 – – – 67y 70y 1.0 y 1x 12x 10.3 x 2 x 14x 6.3 x Bahamas – – – – – – – – – – – – – – – – – – – – – Bahrain – – – – – – – – – – – – – – – – – – – – – Bangladesh 30 47 1.5 18 73 4.1 50 21 2.4 72 84 1.2 65 81 1.3 2 18 8.9 – – – Barbados 98 99 1.0 – – – 8 3 2.4 – – – 99 99 1.0 57 66 1.2 – – – Belarus – – – 100 100 1.0 11x 2x 5.3 x – – – 93 93 1.0 55 55 1.0 42 43 1.0 Belgium – – – – – – – – – – – – – – – – – – – – – Belize 95 97 1.0 89 98 1.1 33 9 3.7 43 57 1.3 88 98 1.1 20 53 2.7 – – – Benin 61 95 1.6 60 98 1.6 50x 29x 1.7 x 43 57 1.3 57 90 1.6 9x 26x 3.1 x 17 x 52x 3.0 x Bhutan 100 100 1.0 34 95 2.8 41 21 1.9 60 56 0.9 85 97 1.1 7 32 4.4 – – – Bolivia (Plurinational 68x,y 90x,y 1.3 x,y 57 99 1.7 32 9 3.5 18 27 1.5 95x 99x 1.0 x 5x 40x 8.4 x 11 x 45x 4.3 x State of) Bosnia and Herzegovina 100x 99x 1.0 x 100 100 1.0 10 10 1.0 – – – 93 94 1.0 37 44 1.2 38 45 1.2 Botswana – – – – – – 38x 20x 1.9 x – – – – – – – – – – – – Brazil – – – – – – 7 3 2.1 – – – – – – – – – – – – Brunei Darussalam – – – – – – – – – – – – – – – – – – – – – Bulgaria – – – – – – – – – – – – – – – – – – – – – Burkina Faso 62 95 1.5 46 92 2.0 42 19 2.3 13 31 2.5 31 85 2.8 8x 37x 4.4 x – – – Burundi 64 87 1.4 51 81 1.6 70 41 1.7 35 42 1.2 76 92 1.2 – – – – – – Cabo Verde – – – – – – – – – – – – – – – – – – – – – Cambodia 59 87 1.5 75 98 1.3 42 19 2.3 32 34 1.1 87 98 1.1 27 55 2.1 28 63 2.2 Cameroon 28 89 3.2 19 97 5.1 49 12 4.0 8 36 4.7 60 98 1.6 12x 50x 4.0 x – – – Canada – – – – – – – – – – – – – – – – – – – – – Central African Republic 46 85 1.8 33 87 2.6 45 30 1.5 11 28 2.5 57 90 1.6 12 21 1.7 19 29 1.5 Chad 6 39 6.5 8 61 7.6 41 32 1.3 14 30 2.2 40 74 1.8 6 18 2.9 – – – Chile – – – – – – – – – – – – – – – – – – – – – China – – – – – – – – – – – – – – – – – – – – – Colombia – – – 84 99 1.2 19 7 2.9 47 61 1.3 94 96 1.0 15 32 2.2 – – – Comoros 85 93 1.1 66 93 1.4 38 22 1.7 39 36 0.9 71 95 1.3 – – – – – – Congo 80 99 1.2 78 99 1.3 35 9 3.7 22 37 1.7 94 99 1.1 5x 12x 2.4 x 12 x 27x 2.3 x Cook Islands – – – – – – – – – – – – – – – – – – – – – Costa Rica 99 100 1.0 97 99 1.0 – – – – – – 94 98 1.0 20 54 2.7 – – – Côte d'Ivoire 44 90 2.0 35 91 2.6 38 16 2.5 6 24 3.7 56 87 1.5 – – – – – – Croatia – – – – – – – – – – – – – – – – – – – – – Cuba – – – – – – – – – – – – – – – – – – – – – Cyprus – – – – – – – – – – – – – – – – – – – – – Czech Republic – – – – – – – – – – – – – – – – – – – – – Democratic People's – – – – – – – – – – – – – – – – – – – – – Republic of Korea Democratic Republic 16 38 2.4 66 98 1.5 50 23 2.2 31 42 1.4 79 94 1.2 8 24 2.8 – – – of the Congo Denmark – – – – – – – – – – – – – – – – – – – – – Djibouti – – – – – – – – – – – – – – – – – – – – – Dominica – – – – – – – – – – – – – – – – – – – – – Dominican Republic 65 98 1.5 97 98 1.0 11 4 2.9 47 57 1.2 91 99 1.1 31x 46x 1.5 x 21 x 41x 2.0 x Ecuador 90 96 1.1 82 100 1.2 37 14 2.6 41 64 1.6 97y 97y 1.0 y – – – – – – Egypt 99 100 1.0 82 99 1.2 24 23 1.0 27 23 0.9 95 98 1.0 2x 9x 4.9 x 9 x 28x 3.1 x El Salvador 98x 99x 1.0 x – – – 31x 5x 6.8 x – – – 90y 92y 1.0 y – – – – – – Equatorial Guinea 60 60 1.0 48 88 1.8 28 19 1.5 – – – – – – – – – – – – Eritrea – – – 9 90 10.5 57 27 2.1 42 50 1.2 31y 84y 2.7 y 9 37 4.3 21 43 2.0 Estonia – – – – – – – – – – – – – – – – – – – – – Ethiopia 3x 18x 7.0 x 5 56 12.4 47 28 1.7 18 45 2.5 49y 82y 1.7 y – – – – – – Fiji – – – – – – – – – – – – – – – – – – – – – Finland – – – – – – – – – – – – – – – – – – – – – THE STATE OF THE WORLD’S CHILDREN 2016 166
 70 Years for Every Child Page 184 Page 186