
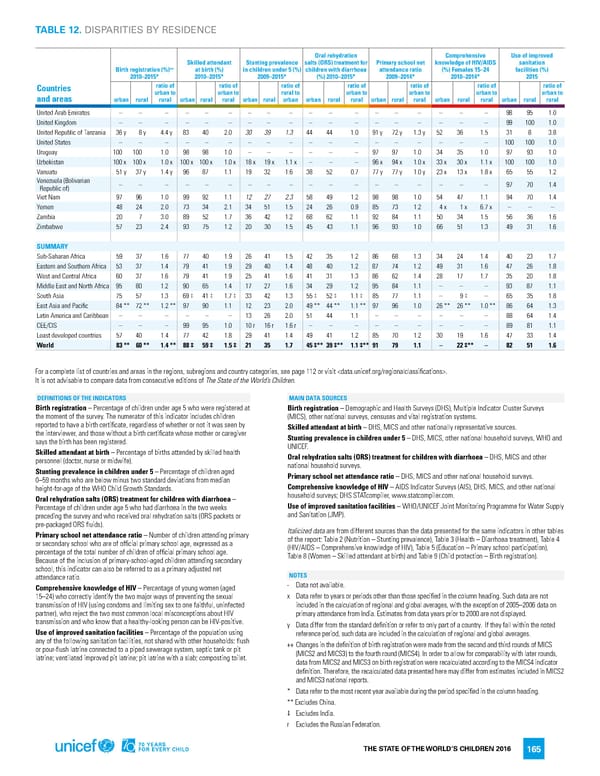
TABLE 12. DISPARITIES BY RESIDENCE Oral rehydration Comprehensive Use of improved Skilled attendant Stunting prevalence salts (ORS) treatment for Primary school net knowledge of HIV/AIDS sanitation ++ at birth (%) in children under 5 (%) children with diarrhoea attendance ratio (%) Females 15–24 facilities (%) Birth registration (%) 2010–2015* 2010–2015* 2009–2015* (%) 2010–2015* 2009–2014* 2010–2014* 2015 Countries ratio of ratio of ratio of ratio of ratio of ratio of ratio of urban to urban to rural to urban to urban to urban to urban to and areas urban rural rural urban rural rural urban rural urban urban rural rural urban rural rural urban rural rural urban rural rural United Arab Emirates – – – – – – – – – – – – – – – – – – 98 95 1.0 United Kingdom – – – – – – – – – – – – – – – – – – 99 100 1.0 United Republic of Tanzania 36y 8y 4.4 y 83 40 2.0 30 39 1.3 44 44 1.0 91y 72y 1.3 y 52 36 1.5 31 8 3.8 United States – – – – – – – – – – – – – – – – – – 100 100 1.0 Uruguay 100 100 1.0 98 98 1.0 – – – – – – 97 97 1.0 34 35 1.0 97 93 1.0 Uzbekistan 100x 100x 1.0 x 100x 100x 1.0 x 18x 19x 1.1 x – – – 96x 94x 1.0 x 33x 30x 1.1 x 100 100 1.0 Vanuatu 51y 37y 1.4 y 96 87 1.1 19 32 1.6 38 52 0.7 77y 77y 1.0 y 23x 13x 1.8 x 65 55 1.2 Venezuela (Bolivarian – – – – – – – – – – – – – – – – – – 97 70 1.4 Republic of) Viet Nam 97 96 1.0 99 92 1.1 12 27 2.3 58 49 1.2 98 98 1.0 54 47 1.1 94 70 1.4 Yemen 48 24 2.0 73 34 2.1 34 51 1.5 24 26 0.9 85 73 1.2 4x 1x 6.7 x – – – Zambia 20 7 3.0 89 52 1.7 36 42 1.2 68 62 1.1 92 84 1.1 50 34 1.5 56 36 1.6 Zimbabwe 57 23 2.4 93 75 1.2 20 30 1.5 45 43 1.1 96 93 1.0 66 51 1.3 49 31 1.6 SUMMARY Sub-Saharan Africa 59 37 1.6 77 40 1.9 26 41 1.5 42 35 1.2 86 68 1.3 34 24 1.4 40 23 1.7 Eastern and Southern Africa 53 37 1.4 79 41 1.9 29 40 1.4 48 40 1.2 87 74 1.2 49 31 1.6 47 26 1.8 est and Central Africa 60 37 1.6 79 41 1.9 25 41 1.6 41 31 1.3 86 62 1.4 28 17 1.7 35 20 1.8 W Middle East and North Africa 95 80 1.2 90 65 1.4 17 27 1.6 34 29 1.2 95 84 1.1 – – – 93 87 1.1 South Asia 75 57 1.3 69‡ 41‡ 1.7 ‡ 33 42 1.3 55‡ 52‡ 1.1 ‡ 85 77 1.1 – 9‡ – 65 35 1.8 East Asia and Pacific 84** 72** 1.2 ** 97 90 1.1 12 23 2.0 49** 44** 1.1 ** 97 96 1.0 26** 26** 1.0 ** 86 64 1.3 Latin America and Caribbean – – – – – – 13 26 2.0 51 44 1.1 – – – – – – 88 64 1.4 CEE/CIS – – – 99 95 1.0 10r 16r 1.6 r – – – – – – – – – 89 81 1.1 Least developed countries 57 40 1.4 77 42 1.8 29 41 1.4 49 41 1.2 85 70 1.2 30 19 1.6 47 33 1.4 World 83** 60** 1.4 ** 88‡ 59‡ 1.5 ‡ 21 35 1.7 45‡** 39‡** 1.1 ‡** 91 79 1.1 – 22‡** – 82 51 1.6 For a complete list of countries and areas in the regions, subregions and country categories, see page 112 or visit . It is not advisable to compare data from consecutive editions of The State of the World’s Children. DEFINITIONS OF THE INDICATORS MAIN DATA SOURCES Birth registration – Percentage of children under age 5 who were registered at Birth registration – Demographic and Health Surveys (DHS), Multiple Indicator Cluster Surveys the moment of the survey. The numerator of this indicator includes children (MICS), other national surveys, censuses and vital registration systems. reported to have a birth certificate, regardless of whether or not it was seen by Skilled attendant at birth – DHS, MICS and other nationally representative sources. the interviewer, and those without a birth certificate whose mother or caregiver Stunting prevalence in children under 5 – DHS, MICS, other national household surveys, WHO and says the birth has been registered. UNICEF. Skilled attendant at birth – Percentage of births attended by skilled health Oral rehydration salts (ORS) treatment for children with diarrhoea – DHS, MICS and other personnel (doctor, nurse or midwife). national household surveys. Stunting prevalence in children under 5 – Percentage of children aged Primary school net attendance ratio – DHS, MICS and other national household surveys. 0–59 months who are below minus two standard deviations from median height-for-age of the WHO Child Growth Standards. Comprehensive knowledge of HIV – AIDS Indicator Surveys (AIS), DHS, MICS, and other national Oral rehydration salts (ORS) treatment for children with diarrhoea – household surveys; DHS STATcompiler, www.statcompiler.com. Percentage of children under age 5 who had diarrhoea in the two weeks Use of improved sanitation facilities – WHO/UNICEF Joint Monitoring Programme for Water Supply preceding the survey and who received oral rehydration salts (ORS packets or and Sanitation (JMP). pre-packaged ORS fluids). Italicized data are from different sources than the data presented for the same indicators in other tables Primary school net attendance ratio – Number of children attending primary of the report: Table 2 (Nutrition – Stunting prevalence), Table 3 (Health – Diarrhoea treatment), Table 4 or secondary school who are of official primary school age, expressed as a (HIV/AIDS – Comprehensive knowledge of HIV), Table 5 (Education – Primary school participation), percentage of the total number of children of official primary school age. Table 8 (Women – Skilled attendant at birth) and Table 9 (Child protection – Birth registration). Because of the inclusion of primary-school-aged children attending secondary school, this indicator can also be referred to as a primary adjusted net attendance ratio. NOTES Comprehensive knowledge of HIV – Percentage of young women (aged - Data not available. 15–24) who correctly identify the two major ways of preventing the sexual x Data refer to years or periods other than those specified in the column heading. Such data are not transmission of HIV (using condoms and limiting sex to one faithful, uninfected included in the calculation of regional and global averages, with the exception of 2005–2006 data on partner), who reject the two most common local misconceptions about HIV primary attendance from India. Estimates from data years prior to 2000 are not displayed. transmission and who know that a healthy-looking person can be HIV-positive. y Data differ from the standard definition or refer to only part of a country. If they fall within the noted Use of improved sanitation facilities – Percentage of the population using reference period, such data are included in the calculation of regional and global averages. any of the following sanitation facilities, not shared with other households: flush ++ Changes in the definition of birth registration were made from the second and third rounds of MICS or pour-flush latrine connected to a piped sewerage system, septic tank or pit (MICS2 and MICS3) to the fourth round (MICS4). In order to allow for comparability with later rounds, latrine; ventilated improved pit latrine; pit latrine with a slab; composting toilet. data from MICS2 and MICS3 on birth registration were recalculated according to the MICS4 indicator definition. Therefore, the recalculated data presented here may differ from estimates included in MICS2 and MICS3 national reports. * Data refer to the most recent year available during the period specified in the column heading. ** Excludes China. ‡ Excludes India. r Excludes the Russian Federation. THE STATE OF THE WORLD’S CHILDREN 2016 165
 70 Years for Every Child Page 183 Page 185