
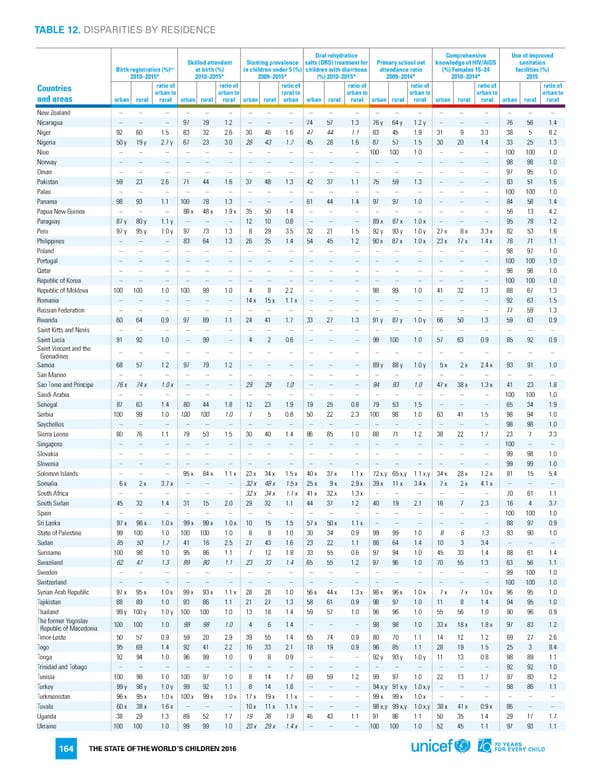
TABLE 12. DISPARITIES BY RESIDENCE Oral rehydration Comprehensive Use of improved Skilled attendant Stunting prevalence salts (ORS) treatment for Primary school net knowledge of HIV/AIDS sanitation ++ at birth (%) in children under 5 (%) children with diarrhoea attendance ratio (%) Females 15–24 facilities (%) Birth registration (%) 2010–2015* 2010–2015* 2009–2015* (%) 2010–2015* 2009–2014* 2010–2014* 2015 Countries ratio of ratio of ratio of ratio of ratio of ratio of ratio of urban to urban to rural to urban to urban to urban to urban to and areas urban rural rural urban rural rural urban rural urban urban rural rural urban rural rural urban rural rural urban rural rural New Zealand – – – – – – – – – – – – – – – – – – – – – Nicaragua – – – 97 79 1.2 – – – 74 57 1.3 76y 64y 1.2 y – – – 76 56 1.4 Niger 92 60 1.5 83 32 2.6 30 46 1.6 47 44 1.1 83 45 1.9 31 9 3.3 38 5 8.2 Nigeria 50y 19y 2.7 y 67 23 3.0 26 43 1.7 45 28 1.6 87 57 1.5 30 20 1.4 33 25 1.3 Niue – – – – – – – – – – – – 100 100 1.0 – – – 100 100 1.0 Norway – – – – – – – – – – – – – – – – – – 98 98 1.0 Oman – – – – – – – – – – – – – – – – – – 97 95 1.0 Pakistan 59 23 2.6 71 44 1.6 37 48 1.3 42 37 1.1 75 59 1.3 – – – 83 51 1.6 Palau – – – – – – – – – – – – – – – – – – 100 100 1.0 Panama 98 93 1.1 100 78 1.3 – – – 61 44 1.4 97 97 1.0 – – – 84 58 1.4 Papua New Guinea – – – 88x 48x 1.9 x 35 50 1.4 – – – – – – – – – 56 13 4.2 Paraguay 87y 80y 1.1 y – – – 12 10 0.8 – – – 89x 87x 1.0 x – – – 95 78 1.2 Peru 97y 95y 1.0 y 97 73 1.3 8 29 3.5 32 21 1.5 92y 93y 1.0 y 27x 8x 3.3 x 82 53 1.6 Philippines – – – 83 64 1.3 26 35 1.4 54 45 1.2 90x 87x 1.0 x 23x 17x 1.4 x 78 71 1.1 Poland – – – – – – – – – – – – – – – – – – 98 97 1.0 Portugal – – – – – – – – – – – – – – – – – – 100 100 1.0 Qatar – – – – – – – – – – – – – – – – – – 98 98 1.0 Republic of Korea – – – – – – – – – – – – – – – – – – 100 100 1.0 Republic of Moldova 100 100 1.0 100 99 1.0 4 8 2.2 – – – 98 99 1.0 41 32 1.3 88 67 1.3 Romania – – – – – – 14x 15x 1.1 x – – – – – – – – – 92 63 1.5 Russian Federation – – – – – – – – – – – – – – – – – – 77 59 1.3 Rwanda 60 64 0.9 97 89 1.1 24 41 1.7 33 27 1.3 91y 87y 1.0 y 66 50 1.3 59 63 0.9 Saint Kitts and Nevis – – – – – – – – – – – – – – – – – – – – – Saint Lucia 91 92 1.0 – 99 – 4 2 0.6 – – – 99 100 1.0 57 63 0.9 85 92 0.9 Saint Vincent and the – – – – – – – – – – – – – – – – – – – – – Grenadines Samoa 68 57 1.2 97 79 1.2 – – – – – – 89y 88y 1.0 y 5x 2x 2.4 x 93 91 1.0 San Marino – – – – – – – – – – – – – – – – – – – – – Sao Tome and Principe 76x 74x 1.0 x – – – 29 29 1.0 – – – 94 93 1.0 47x 38x 1.3 x 41 23 1.8 Saudi Arabia – – – – – – – – – – – – – – – – – – 100 100 1.0 Senegal 87 63 1.4 80 44 1.8 12 23 1.9 19 25 0.8 79 53 1.5 – – – 65 34 1.9 Serbia 100 99 1.0 100 100 1.0 7 5 0.8 50 22 2.3 100 98 1.0 63 41 1.5 98 94 1.0 Seychelles – – – – – – – – – – – – – – – – – – 98 98 1.0 Sierra Leone 80 76 1.1 79 53 1.5 30 40 1.4 86 85 1.0 88 71 1.2 38 22 1.7 23 7 3.3 Singapore – – – – – – – – – – – – – – – – – – 100 – – Slovakia – – – – – – – – – – – – – – – – – – 99 98 1.0 Slovenia – – – – – – – – – – – – – – – – – – 99 99 1.0 Solomon Islands – – – 95x 84x 1.1 x 23x 34x 1.5 x 40x 37x 1.1 x 72x,y 65x,y 1.1 x,y 34x 28x 1.2 x 81 15 5.4 Somalia 6x 2x 3.7 x – – – 32x 48x 1.5 x 25x 9x 2.9 x 39x 11x 3.4 x 7x 2x 4.1 x – – – South Africa – – – – – – 32x 34x 1.1 x 41x 32x 1.3 x – – – – – – 70 61 1.1 South Sudan 45 32 1.4 31 15 2.0 29 32 1.1 44 37 1.2 40 19 2.1 16 7 2.3 16 4 3.7 Spain – – – – – – – – – – – – – – – – – – 100 100 1.0 Sri Lanka 97x 98x 1.0 x 99x 99x 1.0 x 10 15 1.5 57x 50x 1.1 x – – – – – – 88 97 0.9 State of Palestine 99 100 1.0 100 100 1.0 8 8 1.0 30 34 0.9 99 99 1.0 8 6 1.3 93 90 1.0 Sudan 85 50 1.7 41 16 2.5 27 43 1.6 23 22 1.1 86 64 1.4 10 3 3.4 – – – Suriname 100 98 1.0 95 86 1.1 7 12 1.8 33 55 0.6 97 94 1.0 45 33 1.4 88 61 1.4 Swaziland 62 47 1.3 89 80 1.1 23 33 1.4 65 55 1.2 97 96 1.0 70 55 1.3 63 56 1.1 Sweden – – – – – – – – – – – – – – – – – – 99 100 1.0 Switzerland – – – – – – – – – – – – – – – – – – 100 100 1.0 Syrian Arab Republic 97x 95x 1.0 x 99x 93x 1.1 x 28 28 1.0 56x 44x 1.3 x 98x 96x 1.0 x 7x 7x 1.0 x 96 95 1.0 Tajikistan 88 89 1.0 93 86 1.1 21 27 1.3 58 61 0.9 98 97 1.0 11 8 1.4 94 95 1.0 Thailand 99y 100y 1.0 y 100 100 1.0 13 18 1.4 59 57 1.0 96 96 1.0 55 56 1.0 90 96 0.9 The former Yugoslav 100 100 1.0 98 98 1.0 4 6 1.4 – – – 98 98 1.0 33x 18x 1.8 x 97 83 1.2 Republic of Macedonia Timor-Leste 50 57 0.9 59 20 2.9 39 55 1.4 65 74 0.9 80 70 1.1 14 12 1.2 69 27 2.6 Togo 95 69 1.4 92 41 2.2 16 33 2.1 18 19 0.9 96 85 1.1 28 19 1.5 25 3 8.4 Tonga 92 94 1.0 96 99 1.0 9 8 0.9 – – – 92y 93y 1.0 y 11 13 0.8 98 89 1.1 Trinidad and Tobago – – – – – – – – – – – – – – – – – – 92 92 1.0 Tunisia 100 98 1.0 100 97 1.0 8 14 1.7 69 59 1.2 99 97 1.0 22 13 1.7 97 80 1.2 Turkey 99y 98y 1.0 y 99 92 1.1 8 14 1.8 – – – 94x,y 91x,y 1.0 x,y – – – 98 86 1.1 Turkmenistan 96x 95x 1.0 x 100x 99x 1.0 x 17x 19x 1.1 x – – – 99x 99x 1.0 x – – – – – – Tuvalu 60x 38x 1.6 x – – – 10x 11x 1.1 x – – – 98x,y 99x,y 1.0 x,y 38x 41x 0.9 x 86 – – 89 52 1.7 19 36 1.9 46 43 1.1 91 86 1.1 50 35 1.4 29 17 1.7 Uganda 38 29 1.3 Ukraine 100 100 1.0 99 99 1.0 20x 29x 1.4 x – – – 100 100 1.0 52 45 1.1 97 93 1.1 THE STATE OF THE WORLD’S CHILDREN 2016 164
 70 Years for Every Child Page 182 Page 184