
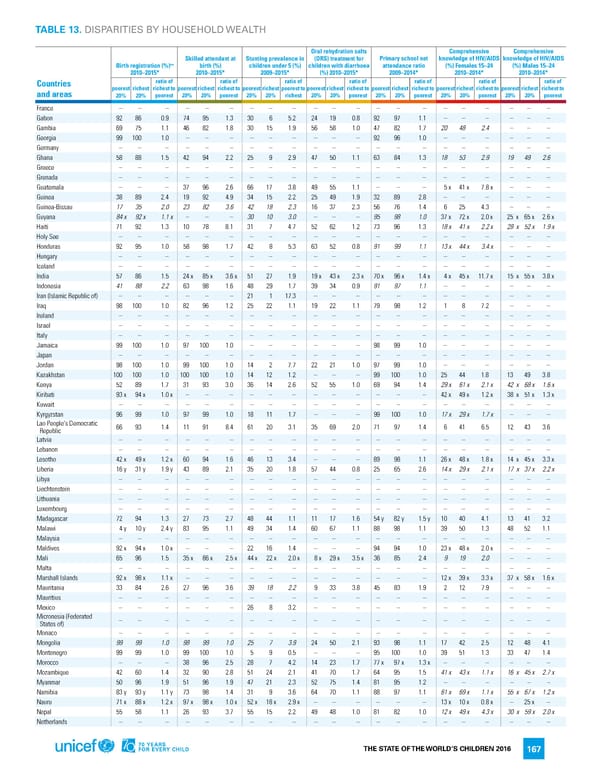
TABLE 13. DISPARITIES BY HOUSEHOLD WEALTH Oral rehydration salts Comprehensive Comprehensive Skilled attendant at Stunting prevalence in (ORS) treatment for Primary school net knowledge of HIV/AIDS knowledge of HIV/AIDS ++ birth (%) children under 5 (%) children with diarrhoea attendance ratio (%) Females 15–24 (%) Males 15–24 Birth registration (%) 2010–2015* 2010–2015* 2009–2015* (%) 2010–2015* 2009–2014* 2010–2014* 2010–2014* Countries ratio of ratio of ratio of ratio of ratio of ratio of ratio of and areas poorest richest richest to poorest richest richest to poorest richest poorest to poorest richest richest to poorest richest richest to poorest richest richest to poorest richest richest to 20% 20% poorest 20% 20% poorest 20% 20% richest 20% 20% poorest 20% 20% poorest 20% 20% poorest 20% 20% poorest France – – – – – – – – – – – – – – – – – – – – – Gabon 92 86 0.9 74 95 1.3 30 6 5.2 24 19 0.8 92 97 1.1 – – – – – – Gambia 69 75 1.1 46 82 1.8 30 15 1.9 56 58 1.0 47 82 1.7 20 48 2.4 – – – Georgia 99 100 1.0 – – – – – – – – – 92 96 1.0 – – – – – – Germany – – – – – – – – – – – – – – – – – – – – – Ghana 58 88 1.5 42 94 2.2 25 9 2.9 47 50 1.1 63 84 1.3 18 53 2.9 19 49 2.6 Greece – – – – – – – – – – – – – – – – – – – – – Grenada – – – – – – – – – – – – – – – – – – – – – Guatemala – – – 37 96 2.6 66 17 3.8 49 55 1.1 – – – 5x 41x 7.8 x – – – Guinea 38 89 2.4 19 92 4.9 34 15 2.2 25 49 1.9 32 89 2.8 – – – – – – Guinea-Bissau 17 35 2.0 23 82 3.6 42 18 2.3 16 37 2.3 56 76 1.4 6 25 4.3 – – – Guyana 84x 92x 1.1 x – – – 30 10 3.0 – – – 95 98 1.0 37x 72x 2.0 x 25 x 65x 2.6 x Haiti 71 92 1.3 10 78 8.1 31 7 4.7 52 62 1.2 73 96 1.3 18x 41x 2.2 x 28 x 52x 1.9 x Holy See – – – – – – – – – – – – – – – – – – – – – Honduras 92 95 1.0 58 98 1.7 42 8 5.3 63 52 0.8 91 99 1.1 13x 44x 3.4 x – – – Hungary – – – – – – – – – – – – – – – – – – – – – Iceland – – – – – – – – – – – – – – – – – – – – – India 57 86 1.5 24x 85x 3.6 x 51 27 1.9 19x 43x 2.3 x 70x 96x 1.4 x 4x 45x 11.7 x 15 x 55x 3.8 x Indonesia 41 88 2.2 63 98 1.6 48 29 1.7 39 34 0.9 91 97 1.1 – – – – – – Iran (Islamic Republic of) – – – – – – 21 1 17.3 – – – – – – – – – – – – Iraq 98 100 1.0 82 96 1.2 25 22 1.1 19 22 1.1 79 98 1.2 1 8 7.2 – – – Ireland – – – – – – – – – – – – – – – – – – – – – Israel – – – – – – – – – – – – – – – – – – – – – Italy – – – – – – – – – – – – – – – – – – – – – Jamaica 99 100 1.0 97 100 1.0 – – – – – – 98 99 1.0 – – – – – – Japan – – – – – – – – – – – – – – – – – – – – – Jordan 98 100 1.0 99 100 1.0 14 2 7.7 22 21 1.0 97 99 1.0 – – – – – – Kazakhstan 100 100 1.0 100 100 1.0 14 12 1.2 – – – 99 100 1.0 25 44 1.8 13 49 3.8 Kenya 52 89 1.7 31 93 3.0 36 14 2.6 52 55 1.0 69 94 1.4 29x 61x 2.1 x 42 x 68x 1.6 x Kiribati 93x 94x 1.0 x – – – – – – – – – – – – 42x 49x 1.2 x 38 x 51x 1.3 x Kuwait – – – – – – – – – – – – – – – – – – – – – Kyrgyzstan 96 99 1.0 97 99 1.0 18 11 1.7 – – – 99 100 1.0 17x 29x 1.7 x – – – Lao People's Democratic 66 93 1.4 11 91 8.4 61 20 3.1 35 69 2.0 71 97 1.4 6 41 6.5 12 43 3.6 Republic Latvia – – – – – – – – – – – – – – – – – – – – – Lebanon – – – – – – – – – – – – – – – – – – – – – Lesotho 42x 49x 1.2 x 60 94 1.6 46 13 3.4 – – – 89 98 1.1 26x 48x 1.8 x 14 x 45x 3.3 x Liberia 16y 31y 1.9 y 43 89 2.1 35 20 1.8 57 44 0.8 25 65 2.6 14x 29x 2.1 x 17 x 37x 2.2 x Libya – – – – – – – – – – – – – – – – – – – – – Liechtenstein – – – – – – – – – – – – – – – – – – – – – Lithuania – – – – – – – – – – – – – – – – – – – – – Luxembourg – – – – – – – – – – – – – – – – – – – – – Madagascar 72 94 1.3 27 73 2.7 48 44 1.1 11 17 1.6 54y 82y 1.5 y 10 40 4.1 13 41 3.2 Malawi 4y 10y 2.4 y 83 95 1.1 49 34 1.4 60 67 1.1 88 98 1.1 39 50 1.3 48 52 1.1 Malaysia – – – – – – – – – – – – – – – – – – – – – Maldives 92x 94x 1.0 x – – – 22 16 1.4 – – – 94 94 1.0 23x 48x 2.0 x – – – Mali 65 96 1.5 35x 86x 2.5 x 44x 22x 2.0 x 8x 29x 3.5 x 36 85 2.4 9 19 2.0 – – – Malta – – – – – – – – – – – – – – – – – – – – – Marshall Islands 92x 98x 1.1 x – – – – – – – – – – – – 12x 39x 3.3 x 37 x 58x 1.6 x Mauritania 33 84 2.6 27 96 3.6 39 18 2.2 9 33 3.8 45 83 1.9 2 12 7.9 – – – Mauritius – – – – – – – – – – – – – – – – – – – – – Mexico – – – – – – 26 8 3.2 – – – – – – – – – – – – Micronesia (Federated – – – – – – – – – – – – – – – – – – – – – States of) Monaco – – – – – – – – – – – – – – – – – – – – – Mongolia 99 99 1.0 98 99 1.0 25 7 3.9 24 50 2.1 93 98 1.1 17 42 2.5 12 48 4.1 Montenegro 99 99 1.0 99 100 1.0 5 9 0.5 – – – 95 100 1.0 39 51 1.3 33 47 1.4 Morocco – – – 38 96 2.5 28 7 4.2 14 23 1.7 77x 97x 1.3 x – – – – – – Mozambique 42 60 1.4 32 90 2.8 51 24 2.1 41 70 1.7 64 95 1.5 41x 43x 1.1 x 16 x 45x 2.7 x Myanmar 50 96 1.9 51 96 1.9 47 21 2.3 52 75 1.4 81 95 1.2 – – – – – – Namibia 83y 93y 1.1 y 73 98 1.4 31 9 3.6 64 70 1.1 88 97 1.1 61x 69x 1.1 x 55 x 67x 1.2 x Nauru 71x 88x 1.2 x 97x 98x 1.0 x 52x 18x 2.9 x – – – – – – 13x 10x 0.8 x – 25x – Nepal 55 58 1.1 26 93 3.7 55 15 2.2 49 48 1.0 81 82 1.0 12x 49x 4.3 x 30 x 59x 2.0 x Netherlands – – – – – – – – – – – – – – – – – – – – – THE STATE OF THE WORLD’S CHILDREN 2016 167
 70 Years for Every Child Page 185 Page 187