
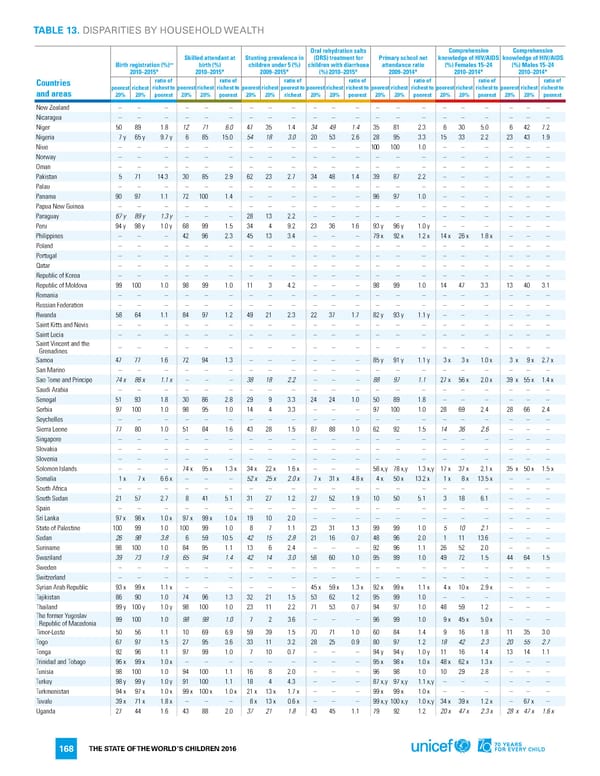
TABLE 13. DISPARITIES BY HOUSEHOLD WEALTH Oral rehydration salts Comprehensive Comprehensive Skilled attendant at Stunting prevalence in (ORS) treatment for Primary school net knowledge of HIV/AIDS knowledge of HIV/AIDS ++ birth (%) children under 5 (%) children with diarrhoea attendance ratio (%) Females 15–24 (%) Males 15–24 Birth registration (%) 2010–2015* 2010–2015* 2009–2015* (%) 2010–2015* 2009–2014* 2010–2014* 2010–2014* Countries ratio of ratio of ratio of ratio of ratio of ratio of ratio of and areas poorest richest richest to poorest richest richest to poorest richest poorest to poorest richest richest to poorest richest richest to poorest richest richest to poorest richest richest to 20% 20% poorest 20% 20% poorest 20% 20% richest 20% 20% poorest 20% 20% poorest 20% 20% poorest 20% 20% poorest New Zealand – – – – – – – – – – – – – – – – – – – – – Nicaragua – – – – – – – – – – – – – – – – – – – – – Niger 50 89 1.8 12 71 6.0 47 35 1.4 34 49 1.4 35 81 2.3 6 30 5.0 6 42 7.2 Nigeria 7y 65y 9.7 y 6 85 15.0 54 18 3.0 20 53 2.6 28 95 3.3 15 33 2.2 23 43 1.9 Niue – – – – – – – – – – – – 100 100 1.0 – – – – – – Norway – – – – – – – – – – – – – – – – – – – – – Oman – – – – – – – – – – – – – – – – – – – – – Pakistan 5 71 14.3 30 85 2.9 62 23 2.7 34 48 1.4 39 87 2.2 – – – – – – Palau – – – – – – – – – – – – – – – – – – – – – Panama 90 97 1.1 72 100 1.4 – – – – – – 96 97 1.0 – – – – – – Papua New Guinea – – – – – – – – – – – – – – – – – – – – – Paraguay 67y 89y 1.3 y – – – 28 13 2.2 – – – – – – – – – – – – Peru 94y 98y 1.0 y 68 99 1.5 34 4 9.2 23 36 1.6 93y 96y 1.0 y – – – – – – Philippines – – – 42 96 2.3 45 13 3.4 – – – 79x 92x 1.2 x 14x 26x 1.8 x – – – Poland – – – – – – – – – – – – – – – – – – – – – Portugal – – – – – – – – – – – – – – – – – – – – – Qatar – – – – – – – – – – – – – – – – – – – – – Republic of Korea – – – – – – – – – – – – – – – – – – – – – Republic of Moldova 99 100 1.0 98 99 1.0 11 3 4.2 – – – 98 99 1.0 14 47 3.3 13 40 3.1 Romania – – – – – – – – – – – – – – – – – – – – – Russian Federation – – – – – – – – – – – – – – – – – – – – – Rwanda 58 64 1.1 84 97 1.2 49 21 2.3 22 37 1.7 82y 93y 1.1 y – – – – – – Saint Kitts and Nevis – – – – – – – – – – – – – – – – – – – – – Saint Lucia – – – – – – – – – – – – – – – – – – – – – Saint Vincent and the – – – – – – – – – – – – – – – – – – – – – Grenadines Samoa 47 77 1.6 72 94 1.3 – – – – – – 85y 91y 1.1 y 3x 3x 1.0 x 3 x 9x 2.7 x San Marino – – – – – – – – – – – – – – – – – – – – – Sao Tome and Principe 74x 86x 1.1 x – – – 38 18 2.2 – – – 88 97 1.1 27x 56x 2.0 x 39 x 55x 1.4 x Saudi Arabia – – – – – – – – – – – – – – – – – – – – – Senegal 51 93 1.8 30 86 2.8 29 9 3.3 24 24 1.0 50 89 1.8 – – – – – – Serbia 97 100 1.0 98 95 1.0 14 4 3.3 – – – 97 100 1.0 28 69 2.4 28 66 2.4 Seychelles – – – – – – – – – – – – – – – – – – – – – Sierra Leone 77 80 1.0 51 84 1.6 43 28 1.5 87 88 1.0 62 92 1.5 14 36 2.6 – – – Singapore – – – – – – – – – – – – – – – – – – – – – Slovakia – – – – – – – – – – – – – – – – – – – – – Slovenia – – – – – – – – – – – – – – – – – – – – – Solomon Islands – – – 74x 95x 1.3 x 34x 22x 1.6 x – – – 58x,y 78x,y 1.3 x,y 17x 37x 2.1 x 35 x 50x 1.5 x Somalia 1x 7x 6.6 x – – – 52x 25x 2.0 x 7x 31x 4.8 x 4x 50x 13.2 x 1x 8x 13.5 x – – – South Africa – – – – – – – – – – – – – – – – – – – – – South Sudan 21 57 2.7 8 41 5.1 31 27 1.2 27 52 1.9 10 50 5.1 3 18 6.1 – – – Spain – – – – – – – – – – – – – – – – – – – – – Sri Lanka 97x 98x 1.0 x 97x 99x 1.0 x 19 10 2.0 – – – – – – – – – – – – State of Palestine 100 99 1.0 100 99 1.0 8 7 1.1 23 31 1.3 99 99 1.0 5 10 2.1 – – – Sudan 26 98 3.8 6 59 10.5 42 15 2.8 21 16 0.7 48 96 2.0 1 11 13.6 – – – Suriname 98 100 1.0 84 95 1.1 13 6 2.4 – – – 92 96 1.1 26 52 2.0 – – – Swaziland 39 73 1.9 65 94 1.4 42 14 3.0 58 60 1.0 95 99 1.0 49 72 1.5 44 64 1.5 Sweden – – – – – – – – – – – – – – – – – – – – – Switzerland – – – – – – – – – – – – – – – – – – – – – Syrian Arab Republic 93x 99x 1.1 x – – – – – – 45x 59x 1.3 x 92x 99x 1.1 x 4x 10x 2.9 x – – – ajikistan 86 90 1.0 74 96 1.3 32 21 1.5 53 62 1.2 95 99 1.0 – – – – – – T Thailand 99y 100y 1.0 y 98 100 1.0 23 11 2.2 71 53 0.7 94 97 1.0 48 59 1.2 – – – The former Yugoslav 99 100 1.0 98 98 1.0 7 2 3.6 – – – 96 99 1.0 9x 45x 5.0 x – – – Republic of Macedonia Timor-Leste 50 56 1.1 10 69 6.9 59 39 1.5 70 71 1.0 60 84 1.4 9 16 1.8 11 35 3.0 Togo 67 97 1.5 27 95 3.6 33 11 3.2 28 25 0.9 80 97 1.2 18 42 2.3 20 55 2.7 Tonga 92 96 1.1 97 99 1.0 7 10 0.7 – – – 94y 94y 1.0 y 11 16 1.4 13 14 1.1 Trinidad and Tobago 96x 99x 1.0 x – – – – – – – – – 95x 98x 1.0 x 48x 62x 1.3 x – – – Tunisia 98 100 1.0 94 100 1.1 16 8 2.0 – – – 96 98 1.0 10 29 2.8 – – – Turkey 98y 99y 1.0 y 91 100 1.1 18 4 4.3 – – – 87x,y 97x,y 1.1 x,y – – – – – – Turkmenistan 94x 97x 1.0 x 99x 100x 1.0 x 21x 13x 1.7 x – – – 99x 99x 1.0 x – – – – – – Tuvalu 39x 71x 1.8 x – – – 8x 13x 0.6 x – – – 99x,y 100x,y 1.0 x,y 34x 39x 1.2 x – 67x – Uganda 27 44 1.6 43 88 2.0 37 21 1.8 43 45 1.1 79 92 1.2 20x 47x 2.3 x 28 x 47x 1.6 x THE STATE OF THE WORLD’S CHILDREN 2016 168
 70 Years for Every Child Page 186 Page 188