
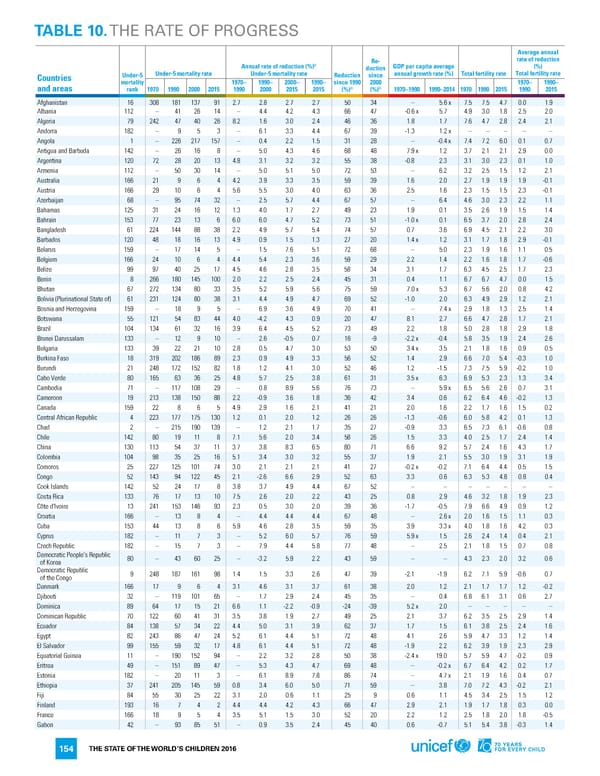
TABLE 10. THE RATE OF PROGRESS Average annual Re- rate of reduction ɵ (%) Annual rate of reduction (%) duction GDP per capita average Countries Under-5 Under-5 mortality rate Under-5 mortality rate Reduction since annual growth rate (%) Total fertility rate Total fertility rate mortality 1970– 1990– 2000– 1990– since 1990 2000 1970– 1990– ɵ ɵ and areas rank 1970 1990 2000 2015 1990 2000 2015 2015 (%) (%) 1970–1990 1990–2014 1970 1990 2015 1990 2015 Afghanistan 16 308 181 137 91 2.7 2.8 2.7 2.7 50 34 – 5.6 x 7.5 7.5 4.7 0.0 1.9 Albania 112 – 41 26 14 – 4.4 4.2 4.3 66 47 -0.6 x 5.7 4.9 3.0 1.8 2.5 2.0 Algeria 79 242 47 40 26 8.2 1.6 3.0 2.4 46 36 1.8 1.7 7.6 4.7 2.8 2.4 2.1 Andorra 182 – 9 5 3 – 6.1 3.3 4.4 67 39 -1.3 1.2 x – – – – – Angola 1 – 226 217 157 – 0.4 2.2 1.5 31 28 – -0.4 x 7.4 7.2 6.0 0.1 0.7 Antigua and Barbuda 142 – 26 16 8 – 5.0 4.3 4.6 68 48 7.9 x 1.2 3.7 2.1 2.1 2.9 0.0 Argentina 120 72 28 20 13 4.8 3.1 3.2 3.2 55 38 -0.8 2.3 3.1 3.0 2.3 0.1 1.0 Armenia 112 – 50 30 14 – 5.0 5.1 5.0 72 53 – 6.2 3.2 2.5 1.5 1.2 2.1 Australia 166 21 9 6 4 4.2 3.9 3.3 3.5 59 39 1.6 2.0 2.7 1.9 1.9 1.9 -0.1 Austria 166 29 10 6 4 5.6 5.5 3.0 4.0 63 36 2.5 1.6 2.3 1.5 1.5 2.3 -0.1 Azerbaijan 68 – 95 74 32 – 2.5 5.7 4.4 67 57 – 6.4 4.6 3.0 2.3 2.2 1.1 Bahamas 125 31 24 16 12 1.3 4.0 1.7 2.7 49 23 1.9 0.1 3.5 2.6 1.9 1.5 1.4 Bahrain 153 77 23 13 6 6.0 6.0 4.7 5.2 73 51 -1.0 x 0.1 6.5 3.7 2.0 2.8 2.4 Bangladesh 61 224 144 88 38 2.2 4.9 5.7 5.4 74 57 0.7 3.6 6.9 4.5 2.1 2.2 3.0 Barbados 120 48 18 16 13 4.9 0.9 1.5 1.3 27 20 1.4 x 1.2 3.1 1.7 1.8 2.9 -0.1 Belarus 159 – 17 14 5 – 1.5 7.6 5.1 72 68 – 5.0 2.3 1.9 1.6 1.1 0.5 Belgium 166 24 10 6 4 4.4 5.4 2.3 3.6 59 29 2.2 1.4 2.2 1.6 1.8 1.7 -0.6 Belize 99 97 40 25 17 4.5 4.6 2.8 3.5 58 34 3.1 1.7 6.3 4.5 2.5 1.7 2.3 Benin 8 266 180 145 100 2.0 2.2 2.5 2.4 45 31 0.4 1.1 6.7 6.7 4.7 0.0 1.5 Bhutan 67 272 134 80 33 3.5 5.2 5.9 5.6 75 59 7.0 x 5.3 6.7 5.6 2.0 0.8 4.2 Bolivia (Plurinational State of) 61 231 124 80 38 3.1 4.4 4.9 4.7 69 52 -1.0 2.0 6.3 4.9 2.9 1.2 2.1 Bosnia and Herzegovina 159 – 18 9 5 – 6.9 3.6 4.9 70 41 – 7.4 x 2.9 1.8 1.3 2.5 1.4 Botswana 55 121 54 83 44 4.0 -4.2 4.3 0.9 20 47 8.1 2.7 6.6 4.7 2.8 1.7 2.1 Brazil 104 134 61 32 16 3.9 6.4 4.5 5.2 73 49 2.2 1.8 5.0 2.8 1.8 2.9 1.8 Brunei Darussalam 133 – 12 9 10 – 2.6 -0.5 0.7 16 -9 -2.2 x -0.4 5.8 3.5 1.9 2.4 2.6 Bulgaria 133 39 22 21 10 2.8 0.5 4.7 3.0 53 50 3.4 x 3.5 2.1 1.8 1.6 0.9 0.5 Burkina Faso 18 319 202 186 89 2.3 0.9 4.9 3.3 56 52 1.4 2.9 6.6 7.0 5.4 -0.3 1.0 Burundi 21 248 172 152 82 1.8 1.2 4.1 3.0 52 46 1.2 -1.5 7.3 7.5 5.9 -0.2 1.0 Cabo Verde 80 165 63 36 25 4.8 5.7 2.5 3.8 61 31 3.5 x 6.3 6.9 5.3 2.3 1.3 3.4 Cambodia 71 – 117 108 29 – 0.8 8.9 5.6 76 73 – 5.9 x 6.5 5.6 2.6 0.7 3.1 Cameroon 19 213 138 150 88 2.2 -0.9 3.6 1.8 36 42 3.4 0.6 6.2 6.4 4.6 -0.2 1.3 Canada 159 22 8 6 5 4.9 2.9 1.6 2.1 41 21 2.0 1.6 2.2 1.7 1.6 1.5 0.2 Central African Republic 4 223 177 175 130 1.2 0.1 2.0 1.2 26 26 -1.3 -0.6 6.0 5.8 4.2 0.1 1.3 Chad 2 – 215 190 139 – 1.2 2.1 1.7 35 27 -0.9 3.3 6.5 7.3 6.1 -0.6 0.8 Chile 142 80 19 11 8 7.1 5.6 2.0 3.4 58 26 1.5 3.3 4.0 2.5 1.7 2.4 1.4 China 130 113 54 37 11 3.7 3.8 8.3 6.5 80 71 6.6 9.2 5.7 2.4 1.6 4.3 1.7 Colombia 104 98 35 25 16 5.1 3.4 3.0 3.2 55 37 1.9 2.1 5.5 3.0 1.9 3.1 1.9 Comoros 25 227 125 101 74 3.0 2.1 2.1 2.1 41 27 -0.2 x -0.2 7.1 6.4 4.4 0.5 1.5 Congo 52 143 94 122 45 2.1 -2.6 6.6 2.9 52 63 3.3 0.6 6.3 5.3 4.8 0.8 0.4 Cook Islands 142 52 24 17 8 3.8 3.7 4.9 4.4 67 52 – – – – – – – Costa Rica 133 76 17 13 10 7.5 2.6 2.0 2.2 43 25 0.8 2.9 4.6 3.2 1.8 1.9 2.3 Côte d'Ivoire 13 241 153 146 93 2.3 0.5 3.0 2.0 39 36 -1.7 -0.5 7.9 6.6 4.9 0.9 1.2 Croatia 166 – 13 8 4 – 4.4 4.4 4.4 67 48 – 2.6 x 2.0 1.6 1.5 1.1 0.3 Cuba 153 44 13 8 6 5.9 4.6 2.8 3.5 59 35 3.9 3.3 x 4.0 1.8 1.6 4.2 0.3 Cyprus 182 – 11 7 3 – 5.2 6.0 5.7 76 59 5.9 x 1.5 2.6 2.4 1.4 0.4 2.1 Czech Republic 182 – 15 7 3 – 7.9 4.4 5.8 77 48 – 2.5 2.1 1.8 1.5 0.7 0.8 Democratic People's Republic 80 – 43 60 25 – -3.2 5.9 2.2 43 59 – – 4.3 2.3 2.0 3.2 0.6 of Korea Democratic Republic 9 248 187 161 98 1.4 1.5 3.3 2.6 47 39 -2.1 -1.9 6.2 7.1 5.9 -0.6 0.7 of the Congo Denmark 166 17 9 6 4 3.1 4.6 3.1 3.7 61 38 2.0 1.2 2.1 1.7 1.7 1.2 -0.2 Djibouti 32 – 119 101 65 – 1.7 2.9 2.4 45 35 – 0.4 6.8 6.1 3.1 0.6 2.7 Dominica 89 64 17 15 21 6.6 1.1 -2.2 -0.9 -24 -39 5.2 x 2.0 – – – – – Dominican Republic 70 122 60 41 31 3.5 3.8 1.9 2.7 49 25 2.1 3.7 6.2 3.5 2.5 2.9 1.4 Ecuador 84 138 57 34 22 4.4 5.0 3.1 3.9 62 37 1.7 1.5 6.1 3.8 2.5 2.4 1.6 Egypt 82 243 86 47 24 5.2 6.1 4.4 5.1 72 48 4.1 2.6 5.9 4.7 3.3 1.2 1.4 El Salvador 99 155 59 32 17 4.8 6.1 4.4 5.1 72 48 -1.9 2.2 6.2 3.9 1.9 2.3 2.9 Equatorial Guinea 11 – 190 152 94 – 2.2 3.2 2.8 50 38 -2.4 x 19.0 5.7 5.9 4.7 -0.2 0.9 Eritrea 49 – 151 89 47 – 5.3 4.3 4.7 69 48 – -0.2 x 6.7 6.4 4.2 0.2 1.7 Estonia 182 – 20 11 3 – 6.1 8.9 7.8 86 74 – 4.7 x 2.1 1.9 1.6 0.4 0.7 Ethiopia 37 241 205 145 59 0.8 3.4 6.0 5.0 71 59 – 3.8 7.0 7.2 4.3 -0.2 2.1 Fiji 84 55 30 25 22 3.1 2.0 0.6 1.1 25 9 0.6 1.1 4.5 3.4 2.5 1.5 1.2 Finland 193 16 7 4 2 4.4 4.4 4.2 4.3 66 47 2.9 2.1 1.9 1.7 1.8 0.3 0.0 France 166 18 9 5 4 3.5 5.1 1.5 3.0 52 20 2.2 1.2 2.5 1.8 2.0 1.8 -0.5 Gabon 42 – 93 85 51 – 0.9 3.5 2.4 45 40 0.6 -0.7 5.1 5.4 3.8 -0.3 1.4 THE STATE OF THE WORLD’S CHILDREN 2016 154
 70 Years for Every Child Page 172 Page 174