
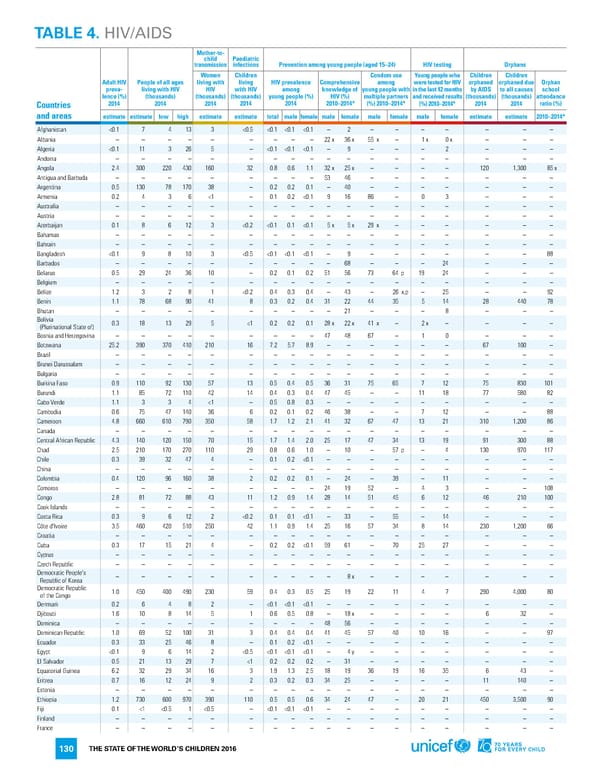
TABLE 4. HIV/AIDS Mother-to- child Paediatric transmission infections Prevention among young people (aged 15–24) HIV testing Orphans Women Children Condom use Young people who Children Children Adult HIV People of all ages living with living HIV prevalence Comprehensive among were tested for HIV orphaned orphaned due Orphan preva- living with HIV HIV with HIV among knowledge of young people with in the last 12 months by AIDS to all causes school lence (%) (thousands) (thousands) (thousands) young people (%) HIV (%) multiple partners and received results (thousands) (thousands) attendance Countries 2014 2014 2014 2014 2014 2010–2014* (%) 2010–2014* (%) 2010–2014* 2014 2014 ratio (%) and areas estimate estimate low high estimate estimate total male female male female male female male female estimate estimate 2010–2014* Afghanistan <0.1 7 4 13 3 <0.5 <0.1 <0.1 <0.1 – 2 – – – – – – – Albania – – – – – – – – – 22x 36x 55 x – 1x 0x – – – Algeria <0.1 11 3 26 5 – <0.1 <0.1 <0.1 – 9 – – – 2 – – – Andorra – – – – – – – – – – – – – – – – – – Angola 2.4 300 220 430 160 32 0.8 0.6 1.1 32x 25x – – – – 120 1,300 85x Antigua and Barbuda – – – – – – – – – 53 46 – – – – – – – Argentina 0.5 130 78 170 38 – 0.2 0.2 0.1 – 40 – – – – – – – Armenia 0.2 4 3 6 <1 – 0.1 0.2 <0.1 9 16 86 – 0 3 – – – Australia – – – – – – – – – – – – – – – – – – Austria – – – – – – – – – – – – – – – – – – Azerbaijan 0.1 8 6 12 3 <0.2 <0.1 0.1 <0.1 5x 5x 29 x – – – – – – Bahamas – – – – – – – – – – – – – – – – – – Bahrain – – – – – – – – – – – – – – – – – – Bangladesh <0.1 9 8 10 3 <0.5 <0.1 <0.1 <0.1 – 9 – – – – – – 88 Barbados – – – – – – – – – – 68 – – – 24 – – – Belarus 0.5 29 24 36 10 – 0.2 0.1 0.2 51 56 73 64 p 19 24 – – – Belgium – – – – – – – – – – – – – – – – – – Belize 1.2 3 2 8 1 <0.2 0.4 0.3 0.4 – 43 – 26 x,p – 25 – – 92 Benin 1.1 78 68 90 41 8 0.3 0.2 0.4 31 22 44 35 5 14 28 440 78 Bhutan – – – – – – – – – – 21 – – – 8 – – – Bolivia 0.3 18 13 29 5 <1 0.2 0.2 0.1 28x 22x 41 x – 2x – – – – (Plurinational State of) Bosnia and Herzegovina – – – – – – – – – 47 48 67 – 1 0 – – – Botswana 25.2 390 370 410 210 16 7.2 5.7 8.9 – – – – – – 67 100 – Brazil – – – – – – – – – – – – – – – – – – Brunei Darussalam – – – – – – – – – – – – – – – – – – Bulgaria – – – – – – – – – – – – – – – – – – Burkina Faso 0.9 110 92 130 57 13 0.5 0.4 0.5 36 31 75 65 7 12 75 830 101 Burundi 1.1 85 72 110 42 14 0.4 0.3 0.4 47 45 – – 11 18 77 580 82 Cabo Verde 1.1 3 3 4 <1 – 0.5 0.8 0.3 – – – – – – – – – Cambodia 0.6 75 47 140 36 6 0.2 0.1 0.2 46 38 – – 7 12 – – 88 Cameroon 4.8 660 610 790 350 58 1.7 1.2 2.1 41 32 67 47 13 21 310 1,200 86 Canada – – – – – – – – – – – – – – – – – – Central African Republic 4.3 140 120 150 70 15 1.7 1.4 2.0 25 17 47 34 13 19 91 300 88 Chad 2.5 210 170 270 110 29 0.8 0.6 1.0 – 10 – 57 p – 4 130 970 117 Chile 0.3 39 32 47 4 – 0.1 0.2 <0.1 – – – – – – – – – China – – – – – – – – – – – – – – – – – – Colombia 0.4 120 96 160 38 2 0.2 0.2 0.1 – 24 – 39 – 11 – – – Comoros – – – – – – – – – 24 19 52 – 4 3 – – 108 Congo 2.8 81 72 88 43 11 1.2 0.9 1.4 28 14 51 45 6 12 46 210 100 Cook Islands – – – – – – – – – – – – – – – – – – Costa Rica 0.3 9 6 12 2 <0.2 0.1 0.1 <0.1 – 33 – 55 – 14 – – – Côte d'Ivoire 3.5 460 420 510 250 42 1.1 0.9 1.4 25 16 57 34 8 14 230 1,200 66 Croatia – – – – – – – – – – – – – – – – – – Cuba 0.3 17 15 21 4 – 0.2 0.2 <0.1 59 61 – 70 25 27 – – – Cyprus – – – – – – – – – – – – – – – – – – Czech Republic – – – – – – – – – – – – – – – – – – Democratic People's – – – – – – – – – – 8x – – – – – – – Republic of Korea Democratic Republic 1.0 450 400 490 230 59 0.4 0.3 0.5 25 19 22 11 4 7 290 4,000 80 of the Congo Denmark 0.2 6 4 8 2 – <0.1 <0.1 <0.1 – – – – – – – – – Djibouti 1.6 10 8 14 5 1 0.6 0.5 0.8 – 18x – – – – 6 32 – Dominica – – – – – – – – – 48 56 – – – – – – – Dominican Republic 1.0 69 52 100 31 3 0.4 0.4 0.4 41 45 57 40 10 16 – – 97 Ecuador 0.3 33 25 46 8 – 0.1 0.2 <0.1 – – – – – – – – – Egypt <0.1 9 6 14 2 <0.5 <0.1 <0.1 <0.1 – 4y – – – – – – – El Salvador 0.5 21 13 29 7 <1 0.2 0.2 0.2 – 31 – – – – – – – Equatorial Guinea 6.2 32 29 34 16 3 1.9 1.3 2.5 18 19 36 19 16 35 6 43 – Eritrea 0.7 16 12 24 9 2 0.3 0.2 0.3 34 25 – – – – 11 140 – Estonia – – – – – – – – – – – – – – – – – – Ethiopia 1.2 730 600 970 390 110 0.5 0.5 0.6 34 24 47 – 20 21 450 3,500 90 Fiji 0.1 <1 <0.5 1 <0.5 – <0.1 <0.1 <0.1 – – – – – – – – – Finland – – – – – – – – – – – – – – – – – – France – – – – – – – – – – – – – – – – – – THE STATE OF THE WORLD’S CHILDREN 2016 130
 70 Years for Every Child Page 148 Page 150