
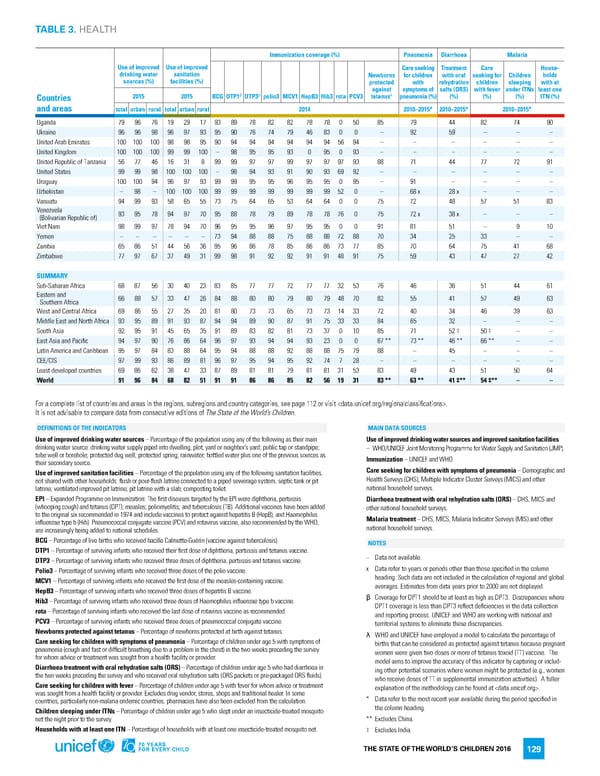
TABLE 3. HEALTH Immunization coverage (%) Pneumonia Diarrhoea Malaria Use of improved Use of improved Care seeking Treatment Care House- drinking water sanitation Newborns for children with oral seeking for Children holds sources (%) facilities (%) protected with rehydration children sleeping with at against symptoms of salts (ORS) with fever under ITNs least one 2015 2015 BCG DTP1β β tetanusλ pneumonia (%) (%) (%) (%) ITN (%) Countries DTP3 polio3 MCV1 HepB3 Hib3 rota PCV3 and areas total urban rural total urban rural 2014 2010–2015* 2010–2015* 2010–2015* Uganda 79 96 76 19 29 17 93 89 78 82 82 78 78 0 50 85 79 44 82 74 90 Ukraine 96 96 98 96 97 93 95 90 76 74 79 46 83 0 0 – 92 59 – – – United Arab Emirates 100 100 100 98 98 95 90 94 94 94 94 94 94 56 94 – – – – – – United Kingdom 100 100 100 99 99 100 – 98 95 95 93 0 95 0 93 – – – – – – United Republic of Tanzania 56 77 46 16 31 8 99 99 97 97 99 97 97 97 93 88 71 44 77 72 91 United States 99 99 98 100 100 100 – 98 94 93 91 90 93 69 92 – – – – – – Uruguay 100 100 94 96 97 93 99 99 95 95 96 95 95 0 95 – 91 – – – – Uzbekistan – 98 – 100 100 100 99 99 99 99 99 99 99 52 0 – 68x 28x – – – Vanuatu 94 99 93 58 65 55 73 75 64 65 53 64 64 0 0 75 72 48 57 51 83 Venezuela 93 95 78 94 97 70 95 88 78 79 89 78 78 76 0 75 72x 38x – – – (Bolivarian Republic of) Viet Nam 98 99 97 78 94 70 96 95 95 96 97 95 95 0 0 91 81 51 – 9 10 Yemen – – – – – – 73 94 88 88 75 88 88 72 88 70 34 25 33 – – Zambia 65 86 51 44 56 36 95 96 86 78 85 86 86 73 77 85 70 64 75 41 68 Zimbabwe 77 97 67 37 49 31 99 98 91 92 92 91 91 48 91 75 59 43 47 27 42 SUMMARY Sub-Saharan Africa 68 87 56 30 40 23 83 85 77 77 72 77 77 32 53 76 46 36 51 44 61 Eastern and 66 88 57 33 47 26 84 88 80 80 79 80 79 48 70 82 55 41 57 49 63 Southern Africa West and Central Africa 69 86 55 27 35 20 81 80 73 73 65 73 73 14 33 72 40 34 46 39 63 Middle East and North Africa 93 95 89 91 93 87 94 94 89 90 87 91 75 33 33 84 65 32 – – – South Asia 92 95 91 45 65 35 91 89 83 82 81 73 37 0 10 85 71 52‡ 50‡ – – East Asia and Pacific 94 97 90 76 86 64 96 97 93 94 94 93 23 0 0 87** 73** 46** 66** – – Latin America and Caribbean 95 97 84 83 88 64 95 94 88 88 92 88 88 75 79 88 – 45 – – – CEE/CIS 97 99 93 86 89 81 96 97 95 94 95 92 74 7 28 – – – – – – Least developed countries 69 86 62 38 47 33 87 89 81 81 79 81 81 31 53 83 49 43 51 50 64 World 91 96 84 68 82 51 91 91 86 86 85 82 56 19 31 83** 63** 41‡** 54‡** – – For a complete list of countries and areas in the regions, subregions and country categories, see page 112 or visit . It is not advisable to compare data from consecutive editions of The State of the World’s Children. DEFINITIONS OF THE INDICATORS MAIN DATA SOURCES Use of improved drinking water sources – Percentage of the population using any of the following as their main Use of improved drinking water sources and improved sanitation facilities drinking water source: drinking water supply piped into dwelling, plot, yard or neighbor’s yard; public tap or standpipe; – WHO/UNICEF Joint Monitoring Programme for Water Supply and Sanitation (JMP). tube well or borehole; protected dug well; protected spring; rainwater; bottled water plus one of the previous sources as Immunization – UNICEF and WHO. their secondary source. Use of improved sanitation facilities – Percentage of the population using any of the following sanitation facilities, Care seeking for children with symptoms of pneumonia – Demographic and not shared with other households: flush or pour-flush latrine connected to a piped sewerage system, septic tank or pit Health Surveys (DHS), Multiple Indicator Cluster Surveys (MICS) and other latrine; ventilated improved pit latrine; pit latrine with a slab; composting toilet. national household surveys. EPI – Expanded Programme on Immunization: The first diseases targeted by the EPI were diphtheria, pertussis Diarrhoea treatment with oral rehydration salts (ORS) – DHS, MICS and (whooping cough) and tetanus (DPT); measles; poliomyelitis; and tuberculosis (TB). Additional vaccines have been added other national household surveys. to the original six recommended in 1974 and include vaccines to protect against hepatitis B (HepB), and Haemophilus Malaria treatment – DHS, MICS, Malaria Indicator Surveys (MIS) and other influenzae type b (Hib). Pneumococcal conjugate vaccine (PCV) and rotavirus vaccine, also recommended by the WHO, national household surveys. are increasingly being added to national schedules. BCG – Percentage of live births who received bacille Calmette-Guérin (vaccine against tuberculosis). NOTES DTP1 – Percentage of surviving infants who received their first dose of diphtheria, pertussis and tetanus vaccine. DTP3 – Percentage of surviving infants who received three doses of diphtheria, pertussis and tetanus vaccine. − Data not available. Polio3 – Percentage of surviving infants who received three doses of the polio vaccine. x Data refer to years or periods other than those specified in the column MCV1 – Percentage of surviving infants who received the first dose of the measles-containing vaccine. heading. Such data are not included in the calculation of regional and global HepB3 – Percentage of surviving infants who received three doses of hepatitis B vaccine. averages. Estimates from data years prior to 2000 are not displayed. Hib3 – Percentage of surviving infants who received three doses of Haemophilus influenzae type b vaccine. β Coverage for DPT1 should be at least as high as DPT3. Discrepancies where rota – Percentage of surviving infants who received the last dose of rotavirus vaccine as recommended. DPT1 coverage is less than DPT3 reflect deficiencies in the data collection and reporting process. UNICEF and WHO are working with national and PCV3 – Percentage of surviving infants who received three doses of pneumococcal conjugate vaccine. territorial systems to eliminate these discrepancies. Newborns protected against tetanus – Percentage of newborns protected at birth against tetanus. λ WHO and UNICEF have employed a model to calculate the percentage of Care seeking for children with symptoms of pneumonia – Percentage of children under age 5 with symptoms of births that can be considered as protected against tetanus because pregnant pneumonia (cough and fast or difficult breathing due to a problem in the chest) in the two weeks preceding the survey women were given two doses or more of tetanus toxoid (TT) vaccine. The for whom advice or treatment was sought from a health facility or provider. model aims to improve the accuracy of this indicator by capturing or includ- Diarrhoea treatment with oral rehydration salts (ORS) – Percentage of children under age 5 who had diarrhoea in ing other potential scenarios where women might be protected (e.g., women the two weeks preceding the survey and who received oral rehydration salts (ORS packets or pre-packaged ORS fluids). who receive doses of TT in supplemental immunization activities). A fuller Care seeking for children with fever – Percentage of children under age 5 with fever for whom advice or treatment explanation of the methodology can be found at . was sought from a health facility or provider. Excludes drug vendor, stores, shops and traditional healer. In some * Data refer to the most recent year available during the period specified in countries, particularly non-malaria endemic countries, pharmacies have also been excluded from the calculation. Children sleeping under ITNs – Percentage of children under age 5 who slept under an insecticide-treated mosquito the column heading. net the night prior to the survey. ** Excludes China. Households with at least one ITN – Percentage of households with at least one insecticide-treated mosquito net. ‡ Excludes India. THE STATE OF THE WORLD’S CHILDREN 2016 129
 70 Years for Every Child Page 147 Page 149