
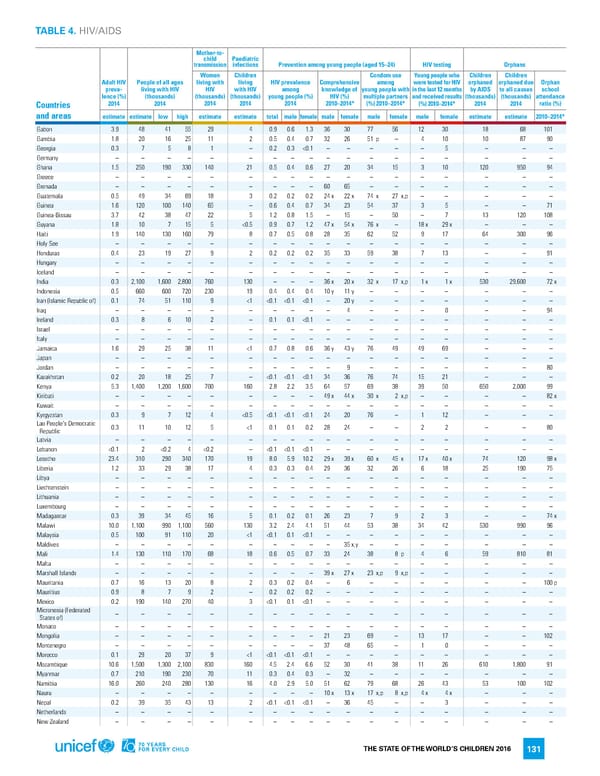
TABLE 4. HIV/AIDS Mother-to- child Paediatric transmission infections Prevention among young people (aged 15–24) HIV testing Orphans Women Children Condom use Young people who Children Children Adult HIV People of all ages living with living HIV prevalence Comprehensive among were tested for HIV orphaned orphaned due Orphan preva- living with HIV HIV with HIV among knowledge of young people with in the last 12 months by AIDS to all causes school lence (%) (thousands) (thousands) (thousands) young people (%) HIV (%) multiple partners and received results (thousands) (thousands) attendance Countries 2014 2014 2014 2014 2014 2010–2014* (%) 2010–2014* (%) 2010–2014* 2014 2014 ratio (%) and areas estimate estimate low high estimate estimate total male female male female male female male female estimate estimate 2010–2014* Gabon 3.9 48 41 55 29 4 0.9 0.6 1.3 36 30 77 56 12 30 18 68 101 Gambia 1.8 20 16 25 11 2 0.5 0.4 0.7 32 26 51 p – 4 10 10 87 90 Georgia 0.3 7 5 8 1 – 0.2 0.3 <0.1 – – – – – 5 – – – Germany – – – – – – – – – – – – – – – – – – Ghana 1.5 250 190 330 140 21 0.5 0.4 0.6 27 20 34 15 3 10 120 950 94 Greece – – – – – – – – – – – – – – – – – – Grenada – – – – – – – – – 60 65 – – – – – – – Guatemala 0.5 49 34 69 18 3 0.2 0.2 0.2 24x 22x 74 x 27 x,p – – – – – Guinea 1.6 120 100 140 65 – 0.6 0.4 0.7 34 23 54 37 3 5 – – 71 Guinea-Bissau 3.7 42 38 47 22 5 1.2 0.8 1.5 – 15 – 50 – 7 13 120 108 Guyana 1.8 10 7 15 5 <0.5 0.9 0.7 1.2 47x 54x 76 x – 18x 29x – – – Haiti 1.9 140 130 160 79 8 0.7 0.5 0.8 28 35 62 52 9 17 64 300 96 Holy See – – – – – – – – – – – – – – – – – – Honduras 0.4 23 19 27 9 2 0.2 0.2 0.2 35 33 59 38 7 13 – – 91 Hungary – – – – – – – – – – – – – – – – – – Iceland – – – – – – – – – – – – – – – – – – India 0.3 2,100 1,600 2,800 760 130 – – – 36x 20x 32 x 17 x,p 1x 1x 530 29,600 72x Indonesia 0.5 660 600 720 230 19 0.4 0.4 0.4 10y 11y – – – – – – – Iran (Islamic Republic of) 0.1 74 51 110 9 <1 <0.1 <0.1 <0.1 – 20y – – – – – – – Iraq – – – – – – – – – – 4 – – – 0 – – 94 Ireland 0.3 8 6 10 2 – 0.1 0.1 <0.1 – – – – – – – – – Israel – – – – – – – – – – – – – – – – – – Italy – – – – – – – – – – – – – – – – – – Jamaica 1.6 29 25 38 11 <1 0.7 0.8 0.6 36y 43y 76 49 49 69 – – – Japan – – – – – – – – – – – – – – – – – – Jordan – – – – – – – – – – 9 – – – – – – 80 Kazakhstan 0.2 20 18 25 7 – <0.1 <0.1 <0.1 34 36 76 74 15 21 – – – Kenya 5.3 1,400 1,200 1,600 700 160 2.8 2.2 3.5 64 57 69 38 39 50 650 2,000 99 Kiribati – – – – – – – – – 49x 44x 30 x 2 x,p – – – – 82x Kuwait – – – – – – – – – – – – – – – – – – Kyrgyzstan 0.3 9 7 12 4 <0.5 <0.1 <0.1 <0.1 24 20 76 – 1 12 – – – Lao People's Democratic 0.3 11 10 12 5 <1 0.1 0.1 0.2 28 24 – – 2 2 – – 80 Republic Latvia – – – – – – – – – – – – – – – – – – Lebanon <0.1 2 <0.2 4 <0.2 – <0.1 <0.1 <0.1 – – – – – – – – – Lesotho 23.4 310 290 340 170 19 8.0 5.9 10.2 29x 39x 60 x 45 x 17x 40x 74 120 98x Liberia 1.2 33 29 38 17 4 0.3 0.3 0.4 29 36 32 26 6 18 25 190 75 Libya – – – – – – – – – – – – – – – – – – Liechtenstein – – – – – – – – – – – – – – – – – – Lithuania – – – – – – – – – – – – – – – – – – Luxembourg – – – – – – – – – – – – – – – – – – Madagascar 0.3 39 34 45 16 5 0.1 0.2 0.1 26 23 7 9 2 3 – – 74x Malawi 10.0 1,100 990 1,100 560 130 3.2 2.4 4.1 51 44 53 38 34 42 530 990 96 Malaysia 0.5 100 91 110 20 <1 <0.1 0.1 <0.1 – – – – – – – – – Maldives – – – – – – – – – – 35x,y – – – – – – – Mali 1.4 130 110 170 68 18 0.6 0.5 0.7 33 24 38 8 p 4 6 59 810 81 Malta – – – – – – – – – – – – – – – – – – Marshall Islands – – – – – – – – – 39x 27x 23 x,p 9 x,p – – – – – Mauritania 0.7 16 13 20 8 2 0.3 0.2 0.4 – 6 – – – – – – 100p Mauritius 0.9 8 7 9 2 – 0.2 0.2 0.2 – – – – – – – – – Mexico 0.2 190 140 270 40 3 <0.1 0.1 <0.1 – – – – – – – – – Micronesia (Federated – – – – – – – – – – – – – – – – – – States of) Monaco – – – – – – – – – – – – – – – – – – Mongolia – – – – – – – – – 21 23 69 – 13 17 – – 102 Montenegro – – – – – – – – – 37 48 65 – 1 0 – – – Morocco 0.1 29 20 37 9 <1 <0.1 <0.1 <0.1 – – – – – – – – – Mozambique 10.6 1,500 1,300 2,100 830 160 4.5 2.4 6.6 52 30 41 38 11 26 610 1,800 91 Myanmar 0.7 210 190 230 70 11 0.3 0.4 0.3 – 32 – – – – – – – Namibia 16.0 260 240 280 130 16 4.0 2.9 5.0 51 62 79 68 26 43 53 100 102 Nauru – – – – – – – – – 10x 13x 17 x,p 8 x,p 4x 4x – – – Nepal 0.2 39 35 43 13 2 <0.1 <0.1 <0.1 – 36 45 – – 3 – – – Netherlands – – – – – – – – – – – – – – – – – – New Zealand – – – – – – – – – – – – – – – – – – THE STATE OF THE WORLD’S CHILDREN 2016 131
 70 Years for Every Child Page 149 Page 151