
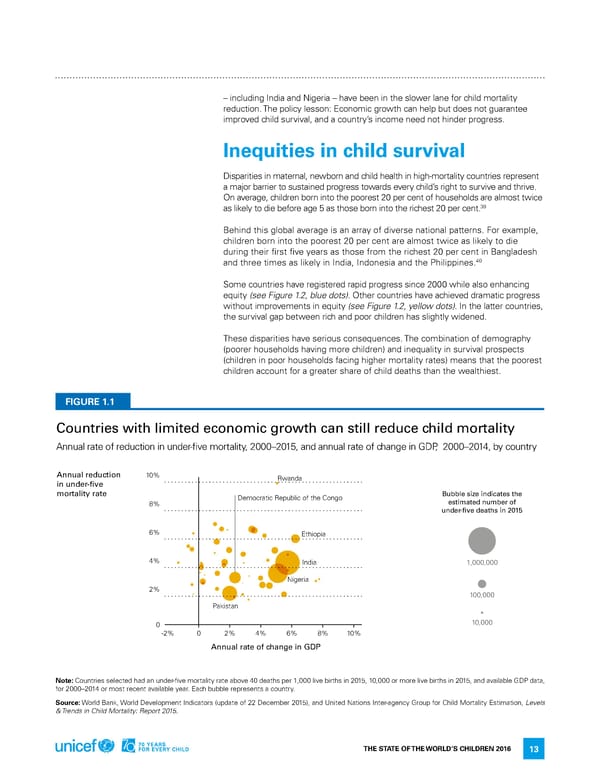
– including india and nigeria – have been in the slower lane for child mortality reduction. The policy lesson: economic growth can help but does not guarantee improved child survival, and a country’s income need not hinder progress. Inequities in child survival disparities in maternal, newborn and child health in high-mortality countries represent a major barrier to sustained progress towards every child’s right to survive and thrive. on average, children born into the poorest 20 per cent of households are almost twice 39 as likely to die before age 5 as those born into the richest 20 per cent. Behind this global average is an array of diverse national patterns. for example, children born into the poorest 20 per cent are almost twice as likely to die during their first five years as those from the richest 20 per cent in Bangladesh and three times as likely in india, indonesia and the Philippines.40 Some countries have registered rapid progress since 2000 while also enhancing equity (see Figure 1.2, blue dots). other countries have achieved dramatic progress without improvements in equity (see Figure 1.2, yellow dots). in the latter countries, the survival gap between rich and poor children has slightly widened. These disparities have serious consequences. The combination of demography (poorer households having more children) and inequality in survival prospects (children in poor households facing higher mortality rates) means that the poorest children account for a greater share of child deaths than the wealthiest. FIGURE 1.1 Countries with limited economic growth can still reduce child mortality annual rate of reduction in under-five mortality, 2000–2015, and annual rate of change in GdP, 2000–2014, by country Annual reduction 10% rwanda in under-five mortality rate democratic republic of the Congo Bubble size indicates the 8% estimated number of under-five deaths in 2015 6% ethiopia 4% india 1,000,000 nigeria 2% 100,000 Pakistan 0 10,000 -2% 0 2% 4% 6% 8% 10% Annual rate of change in GDP Note: Countries selected had an under-five mortality rate above 40 deaths per 1,000 live births in 2015, 10,000 or more live births in 2015, and available GdP data, for 2000–2014 or most recent available year. each bubble represents a country. Source: World Bank, World development indicators (update of 22 december 2015), and United nations inter-agency Group for Child Mortality estimation, Levels & Trends in Child Mortality: Report 2015. The STaTe of The World’S Children 2016 13
 70 Years for Every Child Page 27 Page 29