
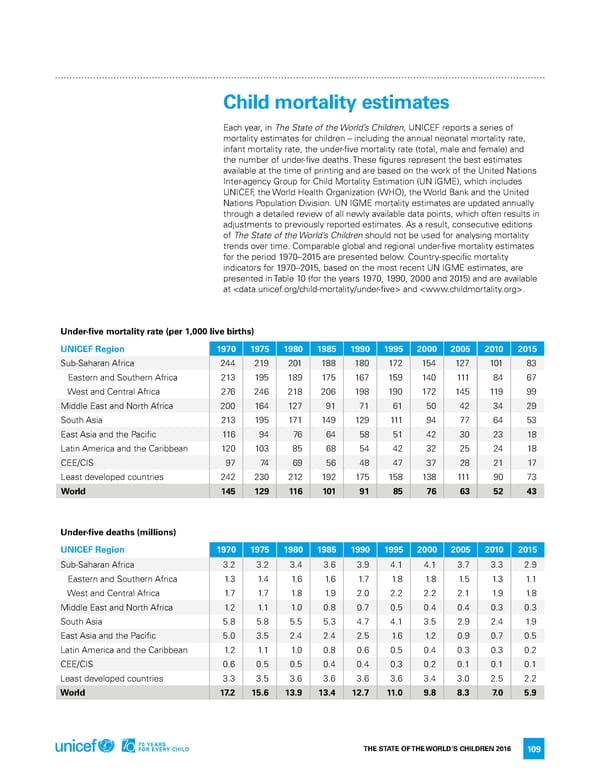
Child mortality estimates Each year, in The State of the World’s Children, UNICEF reports a series of mortality estimates for children – including the annual neonatal mortality rate, infant mortality rate, the under-five mortality rate (total, male and female) and the number of under-five deaths. These figures represent the best estimates available at the time of printing and are based on the work of the United Nations Inter-agency Group for Child Mortality Estimation (UN IGME), which includes UNICEF, the World Health Organization (WHO), the World Bank and the United Nations Population Division. UN IGME mortality estimates are updated annually through a detailed review of all newly available data points, which often results in adjustments to previously reported estimates. As a result, consecutive editions of The State of the World’s Children should not be used for analysing mortality trends over time. Comparable global and regional under-five mortality estimates for the period 1970–2015 are presented below. Country-specific mortality indicators for 1970–2015, based on the most recent UN IGME estimates, are presented in Table 10 (for the years 1970, 1990, 2000 and 2015) and are available at and . Under-five mortality rate (per 1,000 live births) UNICEF Region 1970 1975 1980 1985 1990 1995 2000 2005 2010 2015 Sub-Saharan Africa 244 219 201 188 180 172 154 127 101 83 Eastern and Southern Africa 213 195 189 175 167 159 140 111 84 67 West and Central Africa 276 246 218 206 198 190 172 145 119 99 Middle East and North Africa 200 164 127 91 71 61 50 42 34 29 South Asia 213 195 171 149 129 111 94 77 64 53 East Asia and the Pacific 116 94 76 64 58 51 42 30 23 18 Latin America and the Caribbean 120 103 85 68 54 42 32 25 24 18 CEE/CIS 97 74 69 56 48 47 37 28 21 17 Least developed countries 242 230 212 192 175 158 138 111 90 73 World 145 129 116 101 91 85 76 63 52 43 Under-five deaths (millions) UNICEF Region 1970 1975 1980 1985 1990 1995 2000 2005 2010 2015 Sub-Saharan Africa 3.2 3.2 3.4 3.6 3.9 4.1 4.1 3.7 3.3 2.9 Eastern and Southern Africa 1. 3 1. 4 1. 6 1. 6 1. 7 1. 8 1. 8 1. 5 1. 3 1. 1 West and Central Africa 1. 7 1. 7 1. 8 1. 9 2.0 2.2 2.2 2.1 1. 9 1. 8 Middle East and North Africa 1. 2 1. 1 1. 0 0.8 0.7 0.5 0.4 0.4 0.3 0.3 South Asia 5.8 5.8 5.5 5.3 4.7 4.1 3.5 2.9 2.4 1. 9 East Asia and the Pacific 5.0 3.5 2.4 2.4 2.5 1. 6 1. 2 0.9 0.7 0.5 Latin America and the Caribbean 1. 2 1. 1 1. 0 0.8 0.6 0.5 0.4 0.3 0.3 0.2 CEE/CIS 0.6 0.5 0.5 0.4 0.4 0.3 0.2 0.1 0.1 0.1 Least developed countries 3.3 3.5 3.6 3.6 3.6 3.6 3.4 3.0 2.5 2.2 World 17. 2 15.6 13.9 13.4 12.7 11.0 9.8 8.3 7. 0 5.9 THE STATE OF THE WORLD’S CHILDREN 2016 109
 70 Years for Every Child Page 127 Page 129