
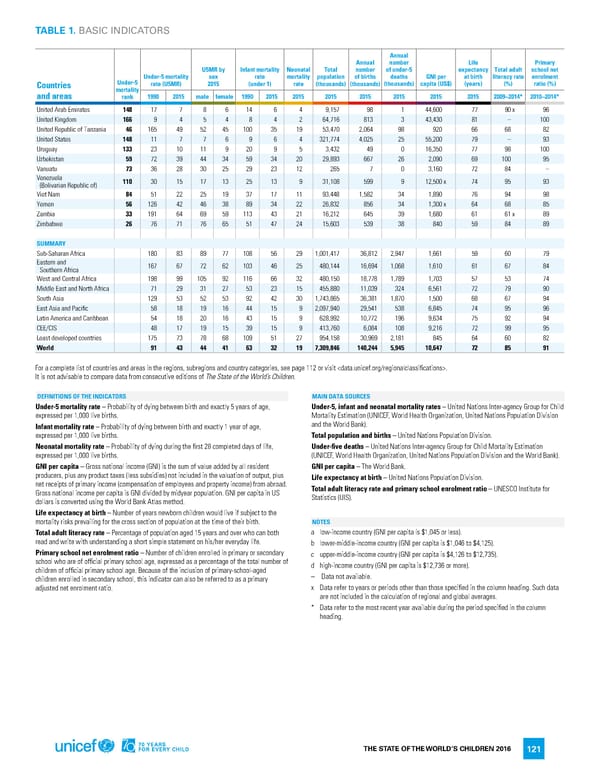
TABLE 1. BASIC INDICATORS Annual Annual number Life Primary U5MR by Infant mortality Neonatal Total number of under-5 expectancy Total adult school net Under-5 mortality sex rate mortality population of births deaths GNI per at birth literacy rate enrolment Countries Under-5 rate (U5MR) 2015 (under 1) rate (thousands) (thousands) (thousands) capita (US$) (years) (%) ratio (%) mortality and areas rank 1990 2015 male female 1990 2015 2015 2015 2015 2015 2015 2015 2009−2014* 2010−2014* United Arab Emirates 148 17 7 8 6 14 6 4 9,157 98 1 44,600 77 90x 96 United Kingdom 166 9 4 5 4 8 4 2 64,716 813 3 43,430 81 – 100 United Republic of Tanzania 46 165 49 52 45 100 35 19 53,470 2,064 98 920 66 68 82 United States 148 11 7 7 6 9 6 4 321,774 4,025 25 55,200 79 – 93 Uruguay 133 23 10 11 9 20 9 5 3,432 49 0 16,350 77 98 100 Uzbekistan 59 72 39 44 34 59 34 20 29,893 667 26 2,090 69 100 95 Vanuatu 73 36 28 30 25 29 23 12 265 7 0 3,160 72 84 – Venezuela 110 30 15 17 13 25 13 9 31,108 599 9 12,500 x 74 95 93 (Bolivarian Republic of) Viet Nam 84 51 22 25 19 37 17 11 93,448 1,582 34 1,890 76 94 98 Yemen 56 126 42 46 38 89 34 22 26,832 856 34 1,300 x 64 68 85 Zambia 33 191 64 69 59 113 43 21 16,212 645 39 1,680 61 61x 89 Zimbabwe 26 76 71 76 65 51 47 24 15,603 539 38 840 59 84 89 SUMMARY Sub-Saharan Africa 180 83 89 77 108 56 29 1,001,417 36,812 2,947 1,661 59 60 79 Eastern and 167 67 72 62 103 46 25 480,144 16,694 1,068 1,610 61 67 84 Southern Africa West and Central Africa 198 99 105 92 116 66 32 480,150 18,778 1,789 1,703 57 53 74 Middle East and North Africa 71 29 31 27 53 23 15 455,880 11,039 324 6,561 72 79 90 South Asia 129 53 52 53 92 42 30 1,743,865 36,381 1,870 1,500 68 67 94 East Asia and Pacific 58 18 19 16 44 15 9 2,097,940 29,541 538 6,845 74 95 96 Latin America and Caribbean 54 18 20 16 43 15 9 628,992 10,772 196 9,634 75 92 94 CEE/CIS 48 17 19 15 39 15 9 413,760 6,084 108 9,216 72 99 95 Least developed countries 175 73 78 68 109 51 27 954,158 30,969 2,181 845 64 60 82 orld 91 43 44 41 63 32 19 7,309,846 140,244 5,945 10,647 72 85 91 W For a complete list of countries and areas in the regions, subregions and country categories, see page 112 or visit . It is not advisable to compare data from consecutive editions of The State of the World’s Children. DEFINITIONS OF THE INDICATORS MAIN DATA SOURCES Under-5 mortality rate – Probability of dying between birth and exactly 5 years of age, Under-5, infant and neonatal mortality rates – United Nations Inter-agency Group for Child expressed per 1,000 live births. Mortality Estimation (UNICEF, World Health Organization, United Nations Population Division Infant mortality rate – Probability of dying between birth and exactly 1 year of age, and the World Bank). expressed per 1,000 live births. Total population and births – United Nations Population Division. Neonatal mortality rate – Probability of dying during the first 28 completed days of life, Under-five deaths – United Nations Inter-agency Group for Child Mortality Estimation expressed per 1,000 live births. (UNICEF, World Health Organization, United Nations Population Division and the World Bank). GNI per capita – Gross national income (GNI) is the sum of value added by all resident GNI per capita – The World Bank. producers, plus any product taxes (less subsidies) not included in the valuation of output, plus Life expectancy at birth – United Nations Population Division. net receipts of primary income (compensation of employees and property income) from abroad. Total adult literacy rate and primary school enrolment ratio – UNESCO Institute for Gross national income per capita is GNI divided by midyear population. GNI per capita in US Statistics (UIS). dollars is converted using the World Bank Atlas method. Life expectancy at birth – Number of years newborn children would live if subject to the mortality risks prevailing for the cross section of population at the time of their birth. NOTES Total adult literacy rate – Percentage of population aged 15 years and over who can both a low-income country (GNI per capita is $1,045 or less). read and write with understanding a short simple statement on his/her everyday life. b lower-middle-income country (GNI per capita is $1,046 to $4,125). Primary school net enrolment ratio – Number of children enrolled in primary or secondary c upper-middle-income country (GNI per capita is $4,126 to $12,735). school who are of official primary school age, expressed as a percentage of the total number of d high-income country (GNI per capita is $12,736 or more). children of official primary school age. Because of the inclusion of primary-school-aged – Data not available. children enrolled in secondary school, this indicator can also be referred to as a primary adjusted net enrolment ratio. x Data refer to years or periods other than those specified in the column heading. Such data are not included in the calculation of regional and global averages. * Data refer to the most recent year available during the period specified in the column heading. THE STATE OF THE WORLD’S CHILDREN 2016 121
 70 Years for Every Child Page 139 Page 141