
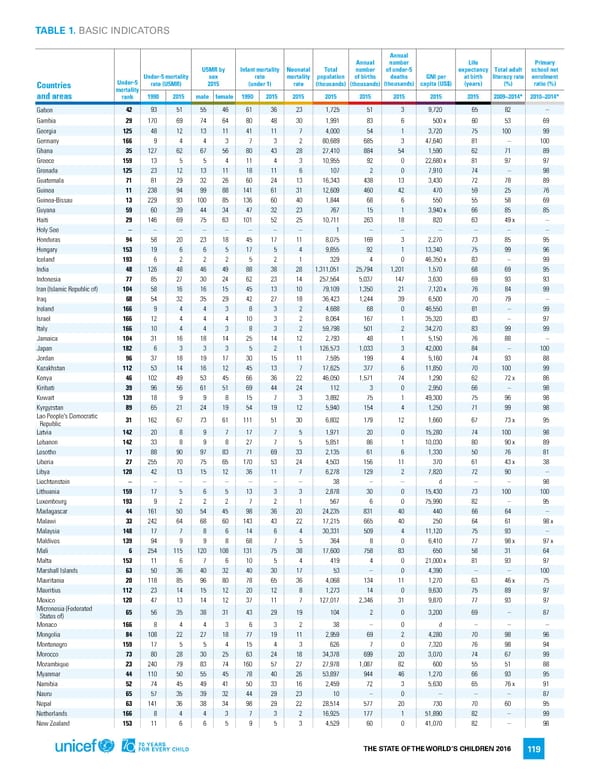
TABLE 1. BASIC INDICATORS Annual Annual number Life Primary U5MR by Infant mortality Neonatal Total number of under-5 expectancy Total adult school net Under-5 mortality sex rate mortality population of births deaths GNI per at birth literacy rate enrolment Countries Under-5 rate (U5MR) 2015 (under 1) rate (thousands) (thousands) (thousands) capita (US$) (years) (%) ratio (%) mortality and areas rank 1990 2015 male female 1990 2015 2015 2015 2015 2015 2015 2015 2009−2014* 2010−2014* Gabon 42 93 51 55 46 61 36 23 1,725 51 3 9,720 65 82 – Gambia 29 170 69 74 64 80 48 30 1,991 83 6 500x 60 53 69 Georgia 125 48 12 13 11 41 11 7 4,000 54 1 3,720 75 100 99 Germany 166 9 4 4 3 7 3 2 80,689 685 3 47,640 81 – 100 Ghana 35 127 62 67 56 80 43 28 27,410 884 54 1,590 62 71 89 Greece 159 13 5 5 4 11 4 3 10,955 92 0 22,680 x 81 97 97 Grenada 125 23 12 13 11 18 11 6 107 2 0 7,910 74 – 98 Guatemala 71 81 29 32 26 60 24 13 16,343 438 13 3,430 72 78 89 Guinea 11 238 94 99 88 141 61 31 12,609 460 42 470 59 25 76 Guinea-Bissau 13 229 93 100 85 136 60 40 1,844 68 6 550 55 58 69 Guyana 59 60 39 44 34 47 32 23 767 15 1 3,940 x 66 85 85 Haiti 29 146 69 75 63 101 52 25 10,711 263 18 820 63 49x – Holy See – – – – – – – – 1 – – – – – – Honduras 94 58 20 23 18 45 17 11 8,075 169 3 2,270 73 85 95 Hungary 153 19 6 6 5 17 5 4 9,855 92 1 13,340 75 99 96 Iceland 193 6 2 2 2 5 2 1 329 4 0 46,350 x 83 – 99 India 48 126 48 46 49 88 38 28 1,311,051 25,794 1,201 1,570 68 69 95 Indonesia 77 85 27 30 24 62 23 14 257,564 5,037 147 3,630 69 93 93 Iran (Islamic Republic of) 104 58 16 16 15 45 13 10 79,109 1,350 21 7,120 x 76 84 99 Iraq 68 54 32 35 29 42 27 18 36,423 1,244 39 6,500 70 79 – Ireland 166 9 4 4 3 8 3 2 4,688 68 0 46,550 81 – 99 Israel 166 12 4 4 4 10 3 2 8,064 167 1 35,320 83 – 97 Italy 166 10 4 4 3 8 3 2 59,798 501 2 34,270 83 99 99 Jamaica 104 31 16 18 14 25 14 12 2,793 48 1 5,150 76 88 – Japan 182 6 3 3 3 5 2 1 126,573 1,033 3 42,000 84 – 100 Jordan 96 37 18 19 17 30 15 11 7,595 199 4 5,160 74 93 88 Kazakhstan 112 53 14 16 12 45 13 7 17,625 377 6 11,850 70 100 99 Kenya 46 102 49 53 45 66 36 22 46,050 1,571 74 1,290 62 72x 86 Kiribati 39 96 56 61 51 69 44 24 112 3 0 2,950 66 – 98 Kuwait 139 18 9 9 8 15 7 3 3,892 75 1 49,300 75 96 98 Kyrgyzstan 89 65 21 24 19 54 19 12 5,940 154 4 1,250 71 99 98 Lao People's Democratic 31 162 67 73 61 111 51 30 6,802 179 12 1,660 67 73x 95 Republic Latvia 142 20 8 9 7 17 7 5 1,971 20 0 15,280 74 100 98 Lebanon 142 33 8 9 8 27 7 5 5,851 86 1 10,030 80 90x 89 Lesotho 17 88 90 97 83 71 69 33 2,135 61 6 1,330 50 76 81 Liberia 27 255 70 75 65 170 53 24 4,503 156 11 370 61 43x 38 Libya 120 42 13 15 12 36 11 7 6,278 129 2 7,820 72 90 – Liechtenstein – – – – – – – – 38 – – d – – 98 Lithuania 159 17 5 6 5 13 3 3 2,878 30 0 15,430 73 100 100 Luxembourg 193 9 2 2 2 7 2 1 567 6 0 75,990 82 – 95 Madagascar 44 161 50 54 45 98 36 20 24,235 831 40 440 66 64 – Malawi 33 242 64 68 60 143 43 22 17,215 665 40 250 64 61 98x Malaysia 148 17 7 8 6 14 6 4 30,331 509 4 11,120 75 93 – Maldives 139 94 9 9 8 68 7 5 364 8 0 6,410 77 98x 97x Mali 6 254 115 120 108 131 75 38 17,600 758 83 650 58 31 64 Malta 153 11 6 7 6 10 5 4 419 4 0 21,000 x 81 93 97 Marshall Islands 63 50 36 40 32 40 30 17 53 – 0 4,390 – – 100 Mauritania 20 118 85 96 80 78 65 36 4,068 134 11 1,270 63 46x 75 Mauritius 112 23 14 15 12 20 12 8 1,273 14 0 9,630 75 89 97 Mexico 120 47 13 14 12 37 11 7 127,017 2,346 31 9,870 77 93 97 Micronesia (Federated 65 56 35 38 31 43 29 19 104 2 0 3,200 69 – 87 States of) Monaco 166 8 4 4 3 6 3 2 38 – 0 d – – – Mongolia 84 108 22 27 18 77 19 11 2,959 69 2 4,280 70 98 96 Montenegro 159 17 5 5 4 15 4 3 626 7 0 7,320 76 98 94 Morocco 73 80 28 30 25 63 24 18 34,378 699 20 3,070 74 67 99 Mozambique 23 240 79 83 74 160 57 27 27,978 1,087 82 600 55 51 88 Myanmar 44 110 50 55 45 78 40 26 53,897 944 46 1,270 66 93 95 Namibia 52 74 45 49 41 50 33 16 2,459 72 3 5,630 65 76x 91 Nauru 65 57 35 39 32 44 29 23 10 – 0 – – – 87 Nepal 63 141 36 38 34 98 29 22 28,514 577 20 730 70 60 95 Netherlands 166 8 4 4 3 7 3 2 16,925 177 1 51,890 82 – 99 New Zealand 153 11 6 6 5 9 5 3 4,529 60 0 41,070 82 – 98 THE STATE OF THE WORLD’S CHILDREN 2016 119
 70 Years for Every Child Page 137 Page 139