
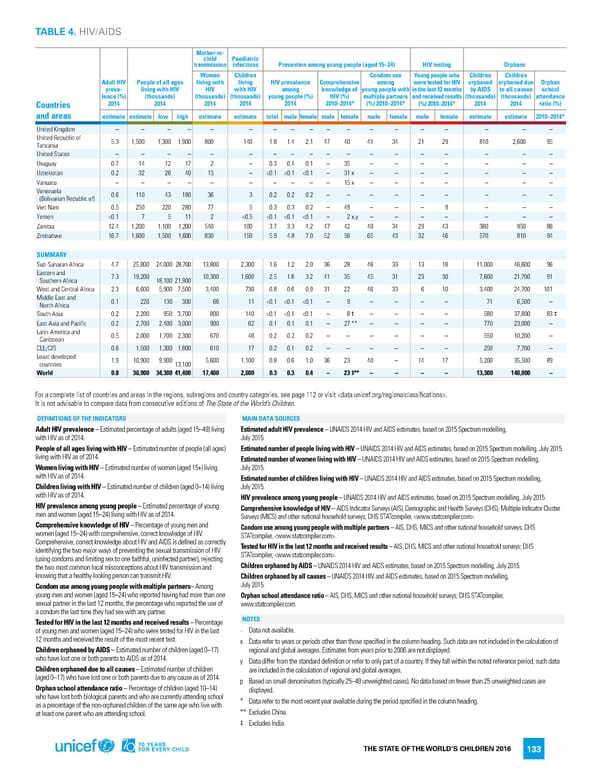
TABLE 4. HIV/AIDS Mother-to- child Paediatric transmission infections Prevention among young people (aged 15–24) HIV testing Orphans Women Children Condom use Young people who Children Children Adult HIV People of all ages living with living HIV prevalence Comprehensive among were tested for HIV orphaned orphaned due Orphan preva- living with HIV HIV with HIV among knowledge of young people with in the last 12 months by AIDS to all causes school lence (%) (thousands) (thousands) (thousands) young people (%) HIV (%) multiple partners and received results (thousands) (thousands) attendance Countries 2014 2014 2014 2014 2014 2010–2014* (%) 2010–2014* (%) 2010–2014* 2014 2014 ratio (%) and areas estimate estimate low high estimate estimate total male female male female male female male female estimate estimate 2010–2014* United Kingdom – – – – – – – – – – – – – – – – – – United Republic of 5.3 1,500 1,300 1,900 800 140 1.8 1.4 2.1 47 40 41 34 21 29 810 2,600 95 Tanzania United States – – – – – – – – – – – – – – – – – – Uruguay 0.7 14 12 17 2 – 0.3 0.4 0.1 – 35 – – – – – – – Uzbekistan 0.2 32 26 40 13 – <0.1 <0.1 <0.1 – 31x – – – – – – – Vanuatu – – – – – – – – – – 15x – – – – – – – Venezuela 0.6 110 43 180 36 3 0.2 0.2 0.2 – – – – – – – – – (Bolivarian Republic of) Viet Nam 0.5 250 220 280 77 5 0.3 0.3 0.2 – 49 – – – 9 – – – Yemen <0.1 7 5 11 2 <0.5 <0.1 <0.1 <0.1 – 2x,y – – – – – – – Zambia 12.4 1,200 1,100 1,200 540 100 3.7 3.3 4.2 47 42 40 34 29 43 380 950 86 Zimbabwe 16.7 1,600 1,500 1,600 830 150 5.9 4.8 7.0 52 56 65 43 32 46 570 810 94 SUMMARY Sub-Saharan Africa 4.7 25,800 24,000 28,700 13,800 2,300 1.6 1.2 2.0 36 28 46 33 13 18 11,000 46,600 96 Eastern and 7.3 19,200 10,300 1,600 2.5 1.8 3.2 41 35 45 31 23 30 7,600 21,700 91 Southern Africa 18,100 21,900 West and Central Africa 2.3 6,600 5,900 7,500 3,400 730 0.8 0.6 0.9 31 22 46 33 6 10 3,400 24,700 101 Middle East and 0.1 220 130 300 66 11 <0.1 <0.1 <0.1 – 9 – – – – 71 6,500 – North Africa South Asia 0.2 2,200 950 3,700 800 140 <0.1 <0.1 <0.1 – 8‡ – – – – 580 37,800 83‡ East Asia and Pacific 0.2 2,700 2,400 3,000 900 62 0.1 0.1 0.1 – 27** – – – – 770 23,000 – Latin America and 0.5 2,000 1,700 2,300 670 46 0.2 0.2 0.2 – – – – – – 550 10,200 – Caribbean CEE/CIS 0.6 1,500 1,300 1,800 610 17 0.2 0.1 0.2 – – – – – – 250 7,700 – Least developed 1.9 10,900 9,900 5,600 1,100 0.8 0.6 1.0 36 23 40 – 14 17 5,200 35,500 89 countries 13,100 World 0.8 36,900 34,300 41,400 17,400 2,600 0.3 0.3 0.4 – 23 ‡** – – – – 13,300 140,000 – For a complete list of countries and areas in the regions, subregions and country categories, see page 112 or visit . It is not advisable to compare data from consecutive editions of The State of the World’s Children. DEFINITIONS OF THE INDICATORS MAIN DATA SOURCES Adult HIV prevalence – Estimated percentage of adults (aged 15–49) living Estimated adult HIV prevalence – UNAIDS 2014 HIV and AIDS estimates, based on 2015 Spectrum modelling, with HIV as of 2014. July 2015. People of all ages living with HIV – Estimated number of people (all ages) Estimated number of people living with HIV – UNAIDS 2014 HIV and AIDS estimates, based on 2015 Spectrum modelling, July 2015. living with HIV as of 2014. Estimated number of women living with HIV – UNAIDS 2014 HIV and AIDS estimates, based on 2015 Spectrum modelling, Women living with HIV – Estimated number of women (aged 15+) living July 2015. with HIV as of 2014. Estimated number of children living with HIV – UNAIDS 2014 HIV and AIDS estimates, based on 2015 Spectrum modelling, Children living with HIV – Estimated number of children (aged 0–14) living July 2015. with HIV as of 2014. HIV prevalence among young people – UNAIDS 2014 HIV and AIDS estimates, based on 2015 Spectrum modelling, July 2015. HIV prevalence among young people – Estimated percentage of young Comprehensive knowledge of HIV – AIDS Indicator Surveys (AIS), Demographic and Health Surveys (DHS), Multiple Indicator Cluster men and women (aged 15–24) living with HIV as of 2014. Surveys (MICS) and other national household surveys; DHS STATcompiler, . Comprehensive knowledge of HIV – Percentage of young men and Condom use among young people with multiple partners – AIS, DHS, MICS and other national household surveys; DHS women (aged 15–24) with comprehensive, correct knowledge of HIV. STATcompiler, . Comprehensive, correct knowledge about HIV and AIDS is defined as correctly Tested for HIV in the last 12 months and received results – AIS, DHS, MICS and other national household surveys; DHS identifying the two major ways of preventing the sexual transmission of HIV STATcompiler, . (using condoms and limiting sex to one faithful, uninfected partner), rejecting the two most common local misconceptions about HIV transmission and Children orphaned by AIDS – UNAIDS 2014 HIV and AIDS estimates, based on 2015 Spectrum modelling, July 2015. knowing that a healthy-looking person can transmit HIV. Children orphaned by all causes – UNAIDS 2014 HIV and AIDS estimates, based on 2015 Spectrum modelling, Condom use among young people with multiple partners– Among July 2015. young men and women (aged 15–24) who reported having had more than one Orphan school attendance ratio – AIS, DHS, MICS and other national household surveys; DHS STATcompiler, sexual partner in the last 12 months, the percentage who reported the use of www.statcompiler.com. a condom the last time they had sex with any partner. Tested for HIV in the last 12 months and received results – Percentage NOTES − Data not available. of young men and women (aged 15–24) who were tested for HIV in the last 12 months and received the result of the most recent test. x Data refer to years or periods other than those specified in the column heading. Such data are not included in the calculation of – Estimated number of children (aged 0–17) Children orphaned by AIDS regional and global averages. Estimates from years prior to 2006 are not displayed. who have lost one or both parents to AIDS as of 2014. y Data differ from the standard definition or refer to only part of a country. If they fall within the noted reference period, such data Children orphaned due to all causes – Estimated number of children are included in the calculation of regional and global averages. (aged 0–17) who have lost one or both parents due to any cause as of 2014. p Based on small denominators (typically 25–49 unweighted cases). No data based on fewer than 25 unweighted cases are Orphan school attendance ratio – Percentage of children (aged 10–14) displayed. who have lost both biological parents and who are currently attending school * Data refer to the most recent year available during the period specified in the column heading. as a percentage of the non-orphaned children of the same age who live with at least one parent who are attending school. ** Excludes China. ‡ Excludes India. THE STATE OF THE WORLD’S CHILDREN 2016 133
 70 Years for Every Child Page 151 Page 153