
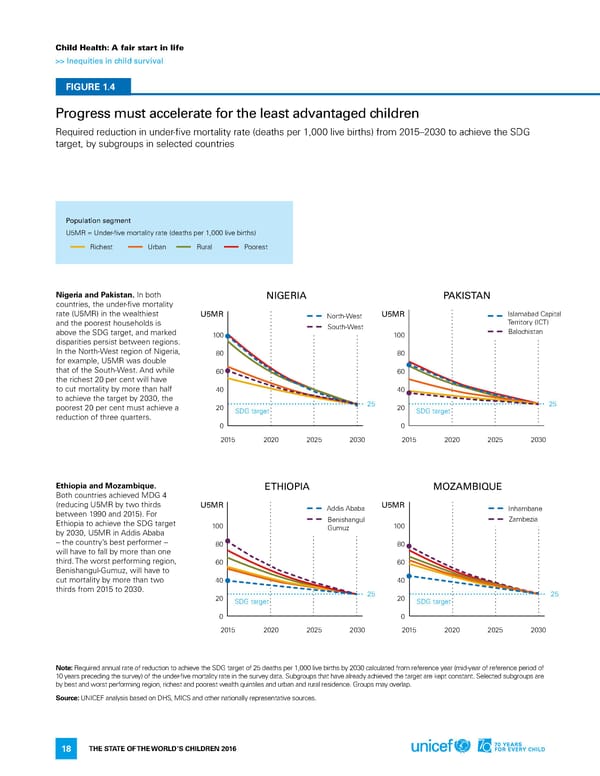
Child Health: A fair start in life >> Inequities in child survival FIGURE 1.4 Progress must accelerate for the least advantaged children required reduction in under-five mortality rate (deaths per 1,000 live births) from 2015–2030 to achieve the SdG target, by subgroups in selected countries Population segment U5Mr = Under-five mortality rate (deaths per 1,000 live births) richest Urban rural Poorest Nigeria and Pakistan. in both NIGERIA PAKISTAN countries, the under-five mortality rate (U5Mr) in the wealthiest U5MR north-West U5MR islamabad Capital and the poorest households is South-West Territory (iCT) above the SdG target, and marked 100 100 Balochistan disparities persist between regions. in the north-West region of nigeria, 80 80 for example, U5Mr was double that of the South-West. and while 60 60 the richest 20 per cent will have to cut mortality by more than half 40 40 to achieve the target by 2030, the 25 25 poorest 20 per cent must achieve a 20 SdG target 20 SdG target reduction of three quarters. 0 0 2015 2020 2025 2030 2015 2020 2025 2030 Ethiopia and Mozambique. ETHIoPIA MoZAMBIqUE Both countries achieved MdG 4 (reducing U5Mr by two thirds U5MR addis ababa U5MR inhambane between 1990 and 2015). for Benishangul Zambezia ethiopia to achieve the SdG target 100 Gumuz 100 by 2030, U5Mr in addis ababa – the country’s best performer – 80 80 will have to fall by more than one third. The worst performing region, 60 60 Benishangul-Gumuz, will have to cut mortality by more than two 40 40 thirds from 2015 to 2030. 25 25 20 SdG target 20 SdG target 0 0 2015 2020 2025 2030 2015 2020 2025 2030 Note: required annual rate of reduction to achieve the SdG target of 25 deaths per 1,000 live births by 2030 calculated from reference year (mid-year of reference period of 10 years preceding the survey) of the under-five mortality rate in the survey data. Subgroups that have already achieved the target are kept constant. Selected subgroups are by best and worst performing region, richest and poorest wealth quintiles and urban and rural residence. Groups may overlap. Source: UniCef analysis based on dhS, MiCS and other nationally representative sources. The STaTe of The World’S Children 2016 18
 70 Years for Every Child Page 32 Page 34