
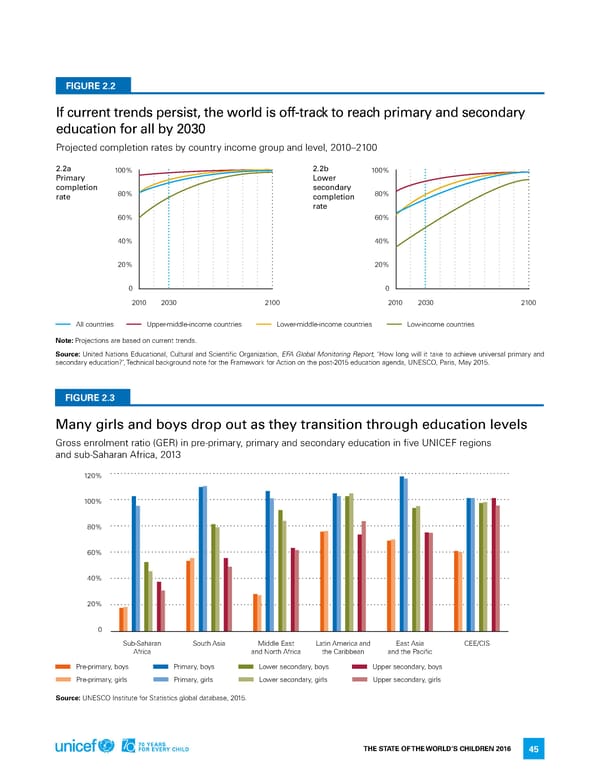
FIGURE 2.2 If current trends persist, the world is off-track to reach primary and secondary education for all by 2030 Projected completion rates by country income group and level, 2010–2100 2.2a 100% 2.2b 100% Primary Lower completion 80% secondary 80% rate completion rate 60% 60% 40% 40% 20% 20% 0 0 2010 2030 2100 2010 2030 2100 all countries Upper-middle-income countries lower-middle-income countries low-income countries Note: Projections are based on current trends. Source: United nations educational, Cultural and Scientific organization, EFA Global Monitoring Report, ‘how long will it take to achieve universal primary and secondary education?’, Technical background note for the framework for action on the post-2015 education agenda, UneSCo, Paris, May 2015. FIGURE 2.3 Many girls and boys drop out as they transition through education levels Gross enrolment ratio (Ger) in pre-primary, primary and secondary education in five UniCef regions and sub-Saharan africa, 2013 120% 100% 80% 60% 40% 20% 0 Sub-Saharan South asia Middle east latin america and east asia Cee/CiS africa and north africa the Caribbean and the Pacific Pre-primary, boys Primary, boys lower secondary, boys Upper secondary, boys Pre-primary, girls Primary, girls lower secondary, girls Upper secondary, girls Source: UneSCo institute for Statistics global database, 2015. The STaTe of The World’S Children 2016 45
 70 Years for Every Child Page 60 Page 62