
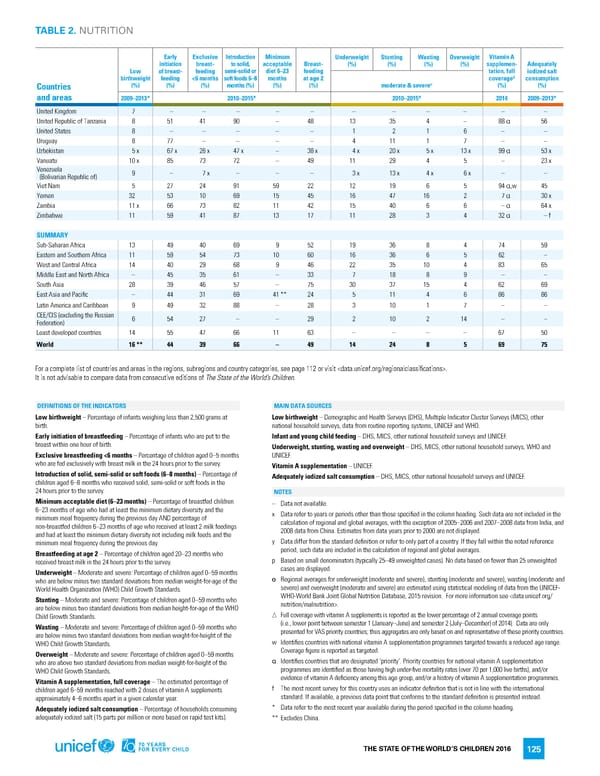
TABLE 2. NUTRITION Early Exclusive Introduction Minimum Underweight Stunting Wasting Overweight Vitamin A initiation breast- to solid, acceptable Breast- (%) (%) (%) (%) supplemen- Adequately Low of breast- feeding semi-solid or diet 6–23 feeding tation, full iodized salt birthweight feeding <6 months soft foods 6–8 months at age 2 coverageΔ consumption Countries (%) (%) (%) months (%) (%) (%) moderate & severeɵ (%) (%) and areas 2009–2013* 2010–2015* 2010–2015* 2014 2009–2013* United Kingdom 7 – – – – – – – – – – – United Republic of Tanzania 8 51 41 90 – 48 13 35 4 – 88α 56 United States 8 – – – – – 1 2 1 6 – – Uruguay 8 77 – – – – 4 11 1 7 – – Uzbekistan 5x 67x 26x 47x – 38x 4x 20x 5x 13x 99α 53x Vanuatu 10x 85 73 72 – 49 11 29 4 5 – 23x Venezuela 9 – 7x – – – 3x 13x 4x 6x – – (Bolivarian Republic of) Viet Nam 5 27 24 91 59 22 12 19 6 5 94α,w 45 Yemen 32 53 10 69 15 45 16 47 16 2 7α 30x Zambia 11x 66 73 82 11 42 15 40 6 6 –α 64x Zimbabwe 11 59 41 87 13 17 11 28 3 4 32α –f SUMMARY Sub-Saharan Africa 13 49 40 69 9 52 19 36 8 4 74 59 Eastern and Southern Africa 11 59 54 73 10 60 16 36 6 5 62 – West and Central Africa 14 40 29 68 9 46 22 35 10 4 83 65 Middle East and North Africa – 45 35 61 – 33 7 18 8 9 – – South Asia 28 39 46 57 – 75 30 37 15 4 62 69 East Asia and Pacific – 44 31 69 41** 24 5 11 4 6 86 86 Latin America and Caribbean 9 49 32 88 – 28 3 10 1 7 – – CEE/CIS (excluding the Russian 6 54 27 – – 29 2 10 2 14 – – Federation) Least developed countries 14 55 47 66 11 63 – – – – 67 50 World 16** 44 39 66 – 49 14 24 8 5 69 75 For a complete list of countries and areas in the regions, subregions and country categories, see page 112 or visit . It is not advisable to compare data from consecutive editions of The State of the World’s Children. DEFINITIONS OF THE INDICATORS MAIN DATA SOURCES Low birthweight – Percentage of infants weighing less than 2,500 grams at Low birthweight – Demographic and Health Surveys (DHS), Multiple Indicator Cluster Surveys (MICS), other birth. national household surveys, data from routine reporting systems, UNICEF and WHO. Early initiation of breastfeeding – Percentage of infants who are put to the Infant and young child feeding – DHS, MICS, other national household surveys and UNICEF. breast within one hour of birth. Underweight, stunting, wasting and overweight – DHS, MICS, other national household surveys, WHO and Exclusive breastfeeding <6 months – Percentage of children aged 0–5 months UNICEF. who are fed exclusively with breast milk in the 24 hours prior to the survey. Vitamin A supplementation – UNICEF. Introduction of solid, semi-solid or soft foods (6–8 months) – Percentage of Adequately iodized salt consumption – DHS, MICS, other national household surveys and UNICEF. children aged 6–8 months who received solid, semi-solid or soft foods in the 24 hours prior to the survey. NOTES Minimum acceptable diet (6–23 months) – Percentage of breastfed children – Data not available. 6–23 months of age who had at least the minimum dietary diversity and the x Data refer to years or periods other than those specified in the column heading. Such data are not included in the minimum meal frequency during the previous day AND percentage of calculation of regional and global averages, with the exception of 2005–2006 and 2007–2008 data from India, and non-breastfed children 6–23 months of age who received at least 2 milk feedings 2008 data from China. Estimates from data years prior to 2000 are not displayed. and had at least the minimum dietary diversity not including milk feeds and the minimum meal frequency during the previous day. y Data differ from the standard definition or refer to only part of a country. If they fall within the noted reference Breastfeeding at age 2 – Percentage of children aged 20–23 months who period, such data are included in the calculation of regional and global averages. received breast milk in the 24 hours prior to the survey. p Based on small denominators (typically 25–49 unweighted cases). No data based on fewer than 25 unweighted Underweight – Moderate and severe: Percentage of children aged 0–59 months cases are displayed. who are below minus two standard deviations from median weight-for-age of the ɵ Regional averages for underweight (moderate and severe), stunting (moderate and severe), wasting (moderate and World Health Organization (WHO) Child Growth Standards. severe) and overweight (moderate and severe) are estimated using statistical modeling of data from the UNICEF- Stunting – Moderate and severe: Percentage of children aged 0–59 months who WHO-World Bank Joint Global Nutrition Database, 2015 revision. For more information see . Child Growth Standards. r Full coverage with vitamin A supplements is reported as the lower percentage of 2 annual coverage points Wasting – Moderate and severe: Percentage of children aged 0–59 months who (i.e., lower point between semester 1 (January–June) and semester 2 (July–December) of 2014). Data are only are below minus two standard deviations from median weight-for-height of the presented for VAS priority countries; thus aggregates are only based on and representative of these priority countries. WHO Child Growth Standards. w Identifies countries with national vitamin A supplementation programmes targeted towards a reduced age range. Overweight – Moderate and severe: Percentage of children aged 0–59 months Coverage figure is reported as targeted. who are above two standard deviations from median weight-for-height of the α Identifies countries that are designated ‘priority’. Priority countries for national vitamin A supplementation WHO Child Growth Standards. programmes are identified as those having high under-five mortality rates (over 70 per 1,000 live births), and/or Vitamin A supplementation, full coverage – The estimated percentage of evidence of vitamin A deficiency among this age group, and/or a history of vitamin A supplementation programmes. children aged 6–59 months reached with 2 doses of vitamin A supplements f The most recent survey for this country uses an indicator definition that is not in line with the international approximately 4–6 months apart in a given calendar year. standard. If available, a previous data point that conforms to the standard definition is presented instead. Adequately iodized salt consumption – Percentage of households consuming * Data refer to the most recent year available during the period specified in the column heading. adequately iodized salt (15 parts per million or more based on rapid test kits). ** Excludes China. THE STATE OF THE WORLD’S CHILDREN 2016 125
 70 Years for Every Child Page 143 Page 145