
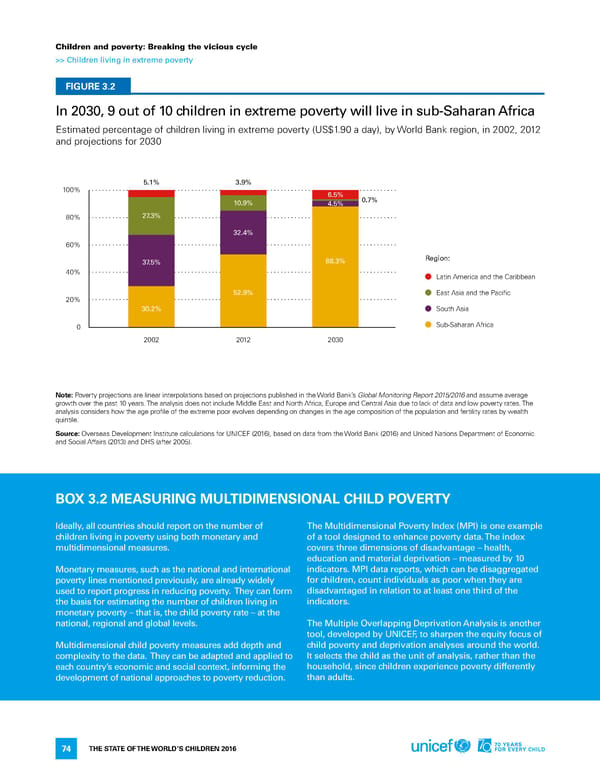
Children and poverty: Breaking the vicious cycle >> Children living in extreme poverty FIGURE 3.2 In 2030, 9 out of 10 children in extreme poverty will live in sub-Saharan Africa estimated percentage of children living in extreme poverty (US$1.90 a day), by World Bank region, in 2002, 2012 and projections for 2030 5.1% 3.9% 100% 6.5% 10.9% 4.5% 0.7% 80% 27.3% 32.4% 60% 37.5% 88.3% Region: 40% latin america and the Caribbean 52.9% east asia and the Pacific 20% 30.2% South asia 0 Sub-Saharan africa 2002 2012 2030 Note: Poverty projections are linear interpolations based on projections published in the World Bank’s Global Monitoring Report 2015/2016 and assume average growth over the past 10 years. The analysis does not include Middle east and north africa, europe and Central asia due to lack of data and low poverty rates. The analysis considers how the age profile of the extreme poor evolves depending on changes in the age composition of the population and fertility rates by wealth quintile. Source: overseas development institute calculations for UniCef (2016), based on data from the World Bank (2016) and United nations department of economic and Social affairs (2013) and dhS (after 2005). BOx 3.2 MEASURING MULTIDIMENSIONAL CHILD POvERTY Ideally, all countries should report on the number of The Multidimensional Poverty Index (MPI) is one example children living in poverty using both monetary and of a tool designed to enhance poverty data. The index multidimensional measures. covers three dimensions of disadvantage – health, education and material deprivation – measured by 10 Monetary measures, such as the national and international indicators. MPI data reports, which can be disaggregated poverty lines mentioned previously, are already widely for children, count individuals as poor when they are used to report progress in reducing poverty. They can form disadvantaged in relation to at least one third of the the basis for estimating the number of children living in indicators. monetary poverty – that is, the child poverty rate – at the national, regional and global levels. The Multiple overlapping Deprivation Analysis is another tool, developed by UNICEF, to sharpen the equity focus of Multidimensional child poverty measures add depth and child poverty and deprivation analyses around the world. complexity to the data. They can be adapted and applied t It selects the child as the unit of analysis, rather than the o each country’s economic and social context, informing the household, since children experience poverty differently development of national approaches to poverty reduction. than adults. The STaTe of The World’S Children 2016 74
 70 Years for Every Child Page 90 Page 92