
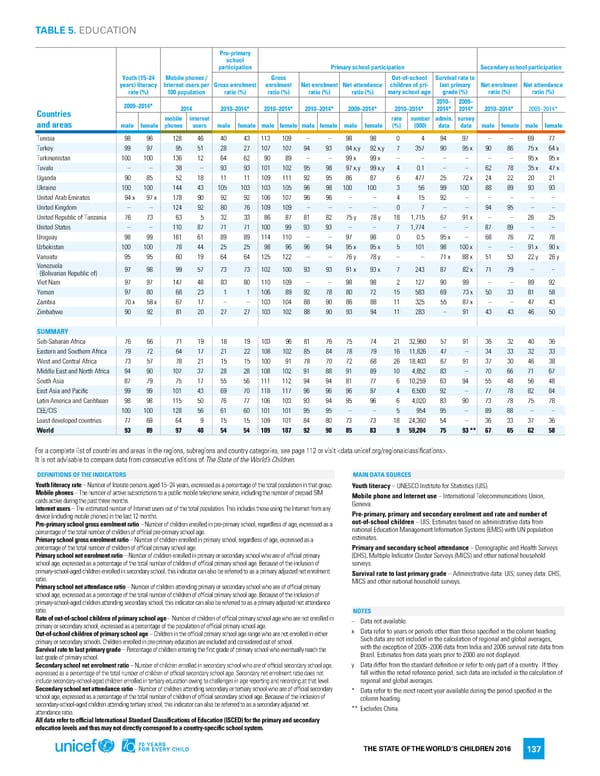
TABLE 5. EDUCATION Pre-primary school participation Primary school participation Secondary school participation Youth (15–24 Mobile phones / Gross Out-of-school Survival rate to years) literacy Internet users per Gross enrolment enrolment Net enrolment Net attendance children of pri- last primary Net enrolment Net attendance rate (%) 100 population ratio (%) ratio (%) ratio (%) ratio (%) mary school age grade (%) ratio (%) ratio (%) 2009–2014* 2010– 2009– Countries 2014 2010–2014* 2010–2014* 2010–2014* 2009–2014* 2010–2014* 2014* 2014* 2010–2014* 2009–2014* and areas mobile internet rate number admin. survey male female phones users male female male female male female male female (%) (000) data data male female male female Tunisia 98 96 128 46 40 43 113 109 – – 98 98 0 4 94 97 – – 69 77 Turkey 99 97 95 51 28 27 107 107 94 93 94x,y 92x,y 7 357 90 95x 90 86 75x 64x Turkmenistan 100 100 136 12 64 62 90 89 – – 99x 99x – – – – – – 95x 95x Tuvalu – – 38 – 93 93 101 102 95 98 97x,y 99x,y 4 0.1 – – 62 78 35x 47x Uganda 90 85 52 18 11 11 109 111 92 95 86 87 6 477 25 72x 24 22 20 21 Ukraine 100 100 144 43 105 103 103 105 96 98 100 100 3 56 99 100 88 89 93 93 United Arab Emirates 94x 97x 178 90 92 92 106 107 96 96 – – 4 15 92 – – – – – United Kingdom – – 124 92 80 76 109 109 – – – – 0 7 – – 94 95 – – United Republic of Tanzania 76 73 63 5 32 33 86 87 81 82 75y 78y 18 1,715 67 91x – – 26 25 United States – – 110 87 71 71 100 99 93 93 – – 7 1,774 – – 87 89 – – Uruguay 98 99 161 61 89 89 114 110 – – 97 98 0 0.5 95x – 68 76 72 78 Uzbekistan 100 100 78 44 25 25 98 96 96 94 95x 95x 5 101 98 100x – – 91x 90x Vanuatu 95 95 60 19 64 64 125 122 – – 76y 78y – – 71x 88x 51 53 22y 26y Venezuela 97 98 99 57 73 73 102 100 93 93 91x 93x 7 243 87 82x 71 79 – – (Bolivarian Republic of) Viet Nam 97 97 147 48 83 80 110 109 – – 98 98 2 127 90 99 – – 89 92 Yemen 97 80 68 23 1 1 106 89 92 78 80 72 15 583 69 73x 50 33 81 58 Zambia 70x 58x 67 17 – – 103 104 88 90 86 88 11 325 55 87x – – 47 43 Zimbabwe 90 92 81 20 27 27 103 102 88 90 93 94 11 283 – 91 43 43 46 50 SUMMARY Sub-Saharan Africa 76 66 71 19 18 19 103 96 81 76 75 74 21 32,960 57 91 36 32 40 36 Eastern and Southern Africa 79 72 64 17 21 22 108 102 85 84 78 79 16 11,826 47 – 34 33 32 33 West and Central Africa 73 57 78 21 15 15 100 91 78 70 72 68 26 18,403 67 91 37 30 46 38 Middle East and North Africa 94 90 107 37 28 28 108 102 91 88 91 89 10 4,852 83 – 70 66 71 67 South Asia 87 79 75 17 55 56 111 112 94 94 81 77 6 10,259 63 94 55 48 56 48 East Asia and Pacific 99 99 101 43 69 70 118 117 96 96 96 97 4 6,500 92 – 77 78 82 84 Latin America and Caribbean 98 98 115 50 76 77 106 103 93 94 95 96 6 4,020 83 90 73 78 75 78 CEE/CIS 100 100 128 56 61 60 101 101 95 95 – – 5 954 95 – 89 88 – – Least developed countries 77 69 64 9 15 15 109 101 84 80 73 73 18 24,360 54 – 36 33 37 36 orld 93 89 97 40 54 54 109 107 92 90 85 83 9 59,204 75 93** 67 65 62 58 W For a complete list of countries and areas in the regions, subregions and country categories, see page 112 or visit . It is not advisable to compare data from consecutive editions of The State of the World’s Children. DEFINITIONS OF THE INDICATORS MAIN DATA SOURCES Youth literacy rate – Number of literate persons aged 15–24 years, expressed as a percentage of the total population in that group. Youth literacy – UNESCO Institute for Statistics (UIS). Mobile phones – The number of active subscriptions to a public mobile telephone service, including the number of prepaid SIM Mobile phone and Internet use – International Telecommunications Union, cards active during the past three months. Geneva. Internet users – The estimated number of Internet users out of the total population. This includes those using the Internet from any Pre-primary, primary and secondary enrolment and rate and number of device (including mobile phones) in the last 12 months. out-of-school children – UIS. Estimates based on administrative data from Pre-primary school gross enrolment ratio – Number of children enrolled in pre-primary school, regardless of age, expressed as a national Education Management Information Systems (EMIS) with UN population percentage of the total number of children of official pre-primary school age. estimates. Primary school gross enrolment ratio – Number of children enrolled in primary school, regardless of age, expressed as a percentage of the total number of children of official primary school age. Primary and secondary school attendance – Demographic and Health Surveys Primary school net enrolment ratio – Number of children enrolled in primary or secondary school who are of official primary (DHS), Multiple Indicator Cluster Surveys (MICS) and other national household school age, expressed as a percentage of the total number of children of official primary school age. Because of the inclusion of surveys. primary-school-aged children enrolled in secondary school, this indicator can also be referred to as a primary adjusted net enrolment Survival rate to last primary grade – Administrative data: UIS; survey data: DHS, ratio. MICS and other national household surveys. Primary school net attendance ratio – Number of children attending primary or secondary school who are of official primary school age, expressed as a percentage of the total number of children of official primary school age. Because of the inclusion of primary-school-aged children attending secondary school, this indicator can also be referred to as a primary adjusted net attendance ratio. NOTES Rate of out-of-school children of primary school age – Number of children of official primary school age who are not enrolled in – Data not available. primary or secondary school, expressed as a percentage of the population of official primary school age. x Data refer to years or periods other than those specified in the column heading. Out-of-school children of primary school age – Children in the official primary school age range who are not enrolled in either Such data are not included in the calculation of regional and global averages, primary or secondary schools. Children enrolled in pre-primary education are excluded and considered out of school. with the exception of 2005–2006 data from India and 2006 survival rate data from Survival rate to last primary grade – Percentage of children entering the first grade of primary school who eventually reach the Brazil. Estimates from data years prior to 2000 are not displayed. last grade of primary school. Secondary school net enrolment ratio – Number of children enrolled in secondary school who are of official secondary school age, y Data differ from the standard definition or refer to only part of a country. If they expressed as a percentage of the total number of children of official secondary school age. Secondary net enrolment ratio does not fall within the noted reference period, such data are included in the calculation of include secondary-school-aged children enrolled in tertiary education owing to challenges in age reporting and recording at that level. regional and global averages. Secondary school net attendance ratio – Number of children attending secondary or tertiary school who are of official secondary * Data refer to the most recent year available during the period specified in the school age, expressed as a percentage of the total number of children of official secondary school age. Because of the inclusion of column heading. secondary-school-aged children attending tertiary school, this indicator can also be referred to as a secondary adjusted net ** Excludes China. attendance ratio. All data refer to official International Standard Classifications of Education (ISCED) for the primary and secondary education levels and thus may not directly correspond to a country-specific school system. THE STATE OF THE WORLD’S CHILDREN 2016 137
 70 Years for Every Child Page 155 Page 157