
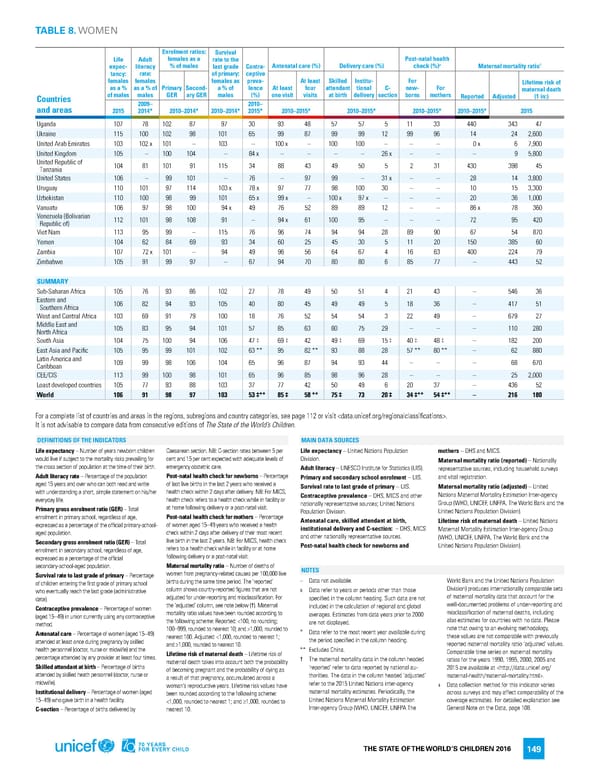
TABLE 8. WOMEN Enrolment ratios: Survival Life Adult females as a rate to the Post-natal health + † expec- literacy % of males last grade Contra- Antenatal care (%) Delivery care (%) check (%) Maternal mortality ratio tancy: rate: of primary: ceptive females females females as preva- At least Skilled Institu- For Lifetime risk of as a % as a % of Primary Second- a % of lence At least four attendant tional C- new- For maternal death Countries of males males GER ary GER males (%) one visit visits at birth delivery section borns mothers Reported Adjusted (1 in:) and areas 2009– 2010– 2015 2014* 2010–2014* 2010–2014* 2015* 2010–2015* 2010–2015* 2010–2015* 2010–2015* 2015 Uganda 107 78 102 87 97 30 93 48 57 57 5 11 33 440 343 47 Ukraine 115 100 102 98 101 65 99 87 99 99 12 99 96 14 24 2,600 United Arab Emirates 103 102x 101 – 103 – 100x – 100 100 – – – 0x 6 7,900 United Kingdom 105 – 100 104 – 84x – – – – 26x – – – 9 5,800 United Republic of 104 81 101 91 115 34 88 43 49 50 5 2 31 430 398 45 Tanzania United States 106 – 99 101 – 76 – 97 99 – 31x – – 28 14 3,800 Uruguay 110 101 97 114 103x 78x 97 77 98 100 30 – – 10 15 3,300 Uzbekistan 110 100 98 99 101 65x 99x – 100x 97x – – – 20 36 1,000 Vanuatu 106 97 98 100 94x 49 76 52 89 89 12 – – 86x 78 360 Venezuela (Bolivarian 112 101 98 108 91 – 94x 61 100 95 – – – 72 95 420 Republic of) Viet Nam 113 95 99 – 115 76 96 74 94 94 28 89 90 67 54 870 Yemen 104 62 84 69 93 34 60 25 45 30 5 11 20 150 385 60 Zambia 107 72x 101 – 94 49 96 56 64 67 4 16 63 400 224 79 Zimbabwe 105 91 99 97 – 67 94 70 80 80 6 85 77 – 443 52 SUMMARY Sub-Saharan Africa 105 76 93 86 102 27 78 49 50 51 4 21 43 – 546 36 Eastern and 106 82 94 93 105 40 80 45 49 49 5 18 36 – 417 51 Southern Africa West and Central Africa 103 69 91 79 100 18 76 52 54 54 3 22 49 – 679 27 Middle East and 105 83 95 94 101 57 85 63 80 75 29 – – – 110 280 North Africa South Asia 104 75 100 94 106 47‡ 69‡ 42 49‡ 69 15‡ 40‡ 48‡ – 182 200 East Asia and Pacific 105 95 99 101 102 63** 95 82** 93 88 28 57** 80** – 62 880 Latin America and 109 99 98 106 104 65 96 87 94 93 44 – – – 68 670 Caribbean CEE/CIS 113 99 100 98 101 65 96 85 98 96 28 – – – 25 2,000 Least developed countries 105 77 93 88 103 37 77 42 50 49 6 20 37 – 436 52 World 106 91 98 97 103 53‡** 85‡ 58** 75‡ 73 20‡ 34‡** 54‡** – 216 180 For a complete list of countries and areas in the regions, subregions and country categories, see page 112 or visit . It is not advisable to compare data from consecutive editions of The State of the World’s Children. DEFINITIONS OF THE INDICATORS MAIN DATA SOURCES Life expectancy – Number of years newborn children Caesarean section. NB: C-section rates between 5 per Life expectancy – United Nations Population mothers – DHS and MICS. would live if subject to the mortality risks prevailing for cent and 15 per cent expected with adequate levels of Division. Maternal mortality ratio (reported) – Nationally the cross section of population at the time of their birth. emergency obstetric care. Adult literacy – UNESCO Institute for Statistics (UIS). representative sources, including household surveys Adult literacy rate – Percentage of the population Post-natal health check for newborns – Percentage Primary and secondary school enrolment – UIS. and vital registration. aged 15 years and over who can both read and write of last live births in the last 2 years who received a Survival rate to last grade of primary – UIS. Maternal mortality ratio (adjusted) – United with understanding a short, simple statement on his/her health check within 2 days after delivery. NB: For MICS, Contraceptive prevalence – DHS, MICS and other Nations Maternal Mortality Estimation Inter-agency everyday life. health check refers to a health check while in facility or nationally representative sources; United Nations Group (WHO, UNICEF, UNFPA, The World Bank and the Primary gross enrolment ratio (GER) – Total at home following delivery or a post-natal visit. Population Division. United Nations Population Division). enrolment in primary school, regardless of age, Post-natal health check for mothers – Percentage Antenatal care, skilled attendant at birth, Lifetime risk of maternal death – United Nations expressed as a percentage of the official primary-school- of women aged 15–49 years who received a health institutional delivery and C-section: – DHS, MICS Maternal Mortality Estimation Inter-agency Group aged population. check within 2 days after delivery of their most recent and other nationally representative sources. (WHO, UNICEF, UNFPA, The World Bank and the Secondary gross enrolment ratio (GER) – Total live birth in the last 2 years. NB: For MICS, health check Post-natal health check for newborns and United Nations Population Division). enrolment in secondary school, regardless of age, refers to a health check while in facility or at home expressed as a percentage of the official following delivery or a post-natal visit. secondary-school-aged population. Maternal mortality ratio – Number of deaths of NOTES Survival rate to last grade of primary – Percentage women from pregnancy-related causes per 100,000 live of children entering the first grade of primary school births during the same time period. The ‘reported’ − Data not available. World Bank and the United Nations Population who eventually reach the last grade (administrative column shows country-reported figures that are not x Data refer to years or periods other than those Division) produces internationally comparable sets data). adjusted for under-reporting and misclassification. For specified in the column heading. Such data are not of maternal mortality data that account for the Contraceptive prevalence – Percentage of women the ‘adjusted’ column, see note below (†). Maternal included in the calculation of regional and global well-documented problems of under-reporting and (aged 15–49) in union currently using any contraceptive mortality ratio values have been rounded according to averages. Estimates from data years prior to 2000 misclassification of maternal deaths, including method. the following scheme: Reported: <100, no rounding; are not displayed. also estimates for countries with no data. Please Antenatal care – Percentage of women (aged 15–49) 100–999, rounded to nearest 10; and >1,000, rounded to * Data refer to the most recent year available during note that owing to an evolving methodology, attended at least once during pregnancy by skilled nearest 100. Adjusted: <1,000, rounded to nearest 1; the period specified in the column heading. these values are not comparable with previously health personnel (doctor, nurse or midwife) and the and ≥1,000, rounded to nearest 10. reported maternal mortality ratio ‘adjusted’ values. Life ** Excludes China. Comparable time series on maternal mortality percentage attended by any provider at least four times. time risk of maternal death – Lifetime risk of † The maternal mortality data in the column headed ratios for the years 1990, 1995, 2000, 2005 and Skilled attendant at birth – Percentage of births maternal death takes into account both the probability ‘reported’ refer to data reported by national au- 2015 are available at . midwife). a result of that pregnancy, accumulated across a woman’s reproductive years. Lifetime risk values have refer to the 2015 United Nations inter-agency + Data collection method for this indicator varies Institutional delivery – Percentage of women (aged been rounded according to the following scheme: maternal mortality estimates. Periodically, the across surveys and may affect comparability of the 15–49) who gave birth in a health facility. <1,000, rounded to nearest 1; and ≥1,000, rounded to United Nations Maternal Mortality Estimation coverage estimates. For detailed explanation see C-section – Percentage of births delivered by nearest 10. Inter-agency Group (WHO, UNICEF, UNFPA The General Note on the Data, page 108. THE STATE OF THE WORLD’S CHILDREN 2016 149
 70 Years for Every Child Page 167 Page 169